• Aperçu
  • Avis (6)
  • Commentaires
  • Nouveautés

ExtremeTMALine

4.8
Légèrement modifié pour la vitesse. les testeurs sont requis pour un nouveau conseiller, qui est intéressé, écrivez-moi par email 777basil@mail.ru


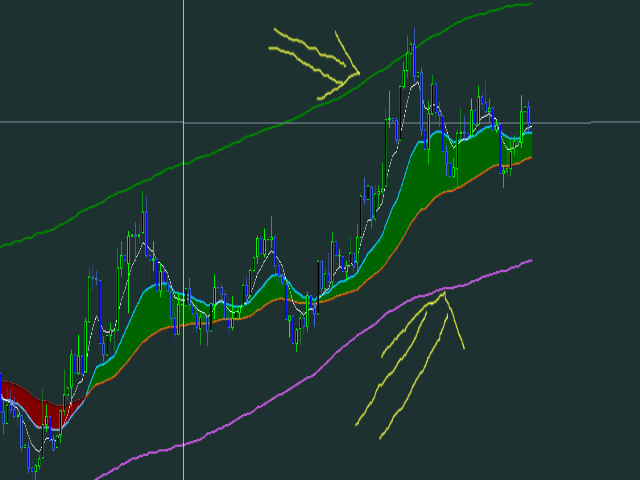
L'indicateur est calculé en fonction des changements de prix dans l'historique et est calculé mathématiquement, recalculé à chaque fois que les données sont reçues à nouveau. Il peut être utilisé sur différents délais. À partir des frontières de l'indicateur dans 70%, il y a un changement dans la direction du mouvement des prix ou de la consolidation. De cette façon, vous pouvez échanger des bateaux sur la tendance et au milieu de la manche à partir de ses frontières. Il est préférable de l'utiliser dans le trading de tendance pour déterminer les niveaux de résistance/support. dans la vidéo, vous pouvez voir comment fonctionne l'indicateur:

Avis 6
BSantiago72
70
BSantiago72 2022.11.18 13:07 
 

this is a wonderful indicator! Backtest, adjust and see for yourself. Thanks LiK’e INVEST!

13qwerty
55
13qwerty 2022.02.07 14:42 
 

Может и плагиат, но для использования гораздо лучше оригинального ВВ. Если бы можно было на графике установить индюк для страших ТФ, то цены бы не было. В сочетании с метром и уровнями полноценная безубыточная стратегия. Автору спасибо!

Luke Perrett
3346
Luke Perrett 2021.02.25 13:38 
 

Author is very helpful and considerable.

Produits recommandés
The indicator plots a curve of the difference between the values ​​of two trading instruments (currency pairs). The purpose of the indicator is to observe the processes of divergence and convergence of the values ​​of two trading instruments. The results obtained can be used for trading strategies of statistical arbitrage, pair trading, correlation, and others. Trading strategy The indicator is attached to the chart of any trading instrument. In the input parameters, the names of trading i
FREE
A professional tool for trading - the divergence indicator between the WPR and the price, which allows you to receive a signal about a trend reversal in a timely manner or catch price pullback movements (depending on the settings). The indicator settings allow you to adjust the strength of the divergence due to the angle of the WPR peaks and the percentage change in price, which makes it possible to fine-tune the signal strength. The indicator code is optimized and is tested very quickly as par
FREE
Curver Arrows
Francis Dube
4 (9)
This indicator is a straight port of a well known MetaTrader 4 indicator that is freely available on the Internet. It does not redraw at all. It implements a type of breakout strategy. The arrows indicate market direction. Use the indicator on M15 charts and higher. The indicator draws two bands near price action and generates signals when the price closes below the lower band and also above the upper band. The indicator uses periodic highs and lows to calculate upper and lower threshold bands.
FREE
Just another   Auto Fibonacci Retracement indicator . However, this is the most   Flexible   &   Reliable   one you can find for FREE. If you use this indicator and you like it, please leave a review/comment. If you are looking for a more advanced Fibo indicator, check this Free  Trend-Based Fibo indicator . ### FEATURES ### Auto-calculate up to 7 Fibonacci levels on your customized frame. Adjust levels as your need. Use High/Low price or  Open/Close price to calculate. Freeze the levels and don
FREE
SDivergence
Mobin Zarekar
1 (1)
SDivergence Indicator calculates and shows regular divergences and hidden divergences for MACD and Stochastic(for now). The benefit of this indicator is multiple input variables. Using these inputs you can modify to get more adaptive RD and HD's to your strategy. Guide : 1- First put your desired oscillator (MACD or Stochastic or Both) on the chart. 2- Run SDivergence indicator and set corresponding sub-window index of previously put oscillator in SDivergence input window. -Note: the chart sub-w
FREE
Original MACD
Kirill Paskhin
5 (3)
Moving Average Convergence/Divergence — схождение/расхождение скользящих средних — технический индикатор, разработанный Джеральдом Аппелем (Gerald Appel), используемый в техническом анализе для проверки силы и направления тренда, а также определения разворотных точек. Встроенный в MetaTrader 5 индикатор MACD не соответствует задумке автора (Gerald Appel): -линия MACD графически изображена в виде гистограммы, однако гистограммой отражается разница между линией MACD и сигнальной линией;  -сигнал
FREE
PZ The Zone MT5
PZ TRADING SLU
5 (1)
This indicator displays buy or sell signals according to Bill Williams' definition of the Trading Zone. [ Installation Guide | Update Guide | Troubleshooting | FAQ | All Products ] Easy to use and understand Avoid trading flat markets Deterministic indicator with clear rules The indicator is non-repainting It implements alerts of all kinds It has straightforward trading implications. A blue arrow is a buy signal A red arrow is a sell signal According to Bill Williams trading in the zone helps t
FREE
MACD divergence indicator finds divergences between price chart and MACD indicator and informs you with alerts (popup, mobile notification or email) . Its main use is to find trend reversals in the chart. Always use the divergence indicators with other technical assets like support resistance zones, candlestick patterns and price action to have a higher possibility to find trend reversals. Three confirmation type for MACD divergences: MACD line cross zero level Price returns to previous H/L Crea
FREE
Le Capteur de Tendance : La Stratégie du Capteur de Tendance avec Indicateur d'Alerte est un outil d'analyse technique polyvalent qui aide les traders à identifier les tendances du marché et les points d'entrée et de sortie potentiels. Elle présente une stratégie dynamique de Capteur de Tendance, s'adaptant aux conditions du marché pour une représentation visuelle claire de la direction de la tendance. Les traders peuvent personnaliser les paramètres selon leurs préférences et leur tolérance
FREE
A professional tool for trading - the divergence indicator between the  MACD and the price, which allows you to receive a signal about a trend reversal in a timely manner or catch price pullback movements (depending on the settings). The indicator settings allow you to adjust the strength of the divergence due to the angle of the  MACD peaks and the percentage change in price, which makes it possible to fine-tune the signal strength. The indicator code is optimized and is tested very quickly as
FREE
Free automatic Fibonacci is an indicator that automatically plots a Fibonacci retracement based on the number of bars you select on the BarsToScan setting in the indicator. The Fibonacci is automatically updated in real time as new highest and lowest values appears amongst the selected bars. You can select which level values to be displayed in the indicator settings. You can also select the color of the levels thus enabling the trader to be able to attach the indicator several times with differe
FREE
This is an ordinary MACD indicator displayed in the main window according to the selected chart style, i.e. Bars, Candlesticks or Line. When you switch the chart type, the indicator display also changes. Unfortunately I could not improve the chart type switching speed. After switching, there are delays before the arrival of a new tick. The indicator parameters Fast EMA period Slow EMA period Signal SMA period Applied price
FREE
MACD indicators https://mql5.com This MACD indicator looks slightly different from the MACD indicator found in many other charting software. When the value of the signal line parameter is greater than the value of the MACD parameter, the indicator will give a buy prompt, and when the signal line parameter is less than the value of the MACD parameter, the indicator will give a sell prompt.
FREE
This indicator is an automated version of the Fibonacci retracement (Fib) indicator. Deciding the best areas to use when drawing the fib can be tricky and this  indicator was made with that in mind. When you drop it on the chart it will automatically choose the best points to draw the fib with, but in case you aren't satisfied with those regions, you can adjust it as you wish.
FREE
A professional tool for trading - the divergence indicator between the MACD and the price, which allows you to receive a signal about a trend reversal in a timely manner or catch price pullback movements (depending on the settings). The indicator settings allow you to adjust the strength of the divergence due to the angle of the MACD peaks and the percentage change in price, which makes it possible to fine-tune the signal strength. The indicator code is optimized and is tested very quickly as p
FREE
HydraAlchemist
Haruki Teranaka
Présentation d'HydraAlchemist, un outil de trading automatisé innovant. Cet Expert Advisor (EA) de pointe combine habilement plusieurs indicateurs techniques pour identifier les opportunités de trading prometteuses sur les marchés financiers. Nous visons à maximiser les profits en examinant les signaux obtenus à partir d’indicateurs tels que MACD, stochastique et RSI en utilisant notre propre logique et en saisissant avec précision les tendances et les tournants du marché. La véritable force
FREE
Macd Rsi
Ignacio Agustin Mene Franco
macd rsi It is a macd indicator added to the rsi to capture perfect entries in the average crossovers! As seen in the indicator, it has 2 lines, one of gold color and the other violet line, where the cross of the violet with the gold downwards is a sell signal when it crosses the violet up from the gold it is a buy signal! very good to make shorts works for forex markets and synthetic indices It is used in any temporality! Good profit! World Investor.
A professional tool for trading - the divergence indicator between the  Stochastic and the price, which allows you to receive a signal about a trend reversal in a timely manner or catch price pullback movements (depending on the settings). The indicator settings allow you to adjust the strength of the divergence due to the angle of the  Stochastic peaks and the percentage change in price, which makes it possible to fine-tune the signal strength. The indicator code is optimized and is tested ver
FREE
A professional tool for trading - the divergence indicator between the RSI and the price, which allows you to receive a signal about a trend reversal in a timely manner or catch price pullback movements (depending on the settings). The indicator settings allow you to adjust the strength of the divergence due to the angle of the RSI peaks and the percentage change in price, which makes it possible to fine-tune the signal strength. The indicator code is optimized and is tested very quickly as par
FREE
La stratégie de trading Moving Average Convergence Divergence (MACD) est un outil d'analyse technique populaire utilisé pour identifier les changements de momentum et de direction de tendance. Le MACD est calculé en soustrayant la moyenne mobile exponentielle (EMA) sur 26 périodes de la EMA sur 12 périodes. Une EMA sur 9 périodes, appelée "ligne de signal", est ensuite tracée sur le MACD pour agir comme déclencheur des signaux d'achat et de vente. Le MACD est considéré comme étant en territoire
FREE
OsMA DA
Vitaly Dodonov
Что такое OsMA DA?   Индикатор OsMA DA – это осциллятор, который построен на показаниях другого осциллятора – MACD. OsMA DA показывает расхождение между сигнальной линией MACD и его гистограммой. Момент пересечения гистограммы и линии – это нулевая отметка OsMA.   Если гистограмма MACD поднимается выше линии, то гистограмма самого OsMA DA поднимается выше нулевой отметки. В обратной ситуации OsMA DA демонстрирует отрицательные значения.   OsMA DA более узконаправленный индикатор, чем MACD. OsMA
FREE
The   OHLC indicator   shows the current and historical values of High, Low, Open, Close and Mid for a specific time period. It can plot the current values or the values from the previous session. The indicator's range can be calculated from a daily, weekly, monthly, or user-specified session. Levels High  of the current or previous session. Low  of the current or previous session. Open  of current or previous session. Close  of the current or previous session. Midpoint  of the current or pre
FREE
SSACD - Singular Spectrum Average Convergence/Divergence This is an analogue of the MACD indicator based on the Caterpillar-SSA ( Singular Spectrum Analysis ) method. Limited version of the SSACD Forecast indicator. Limitations include the set of parameters and their range. Specificity of the method The Caterpillar-SSA is an effective method to handle non-stationary time series with unknown internal structure. The method allows to find the previously unknown periodicities of the series and mak
FREE
Paula Bollinger Bands Strategy
Francisco Gomes Da Silva
4 (2)
Bollinger bands out/in strategy A strategy created by Joe Ross, and very useful for finding trades when the market is overloaded. Indicator You don't need to find where there are entries on the chart, this indicator shows them for you. The entrance The trade is confirmed when the price closes outside the bollinger bands on a candle and the candle after the price closes inside the bands. comment I want to improve this indicator, so you can help me sending me your reviews and comments, thanks :).
FREE
This indicator draws regular bullish and bearish divergences in real-time onto the charts. The algorithm to detect those divergences is based on my 10+ years experience of detecting divergences visually. The divergences are drawn as green and red rectangles on the charts. You can even do forward testing in the visual mode of the strategy tester. This FREE Version is restricted to EURUSD and GBPUSD. The full version without restrictions is here:  https://www.mql5.com/en/market/product/42758 Par
FREE
Индикатор, показывающий момент преодоления нулевой отметки индикатора MACD. Индикатор стрелочный и может быть использован для торговли бинарными опционами. Входные параметры Period of SMA1  - Период 1 скользящей средней Period of SMA2 -  Период 2 скользящей средней Period of SMA3 -  Период 3 скользящей средней Inform about finding the signal  - подавать уведомление, при нахождении сигнала
FREE
This is the best Support and Resistance Indicator on the market, and it shows both confirmed Support and Resistance as well as Retests. Support & Resistance: Support marks where buying demand halts price declines, acting as a safety net. Resistance caps price surges, driven by selling pressure. Traders leverage these levels to predict reversals, plan entries, exits, and manage risks, making them trading's fundamental guideposts. You can also find Premium and Discount Levels, Strong High/Low,  
FREE
AliPivot Points is a Meta Trader 5 Indicator that draws you the latest pivot points. You can choose from timeframes ranging from 1 Minute to 1 Month. Calculation methods for pivot points includes: Classic Pivot Points Camarilla Pivot Points Fibonacci Pivot Points Woodie Pivot Points You can personalize the line colors, style, and width to suit your preference. The indicator displays values on the right side of the chart. AliPivot Points values can also be utilized by developers for creating Expe
FREE
Bounce Zone MT5
Nguyen Thanh Cong
4 (6)
Introduction The Bounce Zone indicator is a cutting-edge non-repainting technical tool built to identify key areas on the price chart where market sentiment is likely to cause a significant price reversal. Using advanced algorithms and historical price data analysis, this indicator pinpoints potential bounce zones. Combined with other entry signal, this indicator can help forex traders place the best trades possible Signal A possible buy signal is generated when price is in the green zo
FREE
Pro MACD Lite
Eveline Van Neyghem
4.33 (3)
Simple alternate MACD version like the one used in tradingview. Two lines (MACD & signal line) and a histogram. This MACD version can be used in many different ways. Potential trades are the crossing of the MACD & signal line, the crossing of the MACD through the 0-line of the histogram, the MACD being under the 0-line of the histogram or the movement of the histogram itself. A combination of these potential signals on different timeframes can be very precise, but always needs additional confirm
FREE
Les acheteurs de ce produit ont également acheté
Atomic Analyst MT5
Issam Kassas
3.64 (11)
Tout d'abord, il convient de souligner que cet indicateur de trading n'est ni repainting, ni redrawing et ne présente aucun délai, ce qui le rend idéal à la fois pour le trading manuel et automatisé. L'Analyste Atomique est un indicateur d'action sur les prix PA qui utilise la force et le momentum du prix pour trouver un meilleur avantage sur le marché. Équipé de filtres avancés qui aident à éliminer les bruits et les faux signaux, et à augmenter le potentiel de trading. En utilisant plusieur
Tout d'abord, il convient de souligner que ce système de trading est un indicateur non repeint, non redessiné et non retardé, ce qui le rend idéal pour le trading manuel et automatisé. Le "Système de Trading Smart Trend MT5" est une solution de trading complète conçue pour les traders débutants et expérimentés. Il combine plus de 10 indicateurs premium et propose plus de 7 stratégies de trading robustes, ce qui en fait un choix polyvalent pour différentes conditions de marché. Stratégie de suivi
Quantum Trend Sniper
Bogdan Ion Puscasu
5 (37)
Présentation       Quantum Trend Sniper Indicator   , l'indicateur révolutionnaire MQL5 qui transforme la façon dont vous identifiez et négociez les inversions de tendance ! Développé par une équipe de traders expérimentés avec une expérience commerciale de plus de 13 ans,       Indicateur Quantum Trend Sniper       est conçu pour propulser votre parcours de trading vers de nouveaux sommets grâce à sa manière innovante d'identifier les inversions de tendance avec une précision extrêmement élevée
Trend Screener Pro MT5
STE S.S.COMPANY
4.89 (61)
Indicateur de tendance, solution unique révolutionnaire pour le trading et le filtrage des tendances avec toutes les fonctionnalités de tendance importantes intégrées dans un seul outil ! Il s'agit d'un indicateur multi-période et multi-devises 100 % non repeint qui peut être utilisé sur tous les symboles/instruments : forex, matières premières, crypto-monnaies, indices et actions. Trend Screener est un indicateur de suivi de tendance efficace qui fournit des signaux de tendance fléchés avec des
Gold Stuff mt5
Vasiliy Strukov
4.88 (163)
Gold Stuff mt5 est un indicateur de tendance conçu spécifiquement pour l'or et peut également être utilisé sur n'importe quel instrument financier. L'indicateur ne se redessine pas et ne traîne pas. Délai recommandé H1. Contactez-moi immédiatement après l'achat pour obtenir les réglages et un bonus personnel !   RÉGLAGES Dessiner la flèche - on off. dessiner des flèches sur le graphique. Alertes - activation et désactivation des alertes sonores. Notification par e-mail - activé désactivé.
FX Volume MT5
Daniel Stein
4.94 (17)
Obtenez votre mise à jour quotidienne du marché avec des détails et des captures d'écran via notre Morning Briefing ici sur mql5 et sur Telegram ! FX Volume est le PREMIER et SEUL indicateur de volume qui fournit un VRAI aperçu du sentiment du marché du point de vue d'un courtier. Il fournit des informations impressionnantes sur la façon dont les acteurs institutionnels du marché, comme les courtiers, sont positionnés sur le marché des changes, bien plus rapidement que les rapports COT. Voir c
RelicusRoad Pro MT5
Relicus LLC
4.81 (21)
Maintenant 147 $ (augmentant à 499 $ après quelques mises à jour) - Comptes illimités (PCS ou Mac) Manuel d'utilisation RelicusRoad + Vidéos de formation + Accès au groupe Discord privé + Statut VIP UNE NOUVELLE FAÇON DE REGARDER LE MARCHÉ RelicusRoad est l'indicateur de trading le plus puissant au monde pour le forex, les contrats à terme, les crypto-monnaies, les actions et les indices, offrant aux traders toutes les informations et tous les outils dont ils ont besoin pour rester renta
FX Power MT5 NG
Daniel Stein
5 (4)
Obtenez votre mise à jour quotidienne du marché avec des détails et des captures d'écran via notre Morning Briefing ici sur mql5 et sur Telegram ! FX Power MT5 NG est la nouvelle génération de notre très populaire indicateur de force des devises, FX Power. Et qu'est-ce que ce compteur de force de nouvelle génération offre ? Tout ce que vous avez aimé de l'original FX Power PLUS Analyse de la force de l'OR/XAU Des résultats de calcul encore plus précis Périodes d'analyse configurables individuel
Advanced Supply Demand MT5
Bernhard Schweigert
4.53 (15)
La meilleure solution pour tout commerçant débutant ou expert ! Cet indicateur est un outil de trading unique, de haute qualité et abordable car nous avons intégré un certain nombre de fonctionnalités propriétaires et une nouvelle formule. Avec cette mise à jour, vous pourrez afficher des zones à double horaire. Vous pourrez non seulement afficher un TF plus élevé, mais afficher les deux, le graphique TF, PLUS le TF supérieur : AFFICHAGE DES ZONES NICHÉES. Tous les traders Supply Demand vont ado
Tout d'abord, il convient de souligner que cet outil de trading est un indicateur non repeint, non redessiné et non retardé, ce qui le rend idéal pour le trading professionnel. L'indicateur Smart Price Action Concepts est un outil très puissant à la fois pour les nouveaux et les traders expérimentés. Il regroupe plus de 20 indicateurs utiles en un seul, combinant des idées de trading avancées telles que l'analyse du trader Inner Circle et les stratégies de trading Smart Money Concepts. Cet in
XQ Indicator MetaTrader 5
Marzena Maria Szmit
5 (1)
Step into the realm of Forex trading with confidence and precision using XQ, a cutting-edge Forex indicator designed to elevate your trading game to unprecedented heights. Whether you're a seasoned trader or just stepping into the world of currency exchange, XQ Forex Indicator empowers you with the insights and signals needed to make informed trading decisions. The signal conditions are a combination of three indicators, and XQ Forex Indicator only display  medium and long-term trends . The ind
The Volume by Price Indicator for MetaTrader 5 features Volume Profile and Market Profile TPO (Time Price Opportunity). Get valuable insights out of currencies, equities and commodities data. Gain an edge trading financial markets. Volume and TPO histogram bar and line charts. Volume Footprint charts. TPO letter and block marker charts including split structures. Versatile segmentation and compositing methods. Static, dynamic and flexible ranges with relative and/or absolute visualizations. Lay
Présentation       Quantum Breakout PRO   , l'indicateur révolutionnaire MQL5 qui transforme la façon dont vous négociez les zones d'évasion ! Développé par une équipe de traders expérimentés avec une expérience commerciale de plus de 13 ans,       Évasion quantique PRO       est conçu pour propulser votre parcours commercial vers de nouveaux sommets grâce à sa stratégie de zone de discussion innovante et dynamique. Quantum Breakout Indicator vous donnera des flèches de signalisation sur le
ICT, SMC, SMART MONEY CONCEPTS, SMART MONEY, Smart Money Concept, Support and Resistance, Trend Analysis, Price Action, Market Structure, Order Blocks, BOS/CHoCH,   Breaker Blocks ,  Momentum Shift,   Supply&Demand Zone/Order Blocks , Strong Imbalance,   HH/LL/HL/LH,    Fair Value Gap, FVG,  Premium  &   Discount   Zones, Fibonacci Retracement, OTE, Buy Side Liquidity, Sell Side Liquidity, BSL/SSL Taken, Equal Highs & Lows, MTF Dashboard, Multiple Time Frame, BigBar, HTF OB, HTF Market Structure
Top indicator for MT5   providing accurate signals to enter a trade without repainting! It can be applied to any financial assets:   forex, cryptocurrencies, metals, stocks, indices .  Watch  the video  (6:22) with an example of processing only one signal that paid off the indicator! MT4 version is here It will provide pretty accurate trading signals and tell you when it's best to open a trade and close it. Most traders improve their trading results during the first trading week with the help of
AW Trend Predictor MT5
AW Trading Software Limited
4.76 (54)
La combinaison des niveaux de tendance et de panne dans un seul système. Un algorithme d'indicateur avancé filtre le bruit du marché, détermine la tendance, les points d'entrée, ainsi que les niveaux de sortie possibles. Les signaux indicateurs sont enregistrés dans un module statistique, qui vous permet de sélectionner les outils les plus appropriés, montrant l'efficacité de l'historique des signaux. L'indicateur calcule les marques Take Profit et Stop Loss. Manuel et instruction ->   ICI   / v
Auto Order Block with break of structure based on ICT and Smart Money Concepts Futures Break of Structure ( BoS )             Order block ( OB )            Higher time frame Order block / Point of Interest ( POI )    shown on current chart           Fair value Gap ( FVG ) / Imbalance   ,  MTF      ( Multi Time Frame )    Volume Imbalance     ,  MTF          vIMB Gap’s Equal High / Low’s     ,  MTF             EQH / EQL Liquidity               Current Day High / Low           HOD /
L'indicateur de Carré Gann est un puissant outil d'analyse du marché basé sur l'article "Formule Mathématique pour les Prédictions de Marché" écrit par W.D. Gann. Cet outil utilise des concepts mathématiques et des théories de Gann pour réaliser une analyse précise du marché. Il utilise les carrés de 144, 90, 52 et aussi le carré de 9. De plus, il intègre la méthode du  pour le carré de 9 et sa relation avec les canaux et le modèle en étoile de ce carré. Manuel d'Utilisateur et Application : Ava
TrendMaestro5
Stefano Frisetti
note: this indicator is for METATRADER4, if you want the version for METATRADER5 this is the link:  https://www.mql5.com/it/market/product/108106 TRENDMAESTRO recognizes a new TREND in the bud, he never makes mistakes. The certainty of identifying a new TREND is priceless. DESCRIPTION TRENDMAESTRO identifies a new TREND in the bud, this indicator examines the volatility, volumes and momentum to identify the moment in which there is an explosion of one or more of these data and therefore the mome
Le profit de la structure du marché change à mesure que le prix s'inverse et recule. L'indicateur d'alerte d'inversion de la structure du marché identifie le moment où une tendance ou un mouvement de prix approche de l'épuisement et est prêt à s'inverser. Il vous avertit des changements dans la structure du marché qui se produisent généralement lorsqu'un renversement ou un recul majeur est sur le point de se produire. L'indicateur identifie initialement les cassures et la dynamique des prix,
Trend Line Map Pro MT5
STE S.S.COMPANY
4.67 (9)
Trend Line Map indicator is an addons for   Trend Screener Indicator . It's working as a scanner for all signals generated by Trend screener ( Trend Line Signals ) . It's a Trend Line Scanner based on Trend Screener Indicator.  If you don't have Trend Screener Pro Indicator,   the Trend Line Map Pro will not work.     LIMITED TIME OFFER : Trend Line Map Indicator is available for only 50 $ and lifetime. ( Original price 125$ ) By accessing to our MQL5 Blog,  you can find all our premium indica
Blahtech Supply Demand MT5
Blahtech Limited
4.57 (14)
Was: $299  Now: $99   Supply Demand uses previous price action to identify potential imbalances between buyers and sellers. The key is to identify the better odds zones, not just the untouched ones. Blahtech Supply Demand indicator delivers functionality previously unavailable on any trading platform. This 4-in-1 indicator not only highlights the higher probability zones using a multi-criteria strength engine, but also combines it with multi-timeframe trend analysis, previously confirmed swings
Owl Smart Levels MT5
Sergey Ermolov
4.47 (36)
Version MT4   |  FAQ L' indicateur Owl Smart Levels est un système de trading complet au sein d'un seul indicateur qui comprend des outils d'analyse de marché populaires tels que les fractales avancées de Bill Williams , Valable ZigZag qui construit la structure d'onde correcte du marché et les niveaux de Fibonacci qui marquent les niveaux exacts d'entrée. sur le marché et les endroits où prendre des bénéfices. Description détaillée de la stratégie Mode d'emploi de l'indicateur Conseiller-Assis
TPSpro TRENDPRO  - is a trend indicator that automatically analyzes the market and provides information about the trend and each of its changes, as well as giving signals for entering trades without redrawing! The indicator uses each candle, analyzing them separately. referring to different impulses - up or down impulse. Exact entry points into transactions for currencies, crypto, metals, stocks, indices!  -  Version MT4                  DETAILED DESCRIPTION        /       TRADING SETUPS       
TrendLine PRO MT5
Evgenii Aksenov
4.78 (49)
The Trend Line PRO indicator is an independent trading strategy. It shows the trend change, the entry point to the transaction, as well as automatically calculates three levels of Take Profit and Stop Loss protection Trend Line PRO is perfect for all Meta Trader symbols: currencies, metals, cryptocurrencies, stocks and indices Advantages of Trend Line PRO Never redraws its signals The possibility of using it as an independent strategy It has three automatic levels Take Profit and Stop Loss lev
Gartley Hunter Multi
Siarhei Vashchylka
5 (5)
Gartley Hunter Multi - An indicator for searching for harmonic patterns simultaneously on dozens of trading instruments and on all classic timeframes: (m1, m5, m15, m30, H1, H4, D1, Wk, Mn). Manual (Be sure to read before purchasing) | Version for MT4 Advantages 1. Patterns: Gartley, Butterfly, Shark, Crab. Bat, Alternate Bat, Deep Crab, Cypher 2. Simultaneous search for patterns on dozens of trading instruments and on all classic timeframes 3. Search for patterns of all possible sizes. Fr
TrendDecoder Premium MT5
Christophe, Pa Trouillas
5 (1)
Identifiez les ranges et les tendances fortes  |  Obtenez les premiers signaux   |    Obtenez des TP et des sorties   clairs   |    Repérer les niveaux Fibo que le prix va tester   |  Indicateur qui ne retrace pas, non retardé - idéal pour le trading manuel et automatisé - adapté à tous les actifs et à toutes les unités de temps - 50% discount   pour le lancement - puis retour à >>   149 $ Après votre achat,   contactez-moi sur ce canal  pour obtenir les réglages recommandés. Version MT4 :   cli
Was: $249  Now: $99   Market Profile defines a number of day types that can help the trader to determine market behaviour. A key feature is the Value Area, representing the range of price action where 70% of trading took place. Understanding the Value Area can give traders valuable insight into market direction and establish the higher odds trade. It is an excellent addition to any system you may be using. Inspired by Jim Dalton’s book “Mind Over Markets”, this indicator is designed to suit the
Golden Spikes Detector
Batsirayi L Marango
5 (1)
Golden Spikes Detector Cet indicateur est basé sur une stratégie avancée principalement pour les pics de trading sur les indices Boom et Crash. Des algorithmes complexes ont été mis en œuvre pour détecter uniquement les entrées à forte probabilité. Il alerte sur les entrées potentielles d’achat et de vente. Pour échanger des pics sur le courtier Deriv ou Binary, prenez uniquement les alertes Buy Boom et Sell Cash. Il a été optimisé pour être chargé sur une période de 5 minutes, bien qu'une analy
Matrix Arrow Indicator MT5
Juvenille Emperor Limited
5 (14)
Matrix Arrow Indicator MT5   est une tendance unique 10 en 1 suivant un indicateur multi-période   100% non repeint   qui peut être utilisé sur tous les symboles/instruments:   forex ,   matières premières ,   crypto-monnaies ,   indices ,  actions .  Matrix Arrow Indicator MT5  déterminera la tendance actuelle à ses débuts, en rassemblant des informations et des données à partir d'un maximum de 10 indicateurs standard, qui sont: Indice de mouvement directionnel moyen (ADX) Indice de canal de m
Plus de l'auteur
Ind2tompson
Vasilii Luchnikov
5 (1)
The 2indtompson indicator is an indicator for comparing two instruments for determining volumes, for balancing in pair trading or arbitrage trading, prepared from an analog version for the MT4 terminal. So if you need to compare how much two instruments will weigh and you don't know how to do it, then put an indicator on the chart and it will automatically calculate the volumes needed for balancing. Additionally, the indicator shows the state of the instruments relative to each other - Divergenc
FREE
Mtrx2tompson
Vasilii Luchnikov
5 (1)
The indicator is based on indicators built-in standard indicators, the indicator take into account the current indicators 30 indicators and give a signal to buy or sell, the General trend of all trends of other indicators. In the input parameters, you can configure special parameters for each indicator. the indicator is executed in the form of an oscillator and shows the General trend and the preponderance of all indicators in one or the other direction. https://youtu.be/UG2ZZEH9B_U
FREE
VolumeSpreadtompson
Vasilii Luchnikov
5 (1)
hello. The indicator shows the levels of change in the spread per unit of time when its values are higher. Practice shows that the change in volumes is associated with the warning and advance of speculative activity, especially at key moments: Fed news, oil news, speeches by leaders of the IDR countries.   We are very happy to present new developments. Thanks. 
FREE
DuettoFXTompson
Vasilii Luchnikov
4 (1)
The DuettoFXTompson indicator is designed to work with two instruments that have a high level of correlation. the indicator can be used for pair trading on currencies, stocks, and other financial instruments. The indicator shows the moment when the instruments diverge and the sum of the two instruments (yellow line). additionally, the parameter of the Average MA value is calculated. Recommended timeframe for M5 operation. Contacts for communication 777basil@mail.ru we will prepare an expert, a
FREE
SynchroWindowTomson
Vasilii Luchnikov
5 (1)
Привет. Сегодня представляем индикатор корреляции -  SynchroWindowTomson. Индикатор в одном окне показывает движение нескольких инструментов, по отношению друг к другу, удобно определять направление и изменение, особенно когда вы работаете с целым портфелем разных инструментов и нужно определить какой из них тянет результат назад и движется в другую сторону. Так же видны точки разворота спреда.
FREE
Добрый день. Сегодня добавили вспомогательный индикатор тренда DveMashkiTompson, идея взята из аналога МТ4 и перенесена на МТ5, используется совместно с индикаторами Тренда ТМА и МА, рисует красные и зеленые области в зависимости от направления рынка. Тренд вверх -зеленые области, тренд вниз -красные.Области основываются на пересечении индикатора МА, таким образом данный индикатор дает информацию графического содержания для более быстрой оценки ситуации и принятия решения.
FREE
MaxlotTomson
Vasilii Luchnikov
5 (2)
Good afternoon. Today we offer the maxlottomson indicator to determine the maximum volume that you can put up for purchase or sale, if you look at your deposit level. This indicator is convenient to use for News trading, when you need to determine the entry point on a high-speed movement and calculate the risk level as a percentage of the deposit, the maxlottomson indicator shows the maximum value of the LOT volume for your deposit that you can use for trading.
FREE
Hi. PortfolioHedgingStopOrderOneSymbol-trend EA for opening orders from mid-channel on the third wave Elliot, is working on the breakdown of the level from a custom indicator TMA channel width with fixed S / L and T / P. this EA is designed to determine the best entry point into the market after the correction. if you have confirmation of a strong trend movement, but if you are a novice and still doubt the correctness of your actions, it is always better to wait for the correction to finish and
Hello. CatchCandleLimitOrderOneSymbol-flat expert Advisor, for opening orders from the channel borders to the center, works on pullbacks from the support and resistance levels, from the custom channel width indicator TMA, with a fixed S/L and T / P. The EA is designed to trade off the levels when a particular trend movement, and is no doubt the continuation of the trend, the Levels are shifted automatically with the price based on the channel boundaries and the extreme price deviation for a be
VolumeTick
Vasilii Luchnikov
Indicator VolumeTick https://youtu.be/tmHZKdMCMGo made for rapid identification of possible reversal points, when the conditions of consolidation and bi-directional trading traders, the number of volumes in the market increases sharply, which shows the interest of the participants to change the direction of movement of the tool market and counts the number of ticks on each bar, made in the form of an oscillator. This way we can foresee stopping trading or trading in the other direction, or add
https://youtu.be/Ze9zPpYtIrI GridCatchCandleLimitOrderOneSymbol is a Grid flat expert Advisor for opening orders from the channel borders to the center. it works on pullbacks from the support and resistance levels, from the custom TMA channel width indicator, with fixed S/L and T / P. The EA is designed to trade off the levels when a particular trend movement, and is no doubt the continuation of the trend, the Levels are shifted automatically with the price based on the channel boundaries and
The CatchPositionByStopOrder trading expert is designed to work on a trending market when the direction of trading is known, you can trade both SELLSTOP and BUYSTOP orders, and you can trust the expert himself to choose the direction. Sets pending STOP orders and moves them behind the price to determine the most effective entry point. The recommended timeframe for trading is M5/M15/H1. In the expert Advisor, you can work with fixed S/l and T/p, as well as with the help of a trawl. if T / p=0, t
Good afternoon. Today we present a new indicator PointIntoChannelTOMSON https://youtu.be/dmgtVwX3nvg https://youtu.be/Wr7N2WEY8lA -this indicator is calculated from the channel to the level of price deviation in the direction of buying and selling, the green and red window of indicators, respectively. The higher the deviation level, the greater the probability of a reversal. The indicator readings are recalculated with each new bar and it is recommended to use it only as an auxiliary one
UturnAnalysis
Vasilii Luchnikov
Good afternoon. UturnAnalysis - to check the quality of the indicator WE HAVE LAUNCHED A TRIAL VERSION free distribution of signals about reversals based on this indicator for the futures and stock markets of the MICEX write to tech support, me 777basil@mail.ru , or in the comments your email address and we will send you the account details where the alerts are sent, for free. https://youtu.be/q228LvLec-Y we put it on several tools at once https://youtu.be/Wr7N2WEY8lA will save you time a
Filtrer:
Ngonidzashe Calven Chingonzo
124
Ngonidzashe Calven Chingonzo 2024.04.02 15:36 
 

nice indicator

BSantiago72
70
BSantiago72 2022.11.18 13:07 
 

this is a wonderful indicator! Backtest, adjust and see for yourself. Thanks LiK’e INVEST!

13qwerty
55
13qwerty 2022.02.07 14:42 
 

Может и плагиат, но для использования гораздо лучше оригинального ВВ. Если бы можно было на графике установить индюк для страших ТФ, то цены бы не было. В сочетании с метром и уровнями полноценная безубыточная стратегия. Автору спасибо!

GANDURAS
14
GANDURAS 2021.07.06 16:40 
 

Индикатор ни о чем. Дешевый плагиат. В CodeBase есть оригинал.

Luke Perrett
3346
Luke Perrett 2021.02.25 13:38 
 

Author is very helpful and considerable.

Aleksandr Tamonin
4109
Aleksandr Tamonin 2021.01.24 09:05 
 

Неплохой индикатор, но использовать можно только как дополнительный фильтр. Автору спасибо.

Répondre à l'avis
Version 1.2 2021.02.20
Добрый день. Добавили в описательную часть адреса обратной связи технической поддержки, для оперативного реагирования и устранения сбоев.Спасибо.