Support Resistance screnner
- Indicateurs
- STE S.S.COMPANY
- Version: 13.20
- Mise à jour: 13 décembre 2023
- Activations: 10
Support And Resistance Screener est dans un indicateur de niveau pour MetaTrader qui fournit plusieurs outils à l'intérieur d'un indicateur. Les outils disponibles sont :
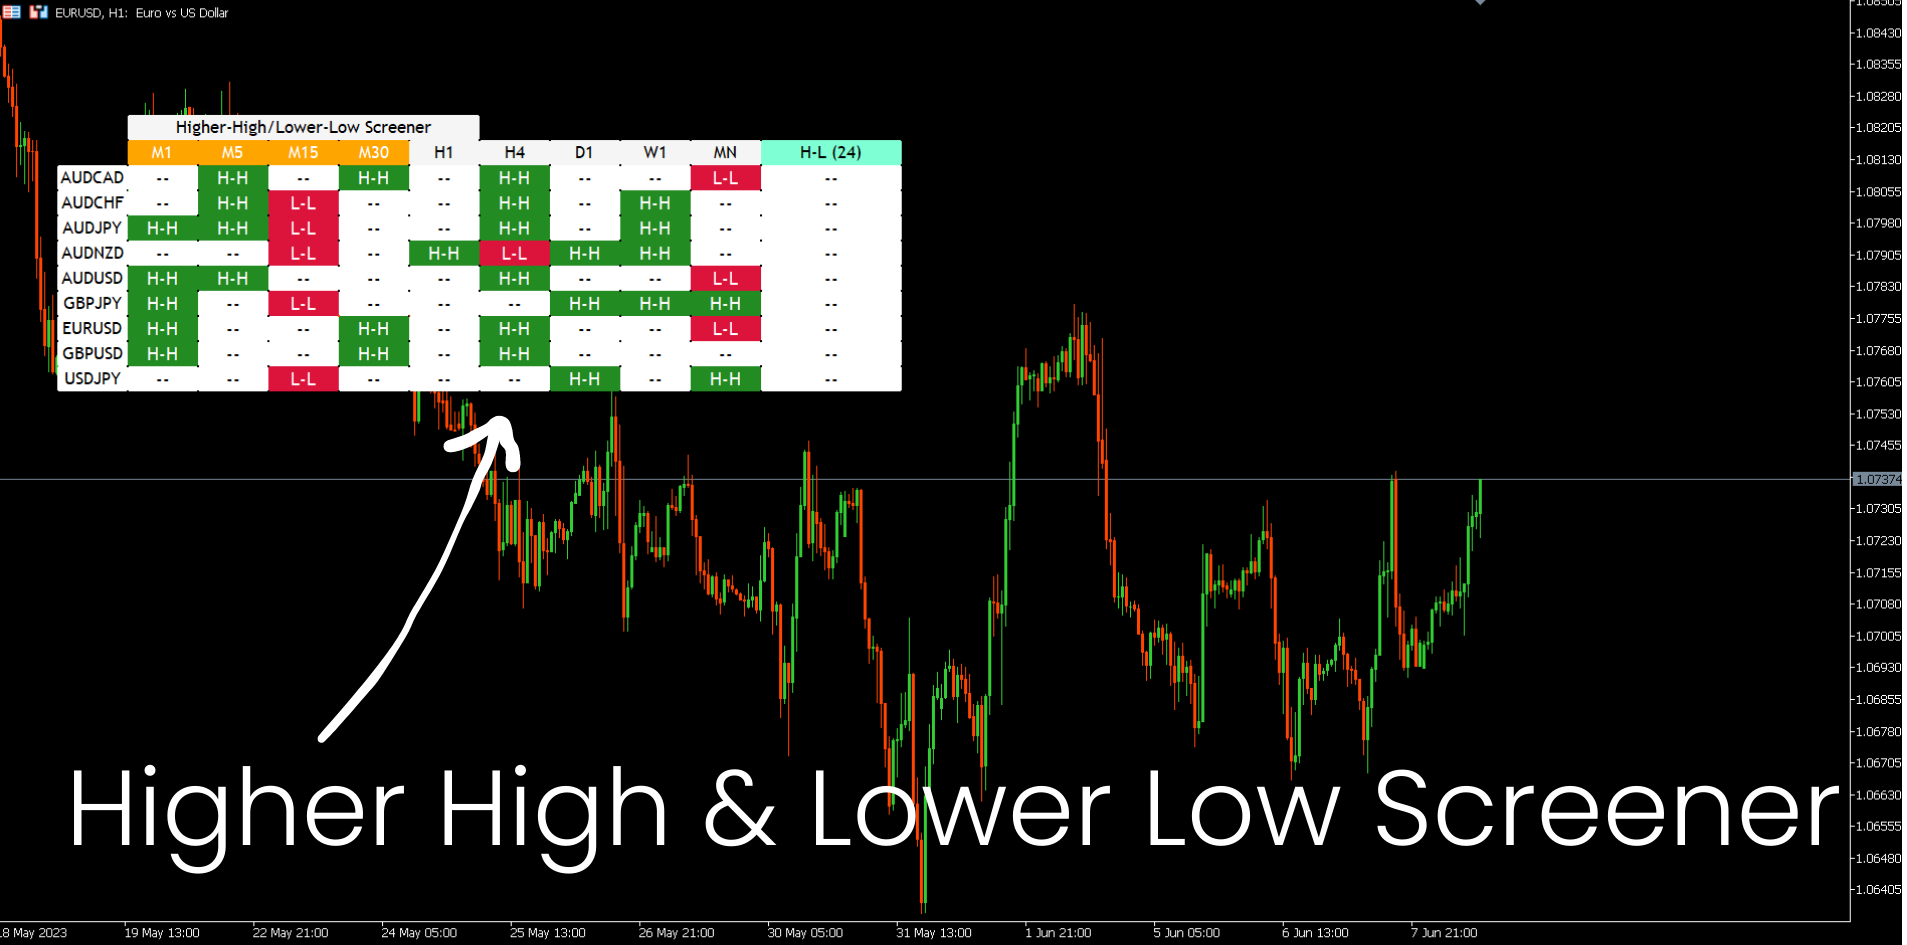
1. Filtre de structure de marché.
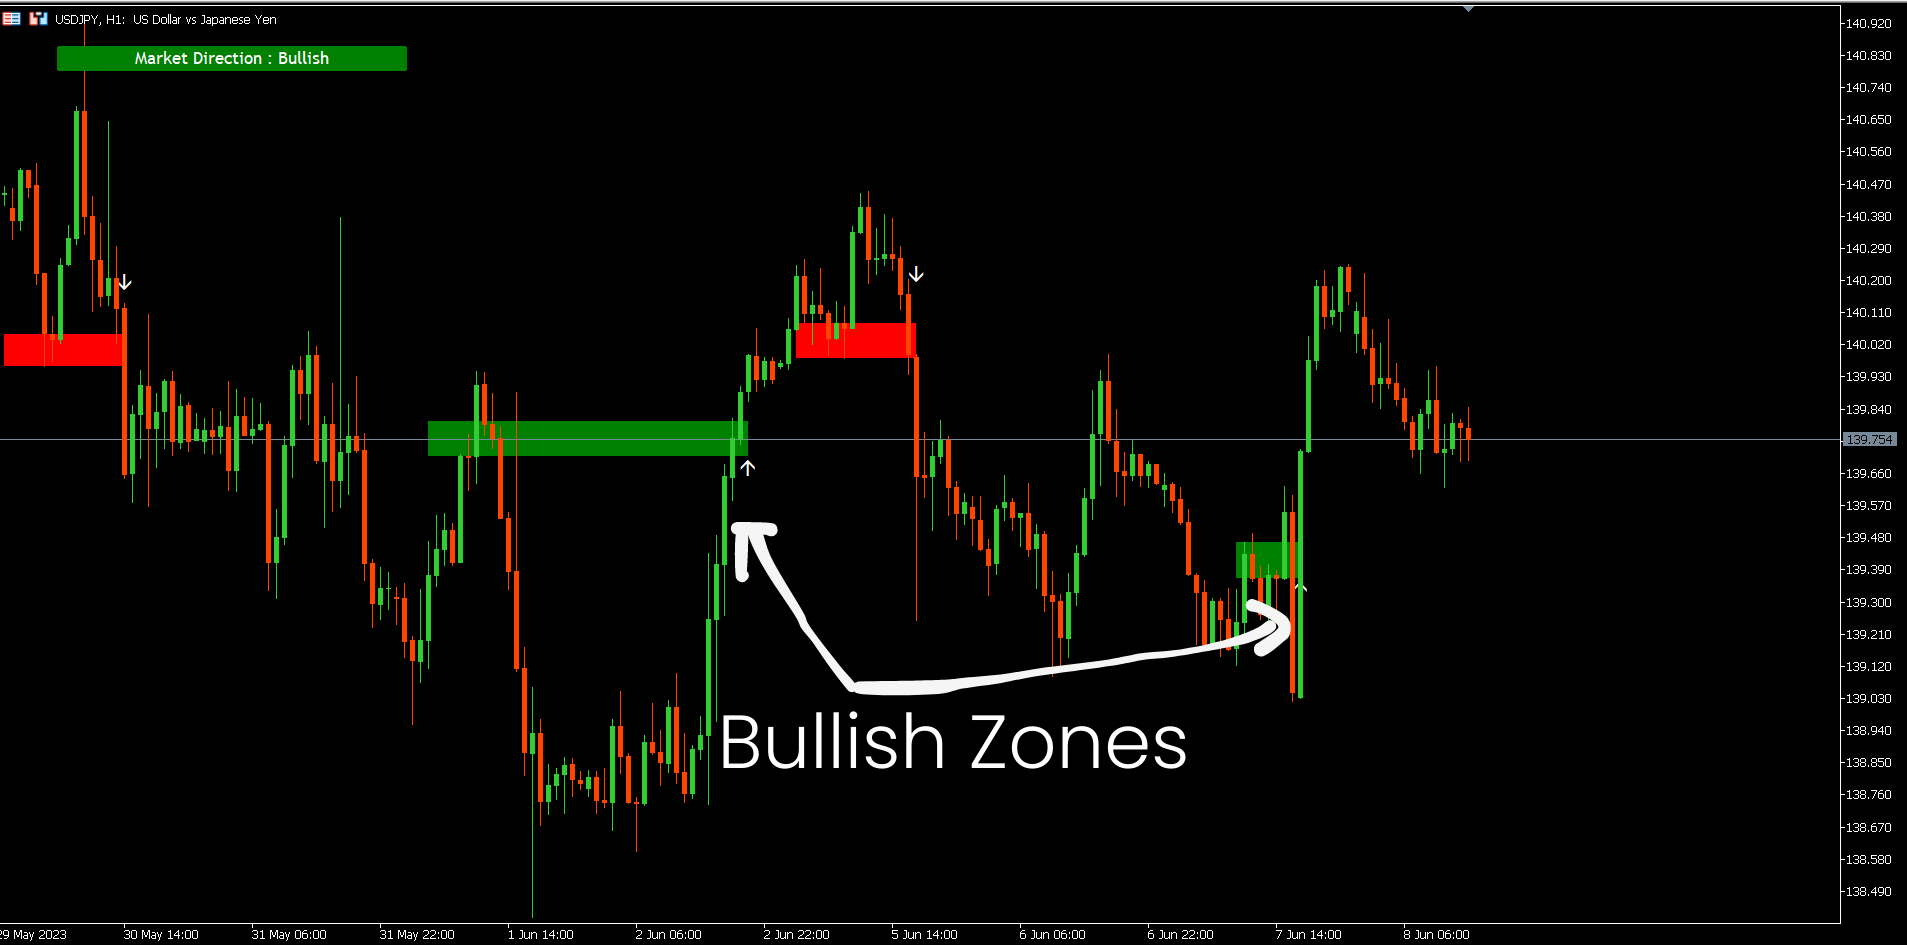
2. Zone de repli haussier.
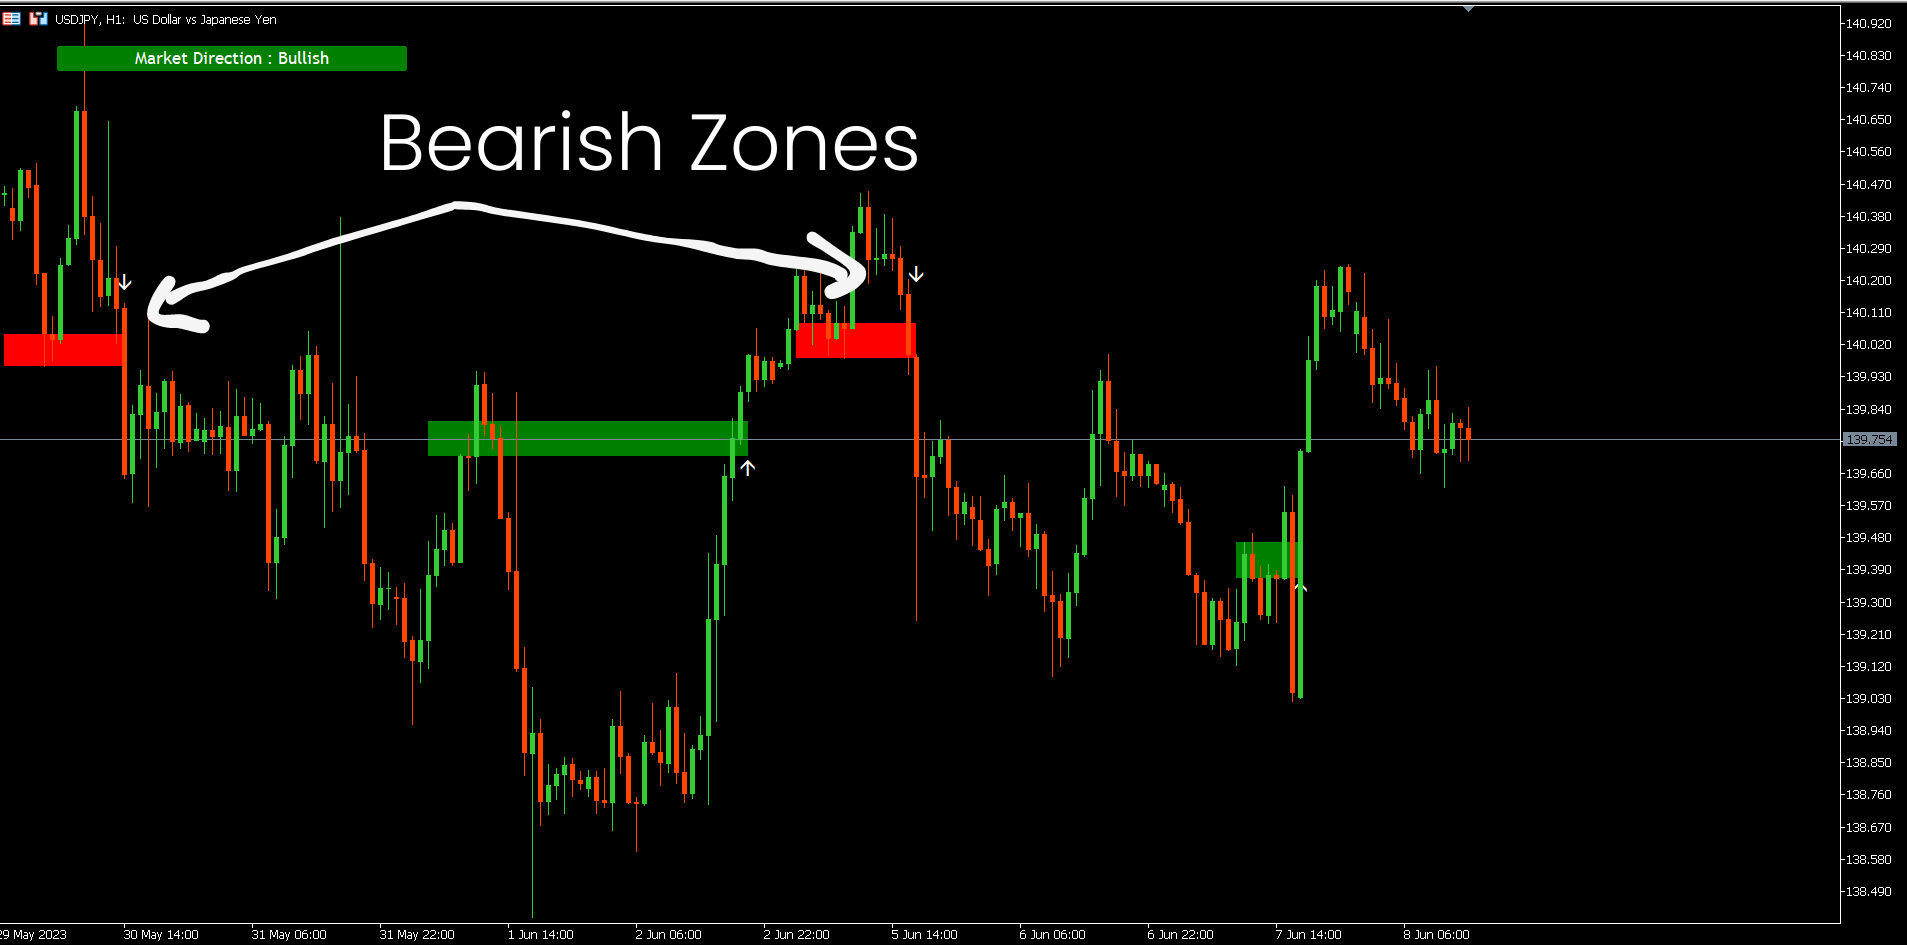
3. Zone de recul baissier.
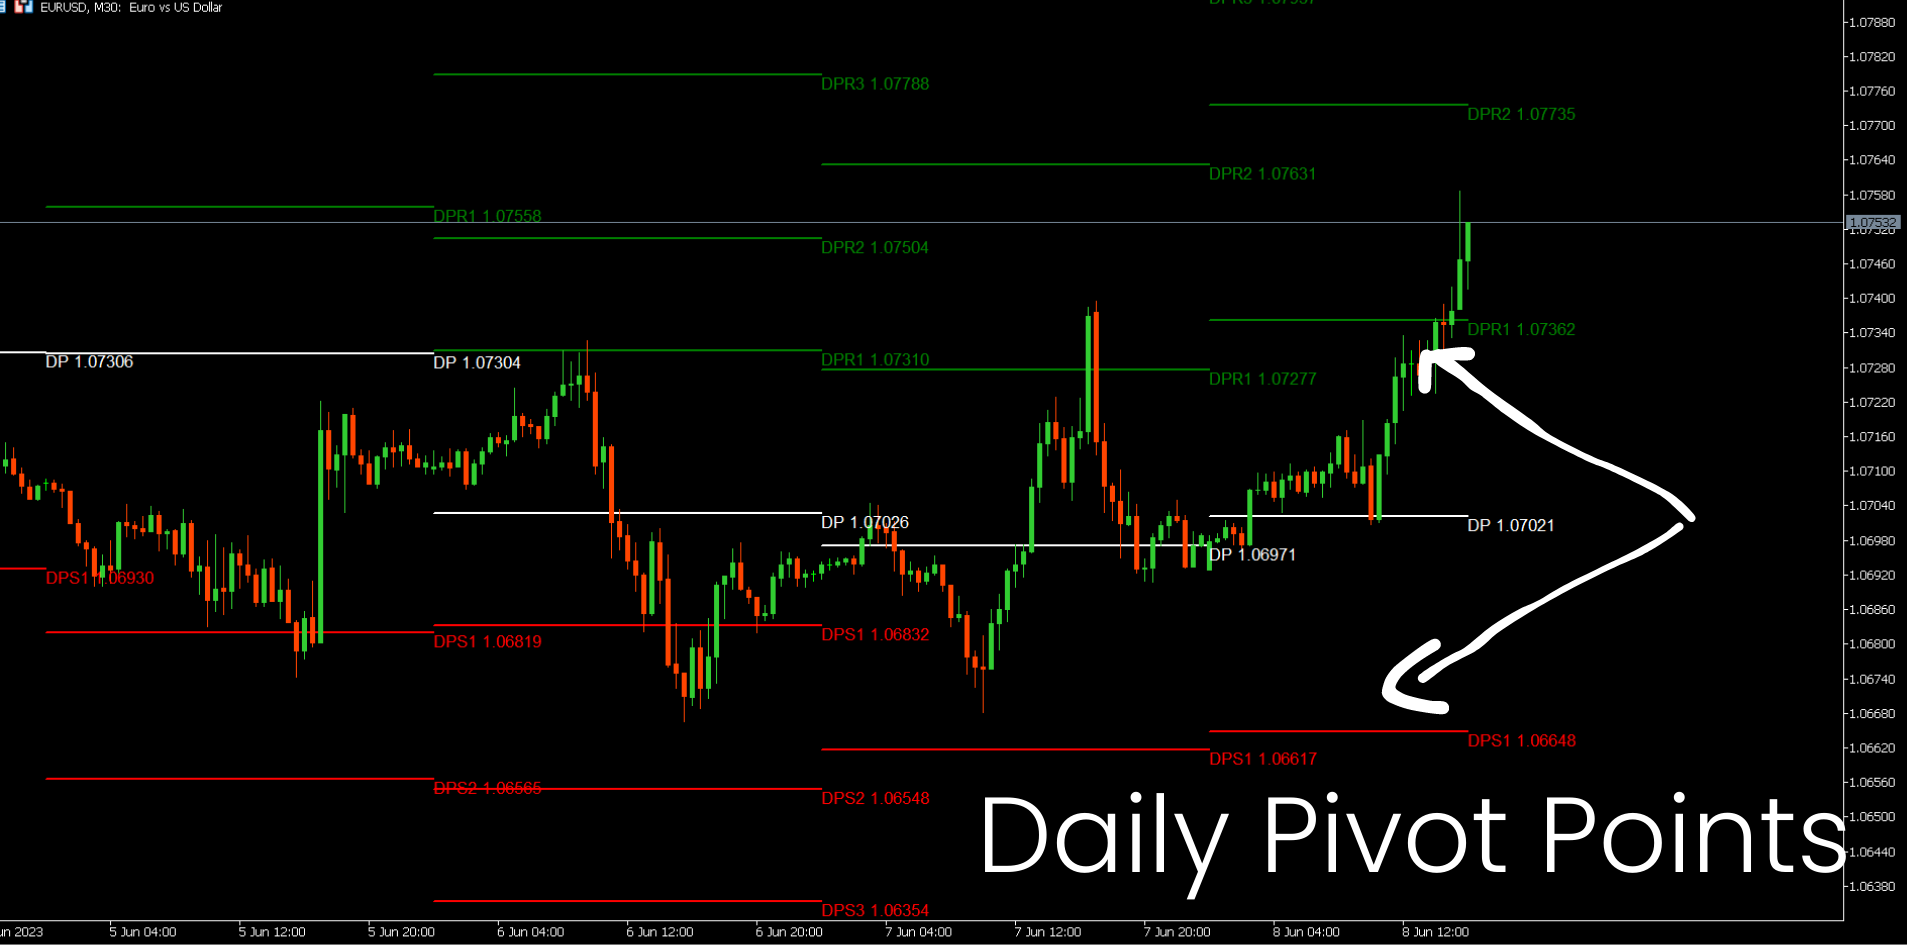
4. Points pivots quotidiens
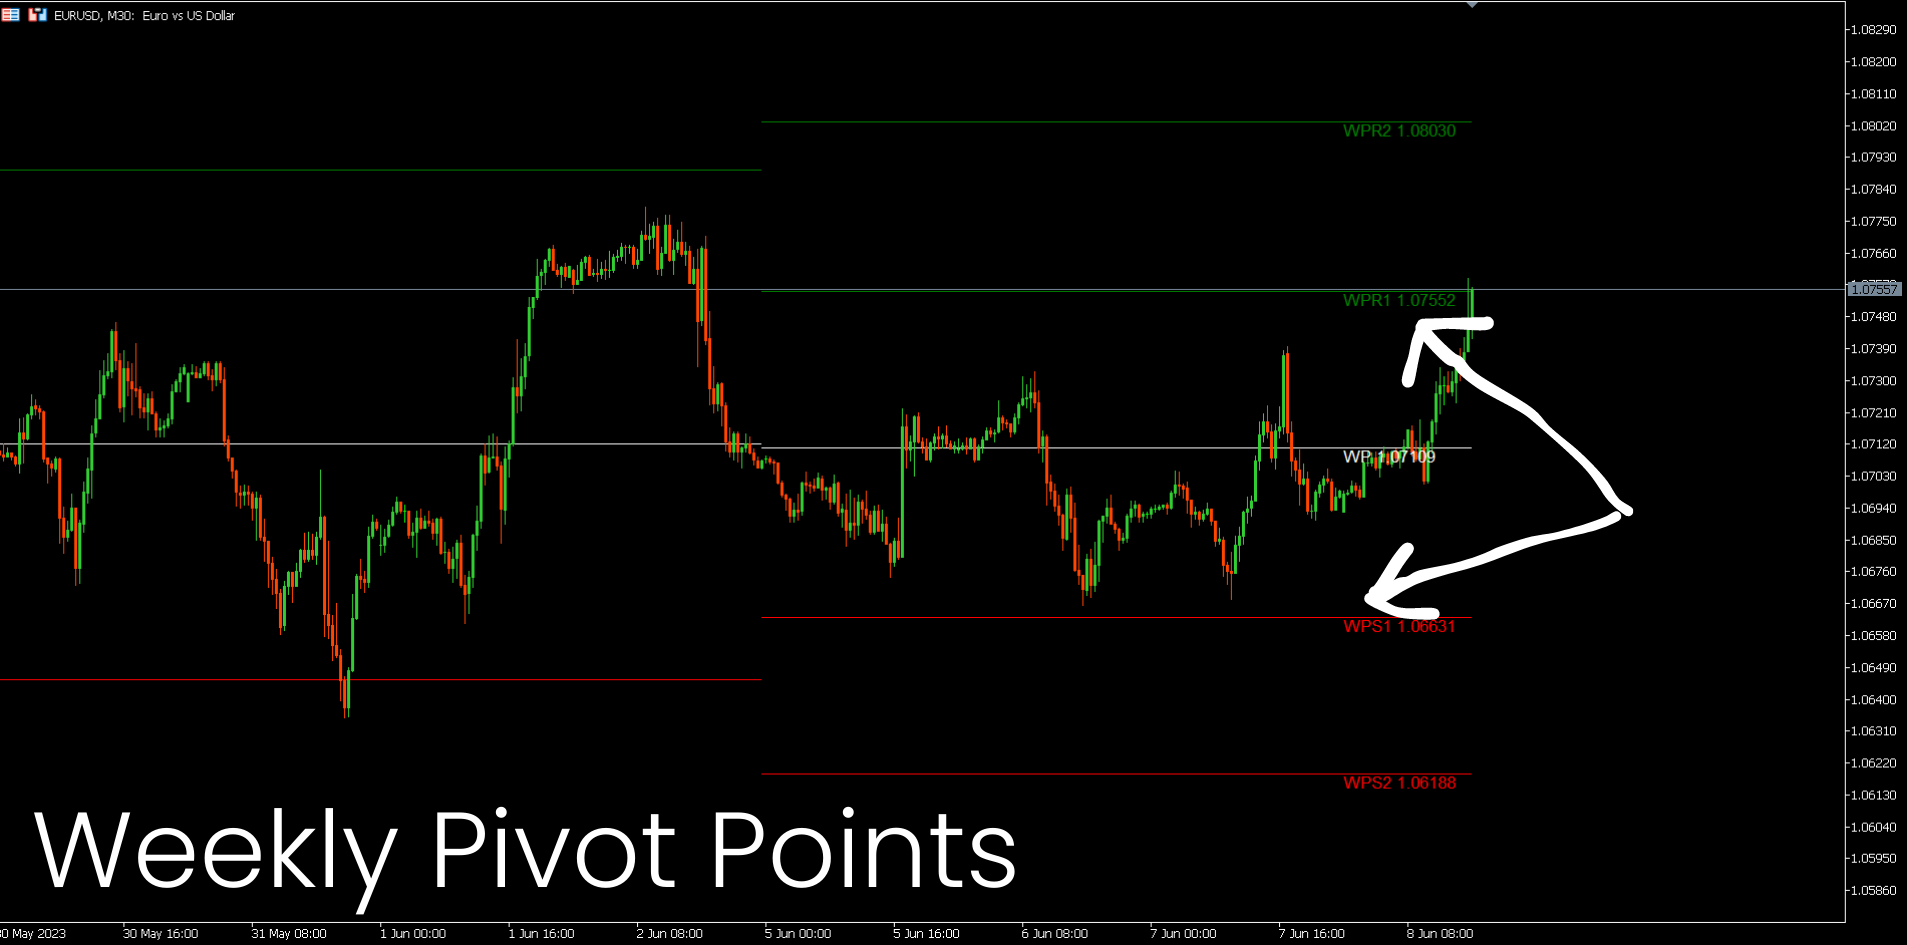
5. points pivots hebdomadaires
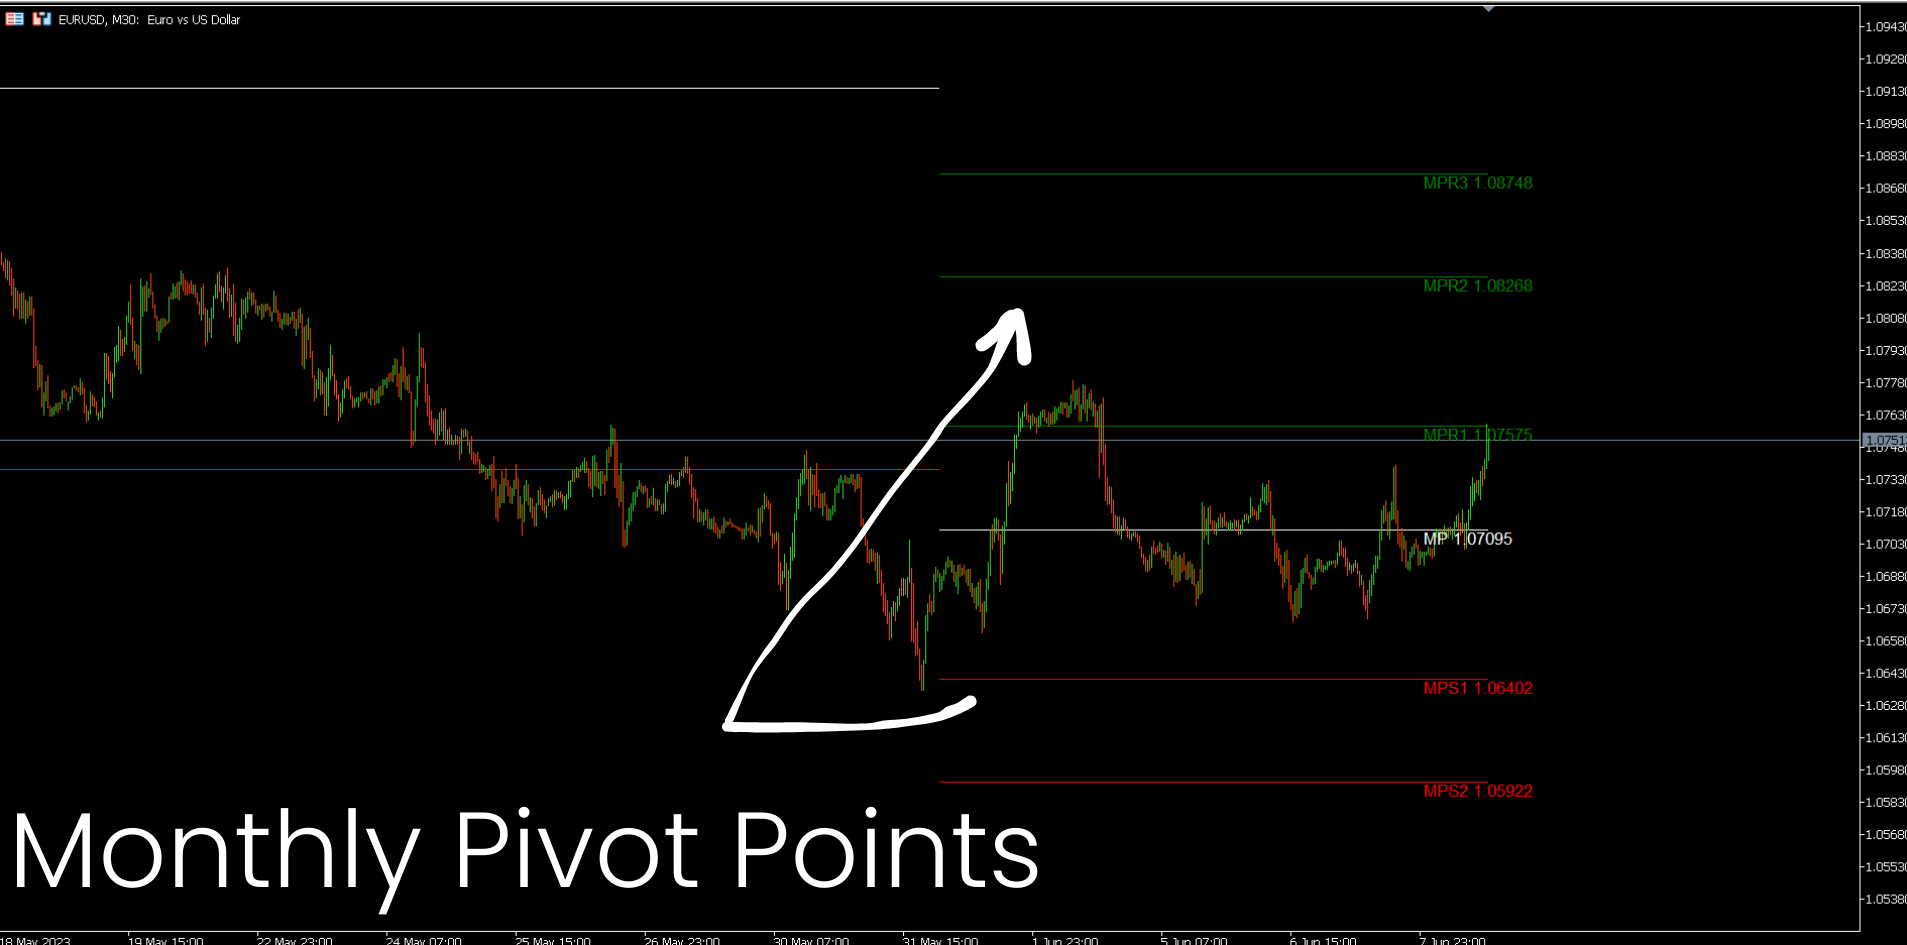
6. Points pivots mensuels
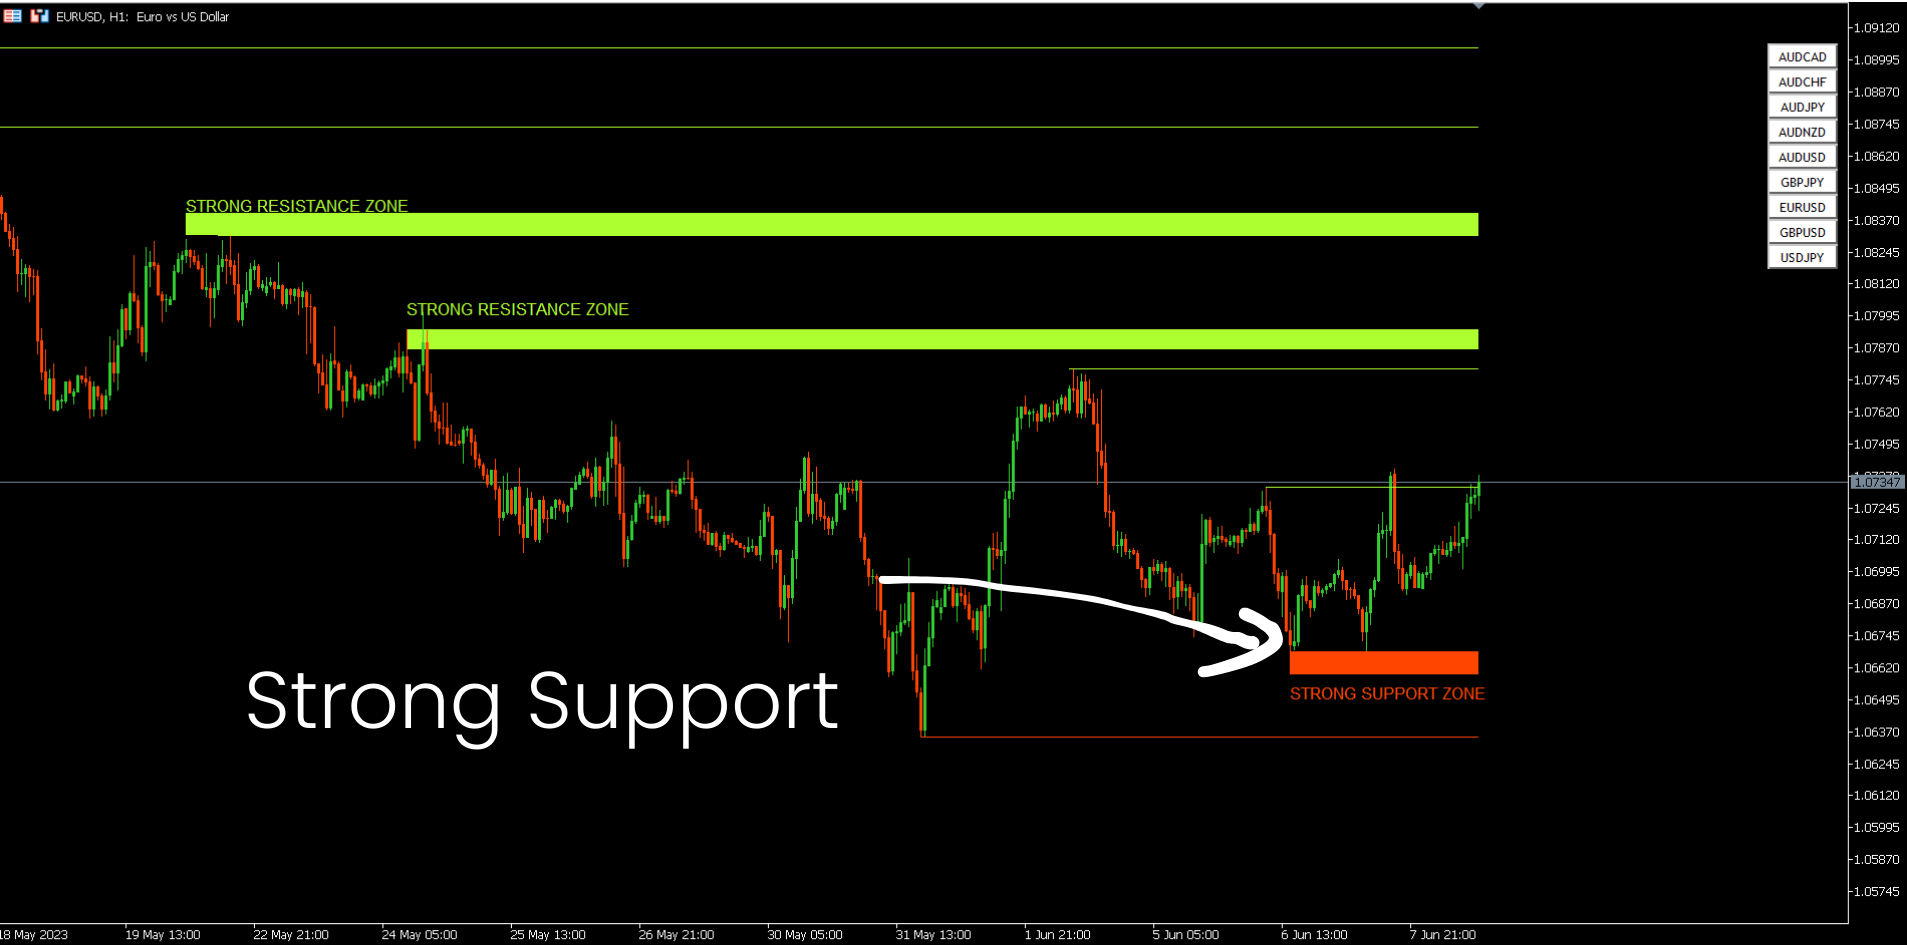
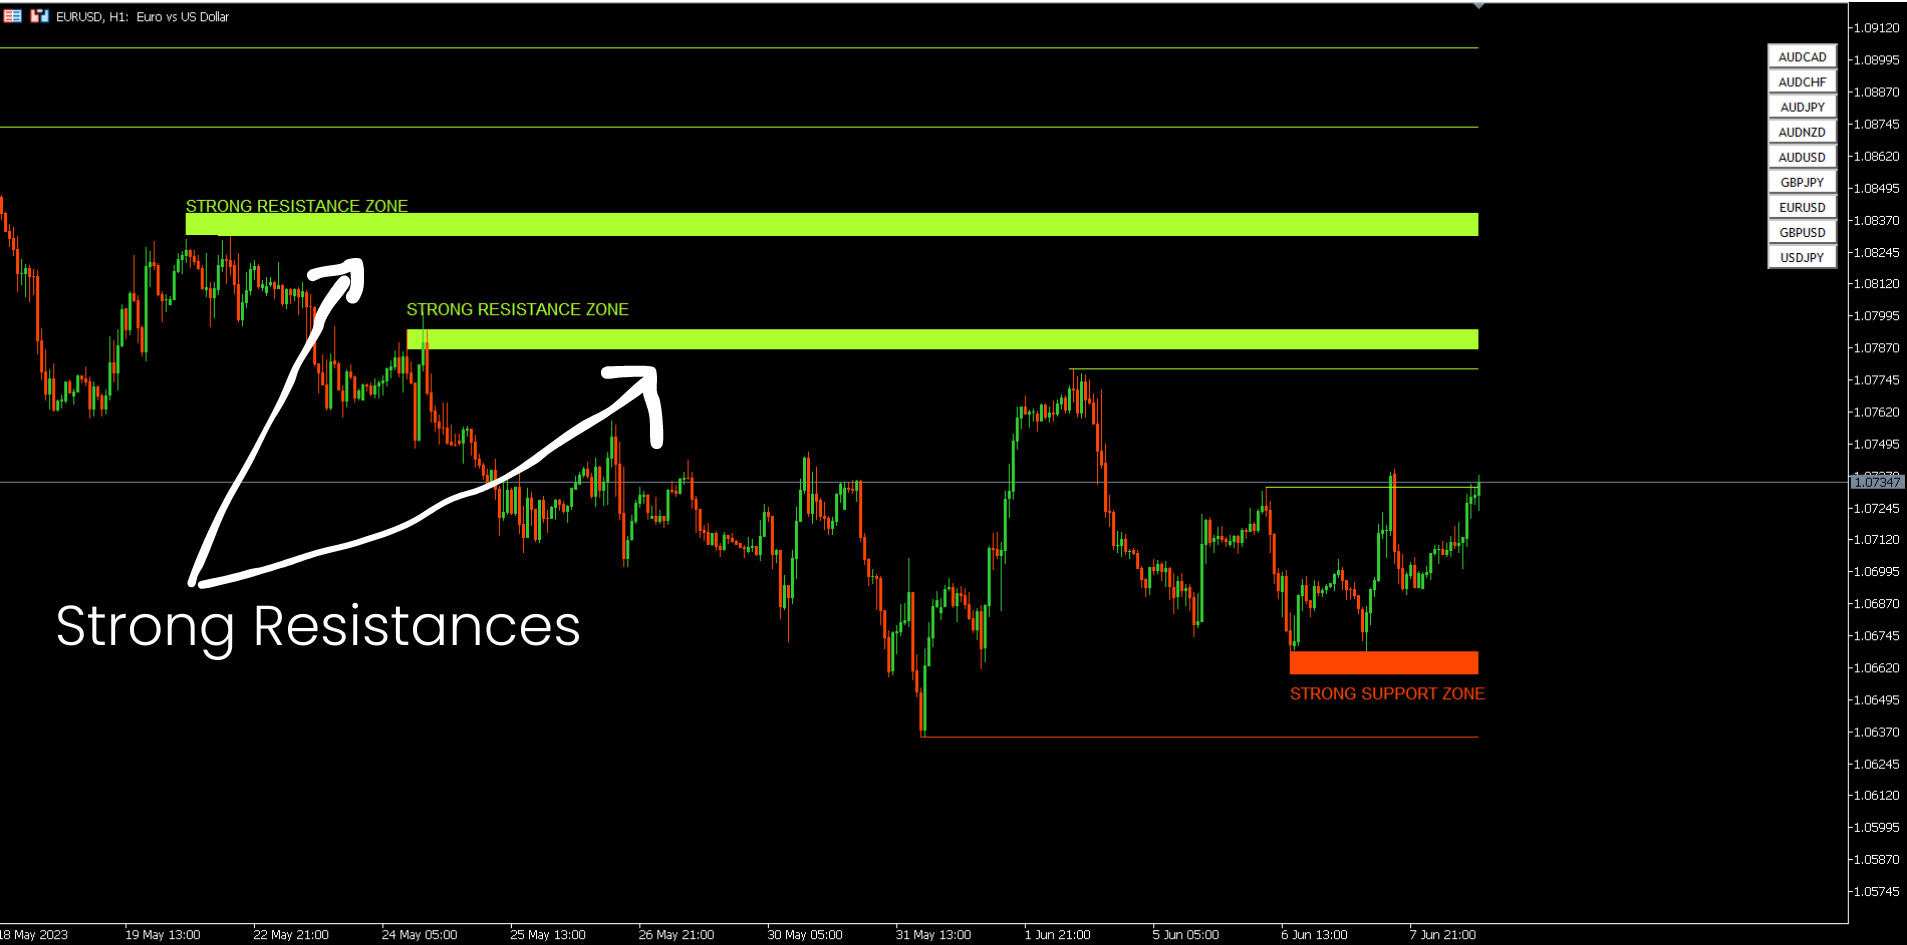
7. Support et résistance forts basés sur le modèle harmonique et le volume.
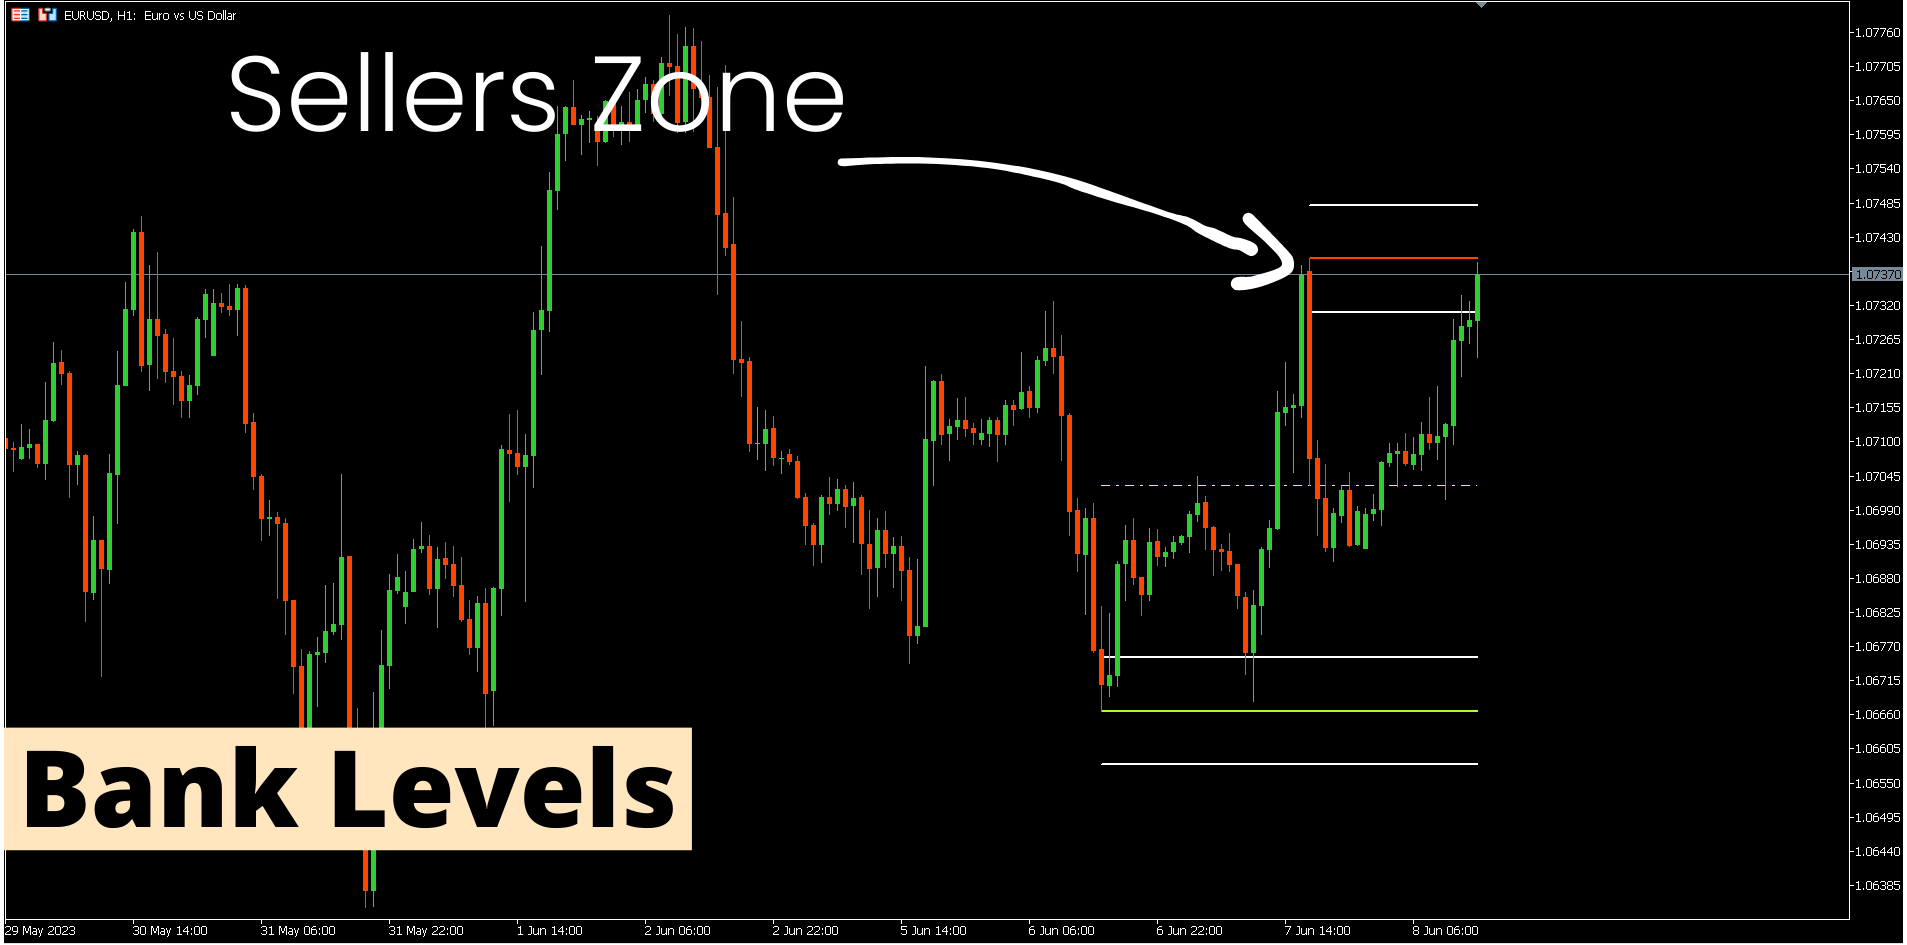
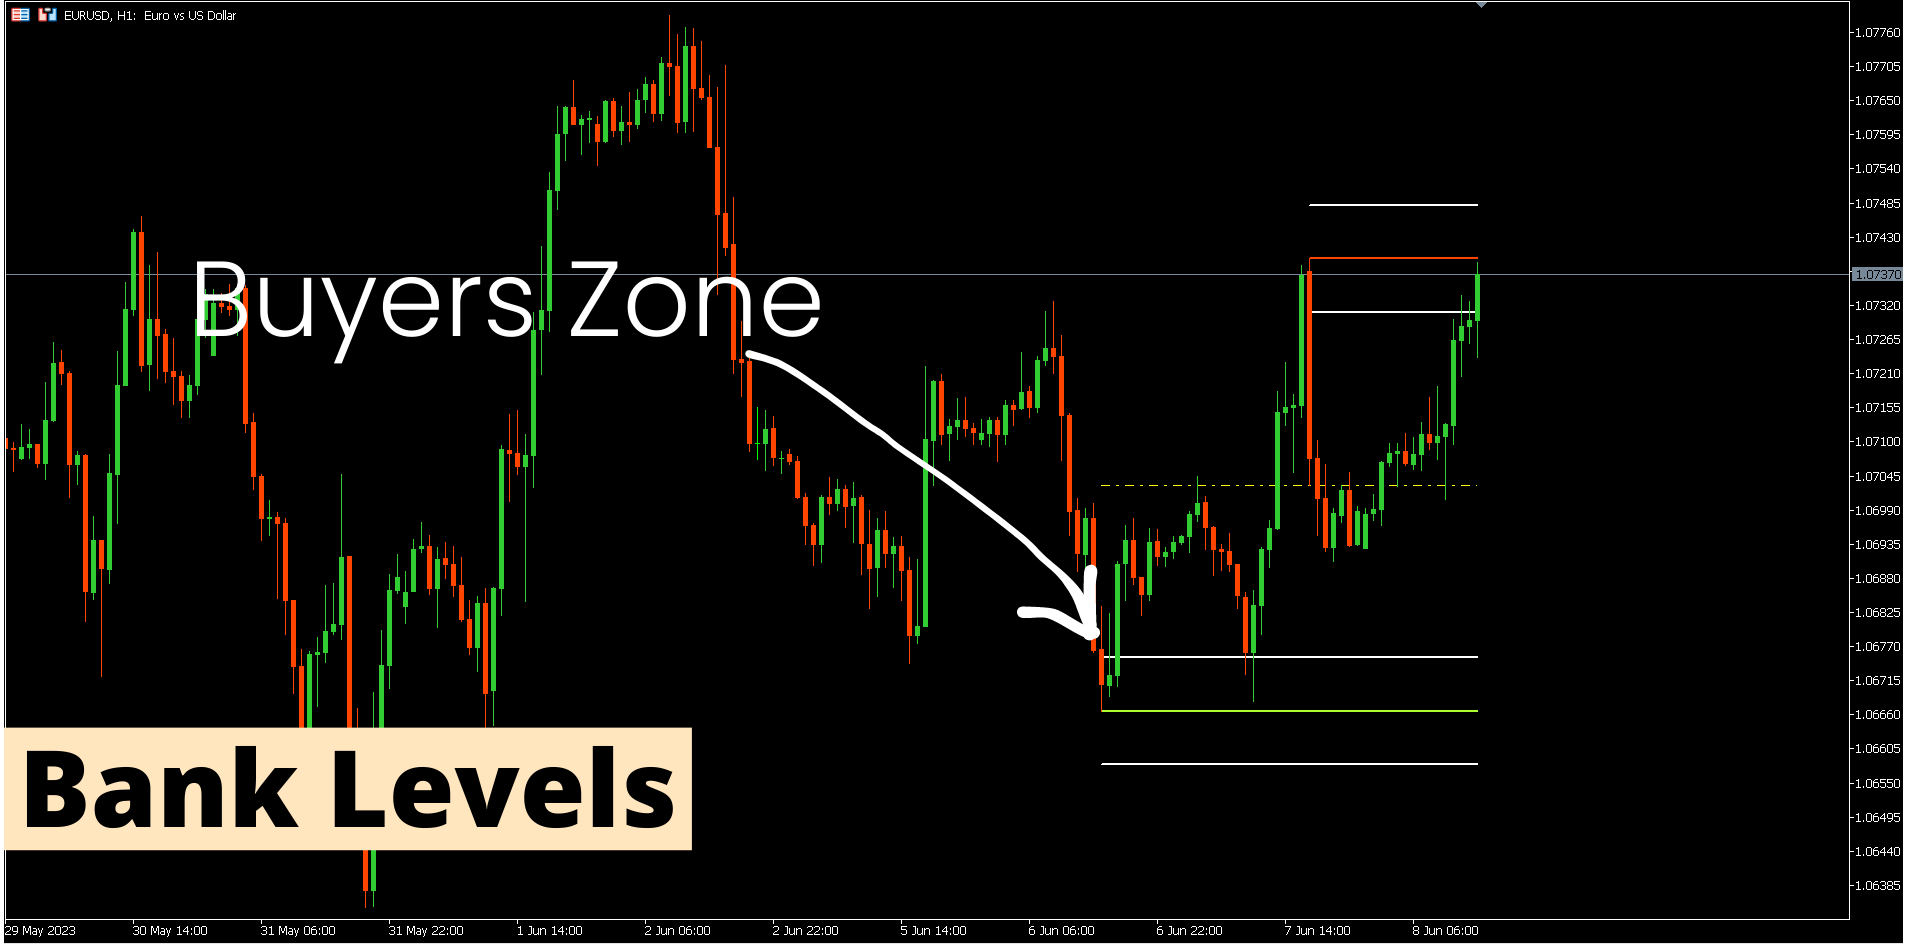
8. Zones au niveau de la banque.
OFFRE D'UNE DURÉE LIMITÉE : L'indicateur de support et de résistance HV est disponible pour seulement 50 $ et à vie. ( Prix d'origine 125$ )
Voulez-vous essayer l'indicateur sans la limitation Metatrader Backtester ? Cliquez ici pour télécharger la version démo.Principales caractéristiques
- Zones de support et de résistance fortes basées sur les algorithmes d'harmonique et de volume.
- Zones de retraits haussiers et baissiers basées sur des algorithmes harmoniques et de volume.
- Analyseur de structure de marché
- Points Pivots quotidiens, hebdomadaires et mensuels.
Documentation
Toutes les documentations de Support et Resistance Screener ( Instructions ) et les détails de la stratégie sont disponibles dans cet article de notre Blog MQL5 : Cliquez ici. Contact
Auteur
SAYADI ACHREF , ingénieur logiciel fintech et fondateur de Finansya 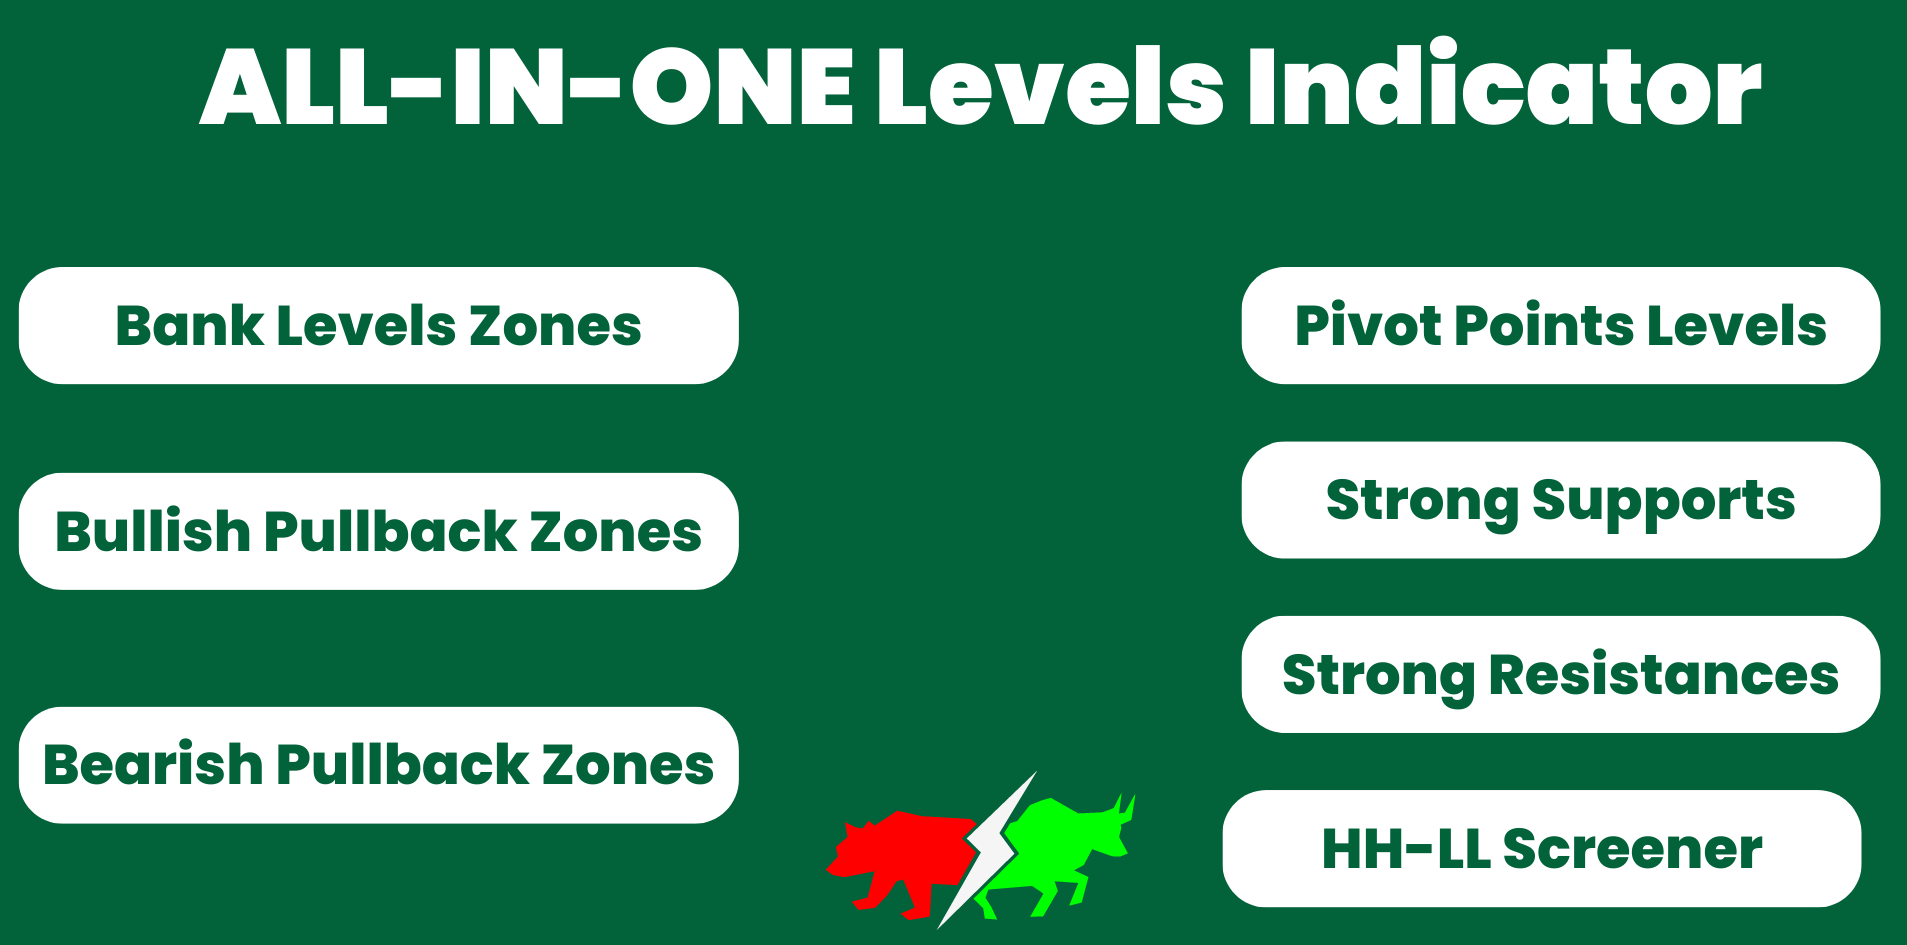


Excellent Service and Products.