• Aperçu
  • Avis (4)
  • Commentaires (12)
  • Nouveautés

Divergence DeMarker or any custom

3

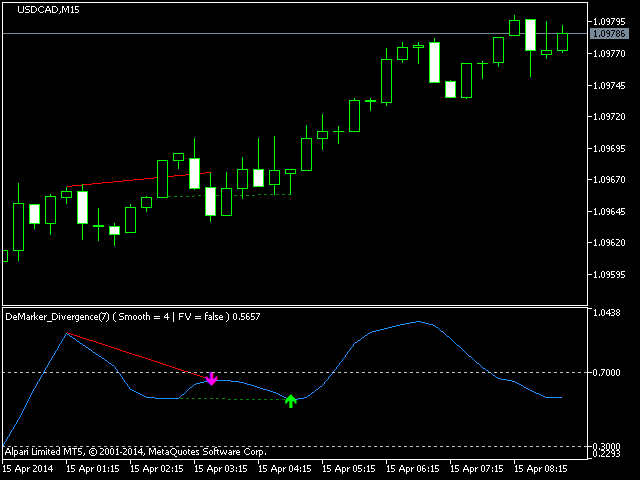
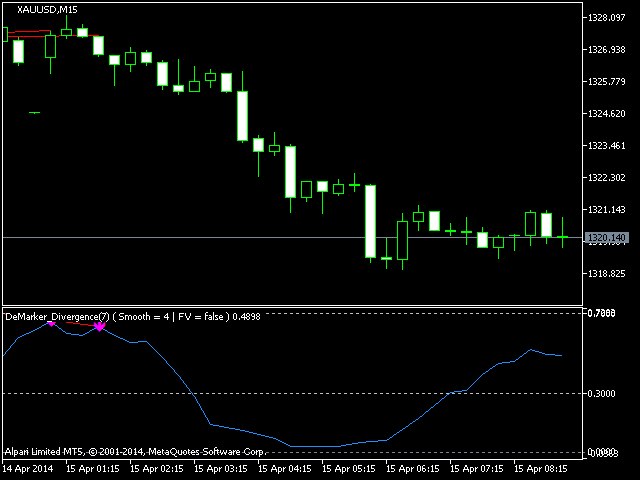
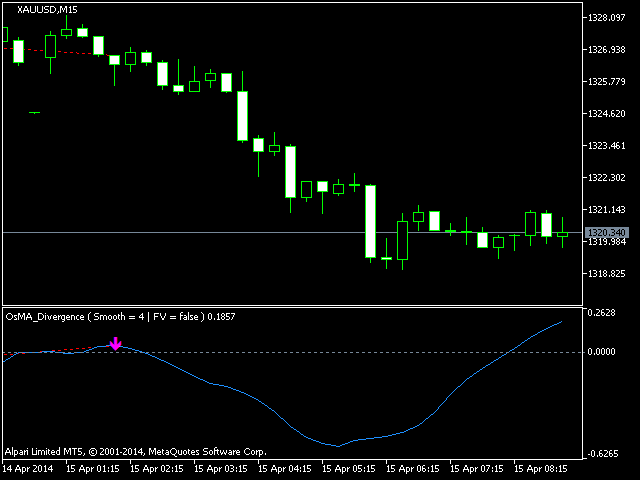
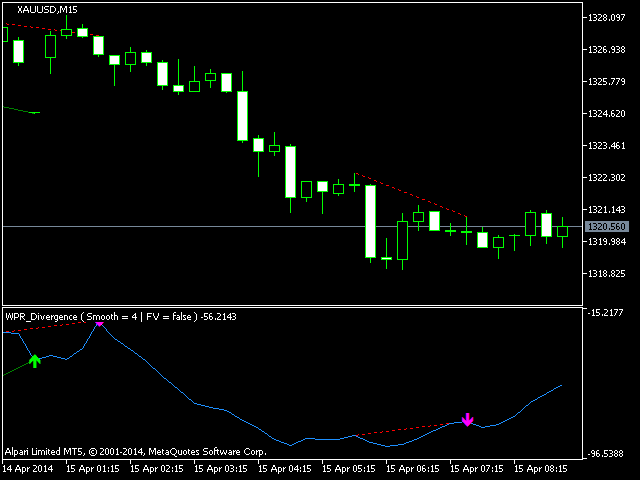
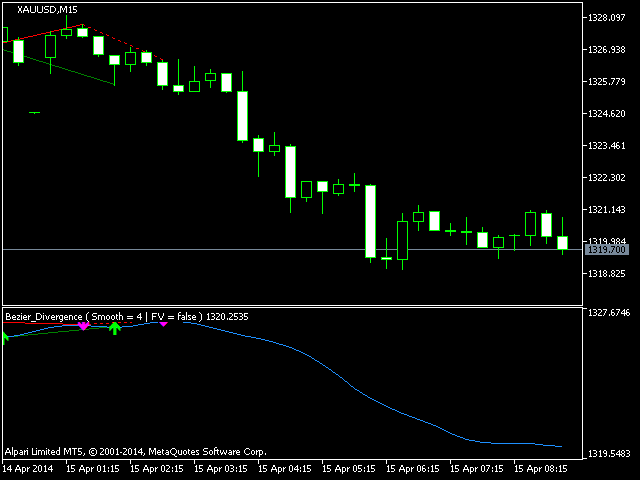
The indicator displays divergence for any custom indicator. You only need to specify the indicator name; DeMarker is used by default.

Additionally, you can opt for smoothing of values of the selected indicator and set levels whose crossing will trigger an alert. The custom indicator must be compiled (a file with ex5 extension) and located under MQL5/Indicators of the client terminal or in one of the subdirectories. It uses zero bar of the selected indicator with default parameters.


Input parameters

  • Indicator name - name of the indicator for which divergence will be calculated; DeMarker by default;
  • Period DeMarker - DeMarker averaging period; 7 by default;
  • Applied price - price used, Close price by default;
  • Smoothing method - smoothing method, Simple by default;
  • Smooth - smoothing period; 4 by default;
  • Level1 - level of the indicator; 0.3 by default;
  • Level2 - level of the indicator; 0.7 by default;
  • Bar for divergence calculated - number of the bar to calculate the divergence, 'second' by default;
  • Calculated bar - number of bars to display divergence, 300 by default;
  • Filter by volume - filter by volume; false by default. When enabled, no divergence signal will be given if the volume over the last 100 bars is less than average. There are three available modes: False, True and Auto. In the Auto mode, the filter is automatically enabled on M30 time frame and lower, and disabled on time frames higher than M30;
  • Display divergence alert - enables notifications about divergence, true by default;
  • Arrows displacement - offset for displaying the arrows, 0.0001 by default;
  • Display cross level alert - enables alert for the crossover of the set indicator levels; true by default;
  • Draw indicator trend lines - enables indicator trend lines in divergence; true by default;
  • Draw price trend lines - enables displaying the trend lines on the price chart during divergence, true by default;
  • Line bull divergence color - select a color for the trend line displayed during bullish divergence, Green by default;
  • Line bear divergence color - select a color for the trend line displayed during bearish divergence, Red by default.

I would also recommend the Angle DeMarker indicator that shows the angle of the DeMarker indicator line for a more accurate identification of the possible points of extremum.

Produits recommandés
This is a free version of the indicator, the period between the vertical lines is always 30 bars. In the paid version the period can be set by user, so a configuration with many ThreePointsChannel indicators with different periods is possible. The principle of construction - on top of any number of bars set by the user, a channel is constructed with maximum and minimum lines so that the bars touch the maximum and minimum of the channel at exactly three points. The name of the indicator follows
FREE
PZ Turtle Trading MT5
PZ TRADING SLU
4.43 (7)
The Turtle Trading Indicator implements the original Dennis Richards and Bill Eckhart trading system, commonly known as The Turtle Trader. This trend following system relies on breakouts of historical highs and lows to take and close trades: it is the complete opposite to the "buy low and sell high" approach. The main rule is "Trade an N-day breakout and take profits when an M-day high or low is breached (N must me above M)".  [ Installation Guide | Update Guide | Troubleshooting | FAQ | All Pr
FREE
Free automatic Fibonacci is an indicator that automatically plots a Fibonacci retracement based on the number of bars you select on the BarsToScan setting in the indicator. The Fibonacci is automatically updated in real time as new highest and lowest values appears amongst the selected bars. You can select which level values to be displayed in the indicator settings. You can also select the color of the levels thus enabling the trader to be able to attach the indicator several times with differe
FREE
This Mt5 Indicator Signals when there is two opposite direction bars engulfed by current bar.  has a recent Exponential Moving Average Cross and past bar was oversold/bought Expert Advisor Available in Comments  Free Version Here : https://www.mql5.com/en/market/product/110114?source=Site&nbsp ; Full Alerts for mt5 terminal , phone , email, print to file, print to journal  Buy Signal ( blue line ) Past ema cross ( set at 30 bars back ) Past bar rsi is oversold ( level 40  ) Engulfing bar closes
FREE
This indicator scans for you up to 15 trading instruments and up to 21 time frames for occurrences of the high probability reversal patterns: Double Tops/Bottoms with fake breakouts . What this indicator detects: This indicator detects a special form of Double Tops and Bottoms, so called Double Tops/Bottoms with fake breakouts . For double tops with fake breakouts the highest price of the right shoulder must be higher than the left shoulder. For double bottoms with fake breakouts the lowest pric
FREE
Dual RSI
Paul Conrad Carlson
Indicator alerts for Dual Relative strength index rsi. Large rsi preset at 14 is below 30 small rsi preset at 4 is below 10 for buy bullish signals . Large rsi preset are 14 is above 70 small rsi preset at 4 is above 90 for sell bearish signals . Includes mobile and terminal alerts. draws lines when alerts. This indicator can help identify extremes and then the tops or bottoms of those extremes .
FREE
Mitimom
Danil Poletavkin
The indicator is based on Robert Miner's methodology described in his book "High probability trading strategies" and displays signals along with momentum of 2 timeframes. A Stochastic oscillator is used as a momentum indicator. The settings speak for themselves period_1 is the current timeframe, 'current' period_2 is indicated - the senior timeframe is 4 or 5 times larger than the current one. For example, if the current one is 5 minutes, then the older one will be 20 minutes The rest of the
FREE
HighLow MT5
Azamat Mullayanov
4.2 (5)
The indicator plots two lines by High and Low prices. The lines comply with certain criteria. The blue line is for buy. The red one is for sell. The entry signal - the bar opens above\below the lines. The indicator works on all currency pairs and time frames It can be used either as a ready-made trading system or as an additional signal for a custom trading strategy. There are no input parameters. Like with any signal indicator, it is very difficult to use the product during flat movements. You
FREE
Follow The Line MT5
Oliver Gideon Amofa Appiah
4.42 (31)
This indicator obeys the popular maxim that: "THE TREND IS YOUR FRIEND" It paints a GREEN line for BUY and also paints a RED line for SELL. (you can change the colors). It gives alarms and alerts of all kinds. IT DOES NOT REPAINT and can be used for all currency pairs and timeframes. Yes, as easy and simple as that. Even a newbie can use it to make great and reliable trades. NB: For best results, get my other premium indicators for more powerful and reliable signals. Get them here: https://www.m
FREE
PZ Three Drives MT5
PZ TRADING SLU
3.11 (9)
This indicator finds Three Drives patterns. The Three Drives pattern is a 6-point reversal pattern characterised by a series of higher highs or lower lows that complete at a 127% or 161.8% Fibonacci extension. It signals that the market is exhausted and a reversal can happen. [ Installation Guide | Update Guide | Troubleshooting | FAQ | All Products ] Customizable pattern sizes Customizable colors and sizes Customizable breakout periods Customizable 1-2-3 and 0-A-B ratios It implements visua
FREE
The indicator identifies when a divergence occurs between price and an indicator or oscillator. It identifies both regular and hidden divergences. Combined with your own rules and techniques, this indicator will allow you to create (or enhance) your own powerful system. Features Can detect divergences for the following oscillators/indicators:   MACD, OsMA, Stochastics, RSI, CCI, RVI, Awesome, ADX, ATR, OBV, Composite index, MFI and Momentum. Only one oscillator/indicator can be selected. Draws
FREE
Multi-timeframe trend indicator based on the ADX / ADXWilder indicator with Fibonacci levels The indicator shows trend areas using ADX or ADXWilder indicator data from multiple timeframes. The impulse mode of the indicator allows you to catch the beginning of a trend, and several "Screens" with different timeframes allow you to filter out market noise. Fibonacci levels are added to the price chart, which have flexible settings. How the indicator works: if PDI is greater than NDI, then   it`
FREE
This indicator is based on the Parabolic SAR indicator. It helps the user identifying whether to buy or sell. It comes with an alert that will sound whenever a new signal appears. It also features an email facility. Your email address and SMTP Server settings should be specified in the settings window of the "Mailbox" tab in your MetaTrader 5. Blue arrow up = Buy. Red arrow down = Sell. Line = Trailing Stop. You can use one of my Trailing Stop products that automatically move the Stop Loss and i
FREE
PZ The Zone MT5
PZ TRADING SLU
5 (1)
This indicator displays buy or sell signals according to Bill Williams' definition of the Trading Zone. [ Installation Guide | Update Guide | Troubleshooting | FAQ | All Products ] Easy to use and understand Avoid trading flat markets Deterministic indicator with clear rules The indicator is non-repainting It implements alerts of all kinds It has straightforward trading implications. A blue arrow is a buy signal A red arrow is a sell signal According to Bill Williams trading in the zone helps t
FREE
PZ Penta O MT5
PZ TRADING SLU
4 (6)
The Penta-O is a 6-point retracement harmonacci pattern which usually precedes big market movements. Penta-O patterns can expand and repaint quite a bit. To make things easier this indicator implements a twist: it waits for a donchian breakout in the right direction before signaling the trade. The end result is an otherwise repainting indicator with a very reliable trading signal. The donchian breakout period is entered as an input. [ Installation Guide | Update Guide | Troubleshooting | FAQ | A
FREE
Dual Onset MT5
Dariel Iserne Carrera
4.8 (5)
This is the MT5 version. Get Dual Onset MT4 here   It is an algorithm to detect trend changes early. You should try multiple values for the Multiplier parameter (1 <value <10 recommended). At first glance you can see effective entries. This is, in fact, one of the rows that Geleg Faktor initially had. But it was removed because it was no longer needed. The other rows were sufficient for G.Faktor's effectiveness, but I still wanted to share this one. Always test before using it on your live
FREE
Reversal Composite Candles
MetaQuotes Ltd.
3.43 (23)
The idea of the system is to indentify the reversal patterns using the calculation of the composite candle. The reversal patterns is similar to the "Hammer" and "Hanging Man" patterns in Japanese candlestick analysis. But it uses the composite candle instead the single candle and doesn't need the small body of the composite candle to confirm the reversal. Input parameters: Range - maximal number of bars, used in the calculation of the composite candle. Minimum - minimal size of the composite can
FREE
RSI divergence indicator finds divergences between price chart and   RSI   indicator and informs you with alerts (popup, mobile notification or email). Its main use is to find trend reversals in the chart. Always use the divergence indicators with other technical assets like support resistance zones, candlestick patterns and price action to have a higher possibility to find trend reversals. Three confirmation type for   RSI   divergences: RSI   line cross 50 level Price returns to previous H/L C
FREE
Virtual Targets MT5
Hoang Van Dien
4.71 (7)
This indicator is very useful for day traders or short term traders. (MT5 version) No need to calculate the number of pips manually, just look at the chart and you will see the Virtual Take Profit / Virtual Stop Loss target line and evaluate whether the entry point is feasible to reach the intended target or not. Enter the intended   Take Profit / Stop Loss   pips for your trade. The indicator will display   Virtual Take Profit / Virtual Stop Loss   lines for you to easily see if the target i
FREE
Are you tired of drawing trendlines every time you're analyzing charts? Or perhaps you would like more consistency in your technical analysis. Then this is for you. This indicator will draw trend lines automatically when dropped on a chart. How it works Works similar to standard deviation channel found on mt4 and mt5. It has 2 parameters: 1. Starting Bar 2. Number of bars for calculation The   starting bar   is the bar which drawing of the trend lines will begin, while the   number of bars for c
FREE
PZ Trendlines MT5
PZ TRADING SLU
4.8 (5)
Tired of plotting trendlines? The PZ TrendLines MT5 indicator applies a mechanical approach to the construction of trend lines for you!  [ Installation Guide | Update Guide | Troubleshooting | FAQ | All Products ] It can draw up to 18 trendlines Trendlines can be optionally based on fractals Each line represents a breakout level Each trendline can be broken or rejected Configurable amount of lines Configurable colors Support I am happy to provide free products but given my limited time, they com
FREE
Forex Indicator Arrows
NGUYEN NGHIEM DUY
1 (1)
Forex Indicator Arrows is an arrow Indicator used as an assistant tool for your trading strategy. The indicator analyzes the standard deviation of bar close for a given period and generates a buy or sell signals if the deviation increases. It good to combo with Martingale EA to follow Trend and Sellect Buy Only/Sell Only for EA work Semi-Automatic. You can use this  Indicator with any EAs in my Products.
FREE
This indicator is a zero-lag indicator and displays  strength of trend change . True Trend  Oscillator Pro works best in combination with True Trend Moving Average Pro that displays exact trend as is. Oscillator value is exact price change in given direction of the trend. True Trend Moving Average Pro: https://www.mql5.com/en/market/product/103586 If you set PERIOD input parameter to 1 this indicator becomes a sharpshooter for binary options. Developers can use True Trend Oscillator in E
FREE
Curver Arrows
Francis Dube
4 (9)
This indicator is a straight port of a well known MetaTrader 4 indicator that is freely available on the Internet. It does not redraw at all. It implements a type of breakout strategy. The arrows indicate market direction. Use the indicator on M15 charts and higher. The indicator draws two bands near price action and generates signals when the price closes below the lower band and also above the upper band. The indicator uses periodic highs and lows to calculate upper and lower threshold bands.
FREE
This indicator is based on the Moving Average indicator. It helps the user identifying whether to buy or sell. It comes with an alert that will sound whenever a new signal appears. It also features an email facility. Your email address and SMTP Server settings should be specified in the settings window of the "Mailbox" tab in your MetaTrader 5. Blue arrow up = Buy. Red arrow down = Sell. Line = Trailing Stop. You can use one of my Trailing Stop products that automatically move the Stop Loss and
FREE
PZ HHHc LLLc MT5
PZ TRADING SLU
5 (2)
A personal implementation of a famous trend principle known as higher high, higher close, lower low, lower close (HHHC - HHHL). It uses price action alone to determine trend direction, trend changes and pullback zones.  [ Installation Guide | Update Guide | Troubleshooting | FAQ | All Products ] Customizable breakout period Customizable colors and sizes It is non-repainting and non-backpainting It implements alerts of all kinds The indicator defines three price zones: Buy zones are blue Sell zon
FREE
KeltnerChannelIndicatorMT5
Todd Terence Bates
3 (2)
The Keltner Channel is a volatility-based technical indicator composed of three separate lines. The middle line is an exponential moving average (EMA) of the price. Additional lines are placed above and below the EMA. The upper band is typically set two times the Average True Range (ATR) above the EMA, and the lower band is typically set two times the ATR below the EMA. The bands expand and contract as volatility (measured by ATR) expands and contracts. Since most price action will be encompasse
FREE
Peak Trough Analysis is the great tool to detect peaks and troughs in your chart. Peak Trough Analysis tool can use three different peaks and troughs detection algorithm. The three algorithm include the orignal Fractals Indicator by Bill Williams, the Modified Fractals indicator and ZigZag indicator. You can use this peak and trough analysis tool to detect the price pattern made up from Equilibrium Fractal-Wave process. For further usage, there are good guide line on how to use this peak trough
FREE
Important Lines
Terence Gronowski
4.88 (26)
This indicator displays Pivot-Lines, preday high and low, preday close and the minimum and maximum of the previous hour. You just have to put this single indicator to the chart to have all these important lines, no need to setup many single indicators. Why certain lines are important Preday high and low : These are watched by traders who trade in a daily chart. Very often, if price climbs over or falls under a preday low/high there is an acceleration in buying/selling. It is a breakout out of
FREE
This indicator is based on the Fractals indicator. It helps the user identifying whether to buy or sell. It comes with an alert that will sound whenever a new signal appears. It also features an email facility. Your email address and SMTP Server settings should be specified in the settings window of the "Mailbox" tab in your MetaTrader 5. Blue arrow up = Buy. Red arrow down = Sell. Line = Trailing Stop. You can use one of my Trailing Stop products that automatically move the Stop Loss and includ
FREE
Les acheteurs de ce produit ont également acheté
Atomic Analyst MT5
Issam Kassas
3.64 (11)
Tout d'abord, il convient de souligner que cet indicateur de trading n'est ni repainting, ni redrawing et ne présente aucun délai, ce qui le rend idéal à la fois pour le trading manuel et automatisé. L'Analyste Atomique est un indicateur d'action sur les prix PA qui utilise la force et le momentum du prix pour trouver un meilleur avantage sur le marché. Équipé de filtres avancés qui aident à éliminer les bruits et les faux signaux, et à augmenter le potentiel de trading. En utilisant plusieur
Tout d'abord, il convient de souligner que ce système de trading est un indicateur non repeint, non redessiné et non retardé, ce qui le rend idéal pour le trading manuel et automatisé. Le "Système de Trading Smart Trend MT5" est une solution de trading complète conçue pour les traders débutants et expérimentés. Il combine plus de 10 indicateurs premium et propose plus de 7 stratégies de trading robustes, ce qui en fait un choix polyvalent pour différentes conditions de marché. Stratégie de suivi
Quantum Trend Sniper
Bogdan Ion Puscasu
5 (37)
Présentation       Quantum Trend Sniper Indicator   , l'indicateur révolutionnaire MQL5 qui transforme la façon dont vous identifiez et négociez les inversions de tendance ! Développé par une équipe de traders expérimentés avec une expérience commerciale de plus de 13 ans,       Indicateur Quantum Trend Sniper       est conçu pour propulser votre parcours de trading vers de nouveaux sommets grâce à sa manière innovante d'identifier les inversions de tendance avec une précision extrêmement élevée
Trend Screener Pro MT5
STE S.S.COMPANY
4.89 (61)
Indicateur de tendance, solution unique révolutionnaire pour le trading et le filtrage des tendances avec toutes les fonctionnalités de tendance importantes intégrées dans un seul outil ! Il s'agit d'un indicateur multi-période et multi-devises 100 % non repeint qui peut être utilisé sur tous les symboles/instruments : forex, matières premières, crypto-monnaies, indices et actions. Trend Screener est un indicateur de suivi de tendance efficace qui fournit des signaux de tendance fléchés avec des
Gold Stuff mt5
Vasiliy Strukov
4.88 (164)
Gold Stuff mt5 est un indicateur de tendance conçu spécifiquement pour l'or et peut également être utilisé sur n'importe quel instrument financier. L'indicateur ne se redessine pas et ne traîne pas. Délai recommandé H1. Contactez-moi immédiatement après l'achat pour obtenir les réglages et un bonus personnel !   RÉGLAGES Dessiner la flèche - on off. dessiner des flèches sur le graphique. Alertes - activation et désactivation des alertes sonores. Notification par e-mail - activé désactivé.
FX Volume MT5
Daniel Stein
4.94 (17)
Obtenez votre mise à jour quotidienne du marché avec des détails et des captures d'écran via notre Morning Briefing ici sur mql5 et sur Telegram ! FX Volume est le PREMIER et SEUL indicateur de volume qui fournit un VRAI aperçu du sentiment du marché du point de vue d'un courtier. Il fournit des informations impressionnantes sur la façon dont les acteurs institutionnels du marché, comme les courtiers, sont positionnés sur le marché des changes, bien plus rapidement que les rapports COT. Voir c
FX Power MT5 NG
Daniel Stein
5 (4)
Obtenez votre mise à jour quotidienne du marché avec des détails et des captures d'écran via notre Morning Briefing ici sur mql5 et sur Telegram ! FX Power MT5 NG est la nouvelle génération de notre très populaire indicateur de force des devises, FX Power. Et qu'est-ce que ce compteur de force de nouvelle génération offre ? Tout ce que vous avez aimé de l'original FX Power PLUS Analyse de la force de l'OR/XAU Des résultats de calcul encore plus précis Périodes d'analyse configurables individuel
Tout d'abord, il convient de souligner que cet outil de trading est un indicateur non repeint, non redessiné et non retardé, ce qui le rend idéal pour le trading professionnel. L'indicateur Smart Price Action Concepts est un outil très puissant à la fois pour les nouveaux et les traders expérimentés. Il regroupe plus de 20 indicateurs utiles en un seul, combinant des idées de trading avancées telles que l'analyse du trader Inner Circle et les stratégies de trading Smart Money Concepts. Cet in
Advanced Supply Demand MT5
Bernhard Schweigert
4.53 (15)
La meilleure solution pour tout commerçant débutant ou expert ! Cet indicateur est un outil de trading unique, de haute qualité et abordable car nous avons intégré un certain nombre de fonctionnalités propriétaires et une nouvelle formule. Avec cette mise à jour, vous pourrez afficher des zones à double horaire. Vous pourrez non seulement afficher un TF plus élevé, mais afficher les deux, le graphique TF, PLUS le TF supérieur : AFFICHAGE DES ZONES NICHÉES. Tous les traders Supply Demand vont ado
RelicusRoad Pro MT5
Relicus LLC
4.81 (21)
Maintenant 147 $ (augmentant à 499 $ après quelques mises à jour) - Comptes illimités (PCS ou Mac) Manuel d'utilisation RelicusRoad + Vidéos de formation + Accès au groupe Discord privé + Statut VIP UNE NOUVELLE FAÇON DE REGARDER LE MARCHÉ RelicusRoad est l'indicateur de trading le plus puissant au monde pour le forex, les contrats à terme, les crypto-monnaies, les actions et les indices, offrant aux traders toutes les informations et tous les outils dont ils ont besoin pour rester renta
XQ Indicator MetaTrader 5
Marzena Maria Szmit
5 (1)
Step into the realm of Forex trading with confidence and precision using XQ, a cutting-edge Forex indicator designed to elevate your trading game to unprecedented heights. Whether you're a seasoned trader or just stepping into the world of currency exchange, XQ Forex Indicator empowers you with the insights and signals needed to make informed trading decisions. The signal conditions are a combination of three indicators, and XQ Forex Indicator only display  medium and long-term trends . The ind
The Volume by Price Indicator for MetaTrader 5 features Volume Profile and Market Profile TPO (Time Price Opportunity). Get valuable insights out of currencies, equities and commodities data. Gain an edge trading financial markets. Volume and TPO histogram bar and line charts. Volume Footprint charts. TPO letter and block marker charts including split structures. Versatile segmentation and compositing methods. Static, dynamic and flexible ranges with relative and/or absolute visualizations. Lay
Présentation       Quantum Breakout PRO   , l'indicateur révolutionnaire MQL5 qui transforme la façon dont vous négociez les zones d'évasion ! Développé par une équipe de traders expérimentés avec une expérience commerciale de plus de 13 ans,       Évasion quantique PRO       est conçu pour propulser votre parcours commercial vers de nouveaux sommets grâce à sa stratégie de zone de discussion innovante et dynamique. Quantum Breakout Indicator vous donnera des flèches de signalisation sur le
Top indicator for MT5   providing accurate signals to enter a trade without repainting! It can be applied to any financial assets:   forex, cryptocurrencies, metals, stocks, indices .  Watch  the video  (6:22) with an example of processing only one signal that paid off the indicator! MT4 version is here It will provide pretty accurate trading signals and tell you when it's best to open a trade and close it. Most traders improve their trading results during the first trading week with the help of
ICT, SMC, SMART MONEY CONCEPTS, SMART MONEY, Smart Money Concept, Support and Resistance, Trend Analysis, Price Action, Market Structure, Order Blocks, BOS/CHoCH,   Breaker Blocks ,  Momentum Shift,   Supply&Demand Zone/Order Blocks , Strong Imbalance,   HH/LL/HL/LH,    Fair Value Gap, FVG,  Premium  &   Discount   Zones, Fibonacci Retracement, OTE, Buy Side Liquidity, Sell Side Liquidity, BSL/SSL Taken, Equal Highs & Lows, MTF Dashboard, Multiple Time Frame, BigBar, HTF OB, HTF Market Structure
AW Trend Predictor MT5
AW Trading Software Limited
4.76 (54)
La combinaison des niveaux de tendance et de panne dans un seul système. Un algorithme d'indicateur avancé filtre le bruit du marché, détermine la tendance, les points d'entrée, ainsi que les niveaux de sortie possibles. Les signaux indicateurs sont enregistrés dans un module statistique, qui vous permet de sélectionner les outils les plus appropriés, montrant l'efficacité de l'historique des signaux. L'indicateur calcule les marques Take Profit et Stop Loss. Manuel et instruction ->   ICI   / v
Auto Order Block with break of structure based on ICT and Smart Money Concepts Futures Break of Structure ( BoS )             Order block ( OB )            Higher time frame Order block / Point of Interest ( POI )    shown on current chart           Fair value Gap ( FVG ) / Imbalance   ,  MTF      ( Multi Time Frame )    Volume Imbalance     ,  MTF          vIMB Gap’s Equal High / Low’s     ,  MTF             EQH / EQL Liquidity               Current Day High / Low           HOD /
Blahtech Supply Demand MT5
Blahtech Limited
4.57 (14)
Was: $299  Now: $99   Supply Demand uses previous price action to identify potential imbalances between buyers and sellers. The key is to identify the better odds zones, not just the untouched ones. Blahtech Supply Demand indicator delivers functionality previously unavailable on any trading platform. This 4-in-1 indicator not only highlights the higher probability zones using a multi-criteria strength engine, but also combines it with multi-timeframe trend analysis, previously confirmed swings
L'indicateur de Carré Gann est un puissant outil d'analyse du marché basé sur l'article "Formule Mathématique pour les Prédictions de Marché" écrit par W.D. Gann. Cet outil utilise des concepts mathématiques et des théories de Gann pour réaliser une analyse précise du marché. Il utilise les carrés de 144, 90, 52 et aussi le carré de 9. De plus, il intègre la méthode du  pour le carré de 9 et sa relation avec les canaux et le modèle en étoile de ce carré. Manuel d'Utilisateur et Application : Ava
TrendMaestro5
Stefano Frisetti
note: this indicator is for METATRADER4, if you want the version for METATRADER5 this is the link:  https://www.mql5.com/it/market/product/108106 TRENDMAESTRO recognizes a new TREND in the bud, he never makes mistakes. The certainty of identifying a new TREND is priceless. DESCRIPTION TRENDMAESTRO identifies a new TREND in the bud, this indicator examines the volatility, volumes and momentum to identify the moment in which there is an explosion of one or more of these data and therefore the mome
Le profit de la structure du marché change à mesure que le prix s'inverse et recule. L'indicateur d'alerte d'inversion de la structure du marché identifie le moment où une tendance ou un mouvement de prix approche de l'épuisement et est prêt à s'inverser. Il vous avertit des changements dans la structure du marché qui se produisent généralement lorsqu'un renversement ou un recul majeur est sur le point de se produire. L'indicateur identifie initialement les cassures et la dynamique des prix,
Trend Line Map Pro MT5
STE S.S.COMPANY
4.67 (9)
Trend Line Map indicator is an addons for   Trend Screener Indicator . It's working as a scanner for all signals generated by Trend screener ( Trend Line Signals ) . It's a Trend Line Scanner based on Trend Screener Indicator.  If you don't have Trend Screener Pro Indicator,   the Trend Line Map Pro will not work.     LIMITED TIME OFFER : Trend Line Map Indicator is available for only 50 $ and lifetime. ( Original price 125$ ) By accessing to our MQL5 Blog,  you can find all our premium indica
TrendLine PRO MT5
Evgenii Aksenov
4.78 (49)
The Trend Line PRO indicator is an independent trading strategy. It shows the trend change, the entry point to the transaction, as well as automatically calculates three levels of Take Profit and Stop Loss protection Trend Line PRO is perfect for all Meta Trader symbols: currencies, metals, cryptocurrencies, stocks and indices Advantages of Trend Line PRO Never redraws its signals The possibility of using it as an independent strategy It has three automatic levels Take Profit and Stop Loss lev
Owl Smart Levels MT5
Sergey Ermolov
4.47 (36)
Version MT4   |  FAQ L' indicateur Owl Smart Levels est un système de trading complet au sein d'un seul indicateur qui comprend des outils d'analyse de marché populaires tels que les fractales avancées de Bill Williams , Valable ZigZag qui construit la structure d'onde correcte du marché et les niveaux de Fibonacci qui marquent les niveaux exacts d'entrée. sur le marché et les endroits où prendre des bénéfices. Description détaillée de la stratégie Mode d'emploi de l'indicateur Conseiller-Assis
TPSpro TRENDPRO  - is a trend indicator that automatically analyzes the market and provides information about the trend and each of its changes, as well as giving signals for entering trades without redrawing! The indicator uses each candle, analyzing them separately. referring to different impulses - up or down impulse. Exact entry points into transactions for currencies, crypto, metals, stocks, indices!  -  Version MT4                  DETAILED DESCRIPTION        /       TRADING SETUPS       
Gartley Hunter Multi
Siarhei Vashchylka
5 (5)
Gartley Hunter Multi - An indicator for searching for harmonic patterns simultaneously on dozens of trading instruments and on all classic timeframes: (m1, m5, m15, m30, H1, H4, D1, Wk, Mn). Manual (Be sure to read before purchasing) | Version for MT4 Advantages 1. Patterns: Gartley, Butterfly, Shark, Crab. Bat, Alternate Bat, Deep Crab, Cypher 2. Simultaneous search for patterns on dozens of trading instruments and on all classic timeframes 3. Search for patterns of all possible sizes. Fr
Was: $249  Now: $99   Market Profile defines a number of day types that can help the trader to determine market behaviour. A key feature is the Value Area, representing the range of price action where 70% of trading took place. Understanding the Value Area can give traders valuable insight into market direction and establish the higher odds trade. It is an excellent addition to any system you may be using. Inspired by Jim Dalton’s book “Mind Over Markets”, this indicator is designed to suit the
Black Dragon indicator mt5
Ramil Minniakhmetov
4.82 (56)
L'indicateur de détection de tendance complétera n'importe quelle stratégie et peut également être utilisé comme un outil indépendant. IMPORTANT! Contactez-moi immédiatement après l'achat pour obtenir des instructions et un bonus !   Avantages Facile à utiliser; ne surcharge pas le graphique avec des informations inutiles. La possibilité d'utiliser comme filtre pour n'importe quelle stratégie. Contient des niveaux dynamiques de cupport et de resistange, qui peuvent être utilisés à la fois
Golden Spikes Detector
Batsirayi L Marango
5 (1)
Golden Spikes Detector Cet indicateur est basé sur une stratégie avancée principalement pour les pics de trading sur les indices Boom et Crash. Des algorithmes complexes ont été mis en œuvre pour détecter uniquement les entrées à forte probabilité. Il alerte sur les entrées potentielles d’achat et de vente. Pour échanger des pics sur le courtier Deriv ou Binary, prenez uniquement les alertes Buy Boom et Sell Cash. Il a été optimisé pour être chargé sur une période de 5 minutes, bien qu'une analy
Matrix Arrow Indicator MT5
Juvenille Emperor Limited
5 (14)
Matrix Arrow Indicator MT5   est une tendance unique 10 en 1 suivant un indicateur multi-période   100% non repeint   qui peut être utilisé sur tous les symboles/instruments:   forex ,   matières premières ,   crypto-monnaies ,   indices ,  actions .  Matrix Arrow Indicator MT5  déterminera la tendance actuelle à ses débuts, en rassemblant des informations et des données à partir d'un maximum de 10 indicateurs standard, qui sont: Indice de mouvement directionnel moyen (ADX) Indice de canal de m
Plus de l'auteur
Best Wave
Vladimir Gotsulenko
3.8 (10)
The indicator of trend (flat) with a price channel. Trading Buy - the price have crossed the central line upwards (the candlestick has closed above the line) and the channel is oriented horizontally (yellow line) or directed upwards(green line). Move to breakeven when reaching the opposite border of the channel. Close positions when conditions for selling are formed. Sell - the price have crossed the central line downwards (the candlestick has closed below the line) and the channel is oriented
FREE
Trend check USDCHF
Vladimir Gotsulenko
3.33 (6)
This indicator gives full information about the market state: strength and direction of a trend, volatility and price movement channel. It has two graphical components: Histogram: the size and the color of a bar show the strength and direction of a trend. Positive values show an ascending trend and negative values - a descending trend. Green bar is for up motion, red one - for down motion, and the yellow one means no trend. Signal line is the value of the histogram (you can enable divergence sea
FREE
VSA Volume Spread Analysis
Vladimir Gotsulenko
3.82 (11)
The indicator produces signals according to the methodology VSA (Volume Spread Analysis) - the analysis of trade volume together with the size and form of candlesticks. The signals are displayed at closing of bars on the main chart in the form of arrows. The arrows are not redrawn. Input Parameters DisplayAlert - enable alerts, true on default; Pointer - arrow type (three types), 2 on default; Factor_distance - distance rate for arrows, 0.7 on default. Recommended timeframe - М15. Currency pai
Angle Regression Line MT4
Vladimir Gotsulenko
4.67 (3)
The indicator allows determining the strength and direction of the trend precisely. The histogram displayed in a separate window shows changes of the slope of the regression line. A signal for entering a deal is crossing the zero line and/or a divergence. The indicator is also useful for wave analysis. Input Parameters: Period - period of calculation, 10 on default; Angle threshold - slope at which a flat is displayed, 6.0 on default (within the range from -6.0 to 6.0); Filter by volume - volume
The indicator produces signals according to the methodology VSA (Volume Spread Analysis) - the analysis of trade volume together with the size and form of candlesticks. The signals are displayed at closing of bars on the main chart in the form of arrows. The arrows are not redrawn. Input Parameters: DisplayAlert - enable alerts, true on default; Pointer - arrow type (three types), 2 on default; Factor_distance - distance rate for arrows, 0.7 on default. Recommended timeframe - М15. Currency pair
The indicator allows determining the strength and direction of the trend precisely. The histogram displayed in a separate window shows changes of the slope of the regression line. A signal for entering a deal is crossing the zero line and/or a divergence. The indicator is also useful for wave analysis. Input Parameters: Period - period of calculation, 24 on default; CalculatedBar - number of bars for displaying a divergence, 300 on default; AngleTreshold - slope at which a flat is displayed, 6.0
Displays divergence for any custom indicator. You just need to specify the name of an indicator name; on default it uses CCI. In addition you can set smoothing for the selected indicator as well as levels. If one of these levels is crossed, you'll receive a notification. The custom indicator must be compiled (a file with extension EX5) and it must be located in MQL5/Indicators directory of the client terminal or in one of its subdirectories. It uses zero bar of the selected indicator with defaul
Trend check
Vladimir Gotsulenko
This indicator gives full information about the market state: strength and direction of a trend, volatility and price movement channel. It has two graphical components: Histogram: the size and the color of a bar show the strength and direction of a trend. Positive values show an ascending trend and negative values - a descending trend. Green bar is for up motion, red one - for down motion, and the yellow one means no trend. Signal line is the value of the histogram (you can enable divergence sea
Power MT5
Vladimir Gotsulenko
The indicator is based on readings of two oscillators: Bulls Power and Bears Power. It clearly shows the balance of buyers and sellers power. A signal for entering a deal is crossing the zero line and/or a divergence. When the volume filter is enabled, yellow histogram bar shows low trading volume (below average for 50 previous bars). Input Parameters: Period - calculation period, 13 on default; CalculatedBar - number of bars for displaying a divergence, 300 on default; Filter by volume - volume
Angle DeMarker MT5
Vladimir Gotsulenko
The indicator shows the angle of the DeMarker indicator line, which allows you to identify possible price extrema more accurately. Histogram bar color and size indicate the direction and angle of the DeMarker line. When the trade volume control is enabled, a yellow bar is an indication of the volume being lower than average over the past 50 bars. The color of the main indicator line shows whether the price has reached an overbought/oversold level in accordance with DeMarker indicator values. The
Filtrer:
Gennadiy Voltornist
11909
Gennadiy Voltornist 2017.12.17 20:08 
 

L'utilisateur n'a laissé aucun commentaire sur la note

Daniel Andrejczuk
5596
Daniel Andrejczuk 2017.11.09 13:41 
 

L'utilisateur n'a laissé aucun commentaire sur la note

Nork
6194
Nork 2017.06.28 04:46 
 

L'utilisateur n'a laissé aucun commentaire sur la note

[Supprimé] 2017.03.31 07:30 
 

L'utilisateur n'a laissé aucun commentaire sur la note

Répondre à l'avis
Version 1.30 2021.11.18
Улучшен алгоритм обработки
Version 1.20 2017.03.31
Added input parameter: Arrows displacement
Version 1.10 2015.09.07
Improved the indicator operation algorithm.