• Aperçu
  • Avis (18)
  • Commentaires (83)
  • Nouveautés

Advanced Supply Demand MT5

4.53

La meilleure solution pour tout commerçant débutant ou expert !

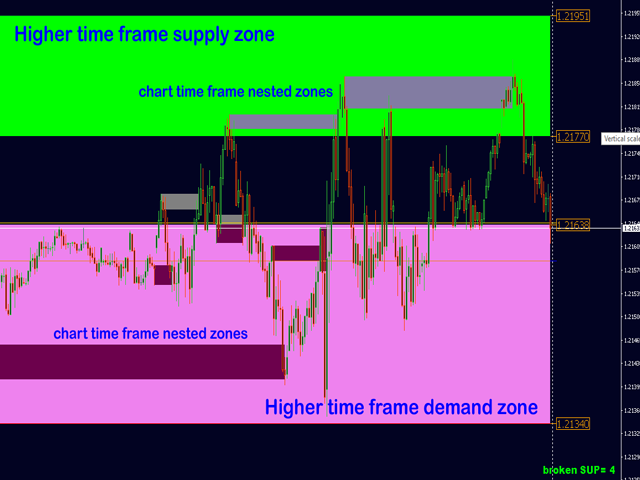
Cet indicateur est un outil de trading unique, de haute qualité et abordable car nous avons intégré un certain nombre de fonctionnalités propriétaires et une nouvelle formule. Avec cette mise à jour, vous pourrez afficher des zones à double horaire. Vous pourrez non seulement afficher un TF plus élevé, mais afficher les deux, le graphique TF, PLUS le TF supérieur : AFFICHAGE DES ZONES NICHÉES. Tous les traders Supply Demand vont adorer. :)

Informations importantes révélées

Maximisez le potentiel de Advanced Supply Demand, veuillez visiter https://www.mql5.com/en/blogs/post/720245

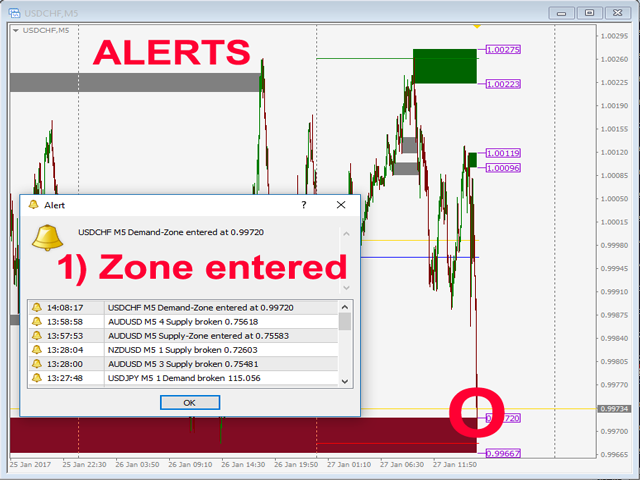
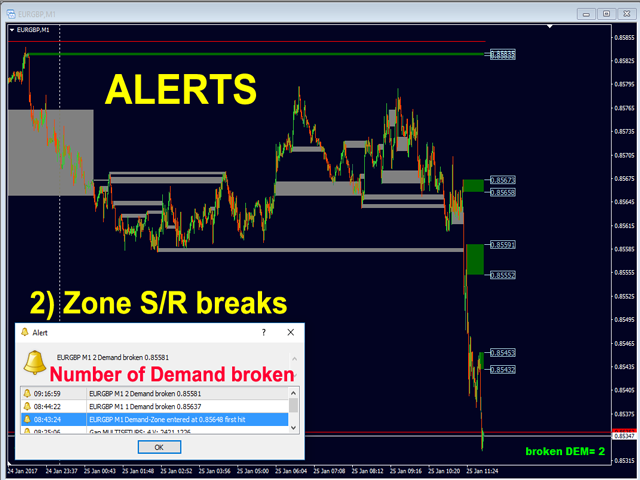
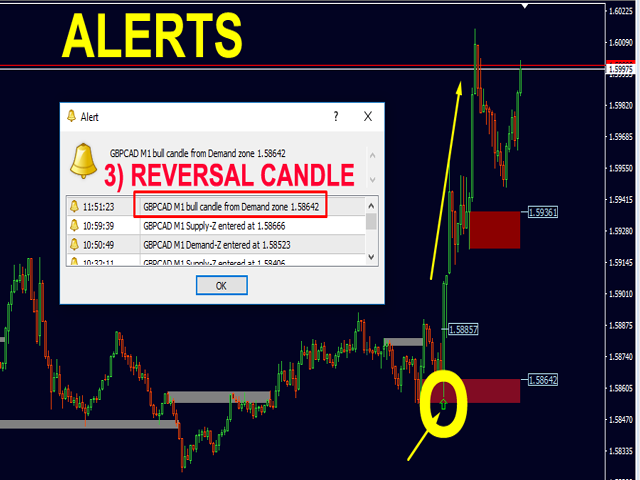
Les zones d'offre et de demande sont utilisées comme déclencheur d'alerte. Vous avez le choix entre 3 alertes. Si le prix 1) entre dans la zone et/ou 2) casse la zone et/ou 3) une bougie d'inversion s'est formée à partir d'une zone. Vous pouvez utiliser une alerte contextuelle avec son sur MetaTrader 4 et/ou push et/ou e-mail. Lorsque vous recevrez l'alerte, vous saurez en tant que commerçant quoi faire.

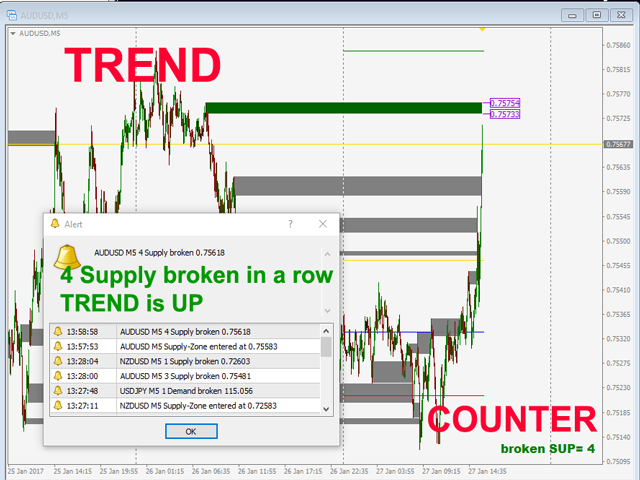
Un message vous indiquera combien de zones de demande ont été cassées d'affilée, vous souhaitez donc échanger avec la tendance et rechercher une poursuite de la tendance.

L'indicateur peut détecter les zones S/D imbriquées !

Une fonctionnalité très puissante ! L'alerte indiquera si une zone S/D est imbriquée (dans) une zone S/D à intervalle de temps plus élevé ! Toutes les alertes peuvent être filtrées pour les zones imbriquées.

Paramètres

Paramètres de demande d'approvisionnement

  • Bougies minimales avant l'impression d'une zone (utilisées pour le graphique en direct).
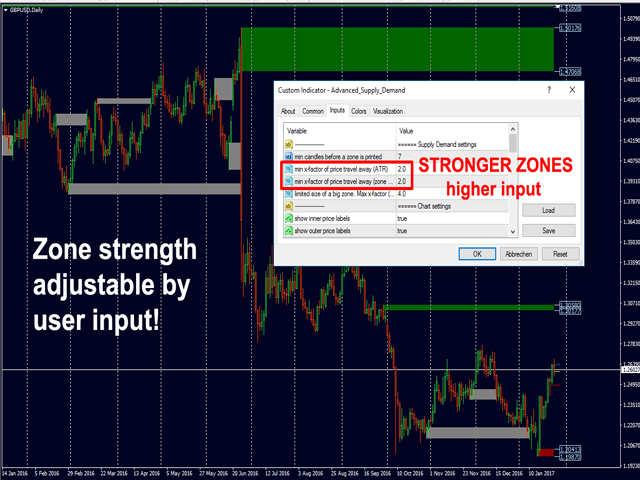
  • Min X-factor of price travel away (ATR) (Plus le nombre est élevé, plus les zones sont fortes). OPTIMISEZ ICI POUR VOTRE SYMBOLE ET VOTRE PÉRIODE !
  • Facteur Y minimum du déplacement du prix (taille de la zone) 2e entrée : plus le nombre est élevé, plus les zones sont fortes. OPTIMISEZ ICI POUR VOTRE SYMBOLE ET VOTRE PÉRIODE !
  • Taille limitée d'une grande zone. Facteur max (ATR) (Les grandes zones surdimensionnées seront réduites. Plus le nombre est élevé, plus les grandes zones sont autorisées).

Paramètres MTF

  • Ajouter un TF plus élevé
  • Période TF supérieure (si la MTF est égale ou inférieure à la TF du graphique, la plus élevée sera utilisée)
  • min HTF!-bougies avant l'impression d'une zone
  • min X-factor of price travel away (ATR) MTF
  • min Y-factor of price travel away (taille de la zone) MTF
  • Taille limitée d'une grande zone. Facteur max. (ATR) MTF (les grandes zones surdimensionnées seront réduites. Plus le nombre est élevé, plus les grandes zones sont autorisées).
  • Afficher les étiquettes de prix intérieures MTF
  • Afficher les étiquettes de prix extérieures MTF

Paramètres du graphique

  • Afficher les étiquettes de prix intérieures.
  • Afficher les étiquettes de prix extérieures.
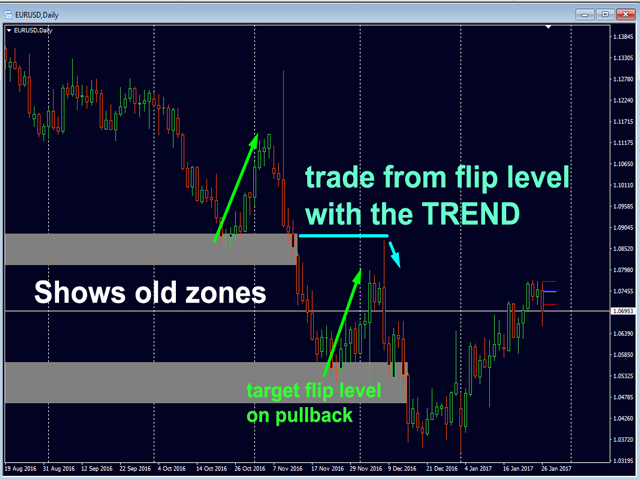
  • Afficher les anciennes zones (nécessaire pour le compteur Sup/Dem, voir ci-dessous).
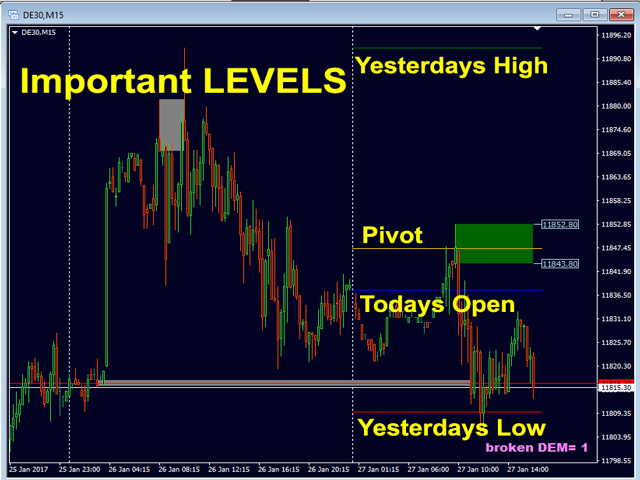
  • Afficher le haut/bas d'hier
  • Afficher le pivot d'aujourd'hui
  • Afficher le nombre de Sup/Dem cassés d'affilée (compteur)
  • Afficher ci-dessus dans le coin
  • dessiner un rectangle étendu sur une bougie vivante

Paramètres d'alerte

  • Zone d'alerte touchée
  • Pause de zone d'alerte
  • Alerte bougie inversée de zone
  • alerte uniquement les zones NICHÉES ! (dans MTF)
  • Alerte fausse évasion
  • FBO min bar Taille Point
  • Fermeture de la barre FBO % (20-90)
  • Nombre de barres de modèle FBO (1-3)
  • Alertes contextuelles (popup et son MT4)
  • Envoyer des alertes par e-mail
  • Envoyer des alertes push

    Paramètres de couleur

    • Vous savez vous en servir. Chaque zone a sa propre couleur.
      Pour voir la liste complète, cliquez ici .

      Autres réglages

      • utiliser le code PIN (à utiliser pour un EA)
      • Afficher le nombre maximum de zones d'approvisionnement
      • Afficher le nombre maximum de zones de demande
      • Pour voir la liste complète, cliquez ici .

        Des astuces

        1. Manuel d'utilisation : Cliquez ici .
        2. Utilisez mon modèle (Voir les commentaires).
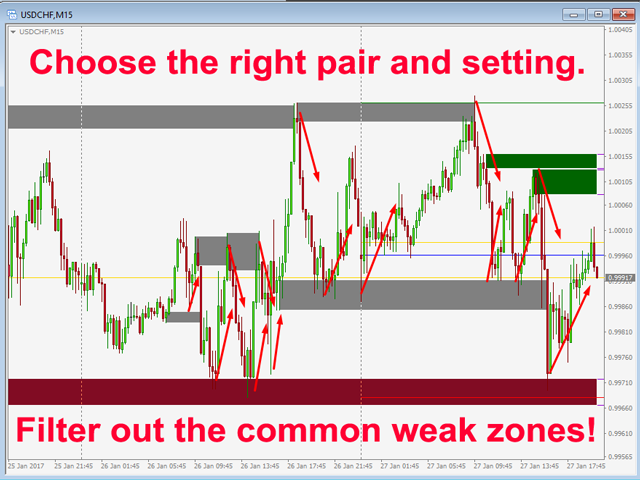
        3. Optimisez la force de la zone pour votre symbole et votre période.
        4. Restez dans la tendance. L'indicateur est principalement utilisé avec l'un de mes autres indicateurs spécialisés de force monétaire.
        5. Consultez mes actualités et mes blogs sur le profil pour le système commercial et les exemples commerciaux.


        Avis 18
        Ely Alsedy
        3018
        Ely Alsedy 2024.03.15 09:56 
         

        it's a great tool to use for assessing the market zones and make a decision also very good to spot fake outs i love to use it with Demark channel or another channel indicator the support and the author gets a THUMBS UP from me

        Claudio Jones
        167
        Claudio Jones 2024.01.28 21:50 
         

        I bought it today at first very promising, light and well built indicator. In the backtest, the reversal arrows work very well in conjunction with the alerts. Everything working perfectly.

        update 08/03/24 - without a doubt it remains an excellent indicator. I'm not a trader yet, but in the future I will become a professional trader. Thanks Bernhard!!!

        Heyneke
        45
        Heyneke 2023.11.09 20:25 
         

        Insanely accurate indicator ! Took the time to study the logic and settings behind the indicator. Strongly doubt you’ll find better on the market. Thanks a mil

        Produits recommandés
        Owl Smart Levels MT5
        Sergey Ermolov
        4.47 (36)
        Version MT4   |  FAQ L' indicateur Owl Smart Levels est un système de trading complet au sein d'un seul indicateur qui comprend des outils d'analyse de marché populaires tels que les fractales avancées de Bill Williams , Valable ZigZag qui construit la structure d'onde correcte du marché et les niveaux de Fibonacci qui marquent les niveaux exacts d'entrée. sur le marché et les endroits où prendre des bénéfices. Description détaillée de la stratégie Mode d'emploi de l'indicateur Conseiller-Assis
        Noize Absorption Index - is the manual trading system that measures the difference of pressure between bears forces and bulls forces. Green line - is a noize free index that showing curent situation. Zero value of index shows totally choppy/flat market.Values above zero level shows how powerfull bullish wave is and values below zero measures bearish forces.Up arrow appears on bearish market when it's ready to reverse, dn arrow appears on weak bullish market, as a result of reverse expectation.
        Robust median Renko style indicator for creating custom charts resembling Median Renko, Mean Renko, Turbo Renko and Better Renko candles as well as vanilla Renko with wicks plus Point-O charts. This all in one package provides all of the signals needed by day traders, scalpers, and even long-term traders. Main characteristics The indicator is an overlay on the main chart so it is possible to utilize one-click trading and order manipulation directly on the custom charts. Visual order placement
        Cumulative delta indicator As most traders believe, the price moves under the pressure of market buying or selling. When someone redeems an offer standing in the cup, the deal is a "buy". If someone pours into the bid standing in the cup - the deal goes with the direction of "sale". The delta is the difference between purchases and sales. A cumulative delta - the difference between the cumulative sum of purchases and sales for a certain period of time. It allows you to see who is currently contr
        Magic Finger can help you identify trends and trading opportunities clearly. The finger points to the open position signal, and the discoloration line is confirmed by the trend. If you are a day trader, you can choose to trade during a period of active trading, referring to the discoloration line as the basis for the next order, finger signal as a filter. If you are a trend trader, you can choose a period above H1, wait for the appearance of the finger signal in the key price area, and enter
        PZ Trend Trading MT5
        PZ TRADING SLU
        3.67 (3)
        Trend Trading is an indicator designed to profit as much as possible from trends taking place in the market, by timing pullbacks and breakouts. It finds trading opportunities by analyzing what the price is doing during established trends. [ Installation Guide | Update Guide | Troubleshooting | FAQ | All Products ] Trade financial markets with confidence and efficiency Profit from established trends without getting whipsawed Recognize profitable pullbacks, breakouts and early reversals The ind
        PipFinite Trend PRO MT5
        Karlo Wilson Vendiola
        4.87 (664)
        Breakthrough Solution For Trend Trading And Filtering With All Important Features Built Inside One Tool! Trend PRO's smart algorithm detects the trend, filters out market noise and gives entry signals with exit levels. The new features with enhanced rules for statistical calculation improved the overall performance of this indicator. Important Information Revealed Maximize the potential of Trend Pro, please visit www.mql5.com/en/blogs/post/713938 The Powerful Expert Advisor Version Automa
        How to use Pair Trading Station Pair Trading Station is recommended for H1 time frame and you can use it for any currency pairs. To generate buy and sell signal, follow few steps below to apply Pair Trading Station to your MetaTrader terminal. When you load Pair Trading Station on your chart, Pair Trading station will assess available historical data in your MetaTrader platforms for each currency pair. On your chart, the amount of historical data available will be displayed for each currency pai
        Heiken Ashi Smoothed Strategy is a very simple but powerful system to get forex market trend direction. This indicator is actually 2 indicators in 1 pack, Heiken Ashi and Heiken Ashi Smoothed Moving Average both included. Because HA (Heiken Ashi) and HAS (Heiken Ashi Smoothed) are calculated in the same one system event with necessary buffers and loop only, so it is the FAST, OPTIMIZED and EFFICIENT HA having the combined indicator of MetaTrader 5. You can choose to display HA and HAS in the sam
        Your Trend Friend
        Luigi Nunes Labigalini
        The trend is your friend! Look at the color of the indicator and trade on that direction. It does not  repaint. After each candle is closed, that's the color of the trend. You can focus on shorter faster trends or major trends, just test what's most suitable for the symbol and timeframe you trade. Simply change the "Length" parameter and the indicator will automatically adapt. You can also change the color, thickness and style of the lines. Download and give it a try! There are big movements
        Candle Pattern Finder MT5
        Pavel Zamoshnikov
        4.33 (6)
        This indicator searches for candlestick patterns. Its operation principle is based on Candlestick Charting Explained: Timeless Techniques for Trading Stocks and Futures by Gregory L. Morris. If a pattern is detected, the indicator displays a message at a bar closure. If you trade using the MetaTrader 4 terminal, then you can download the full analogue of the " Candle Pattern Finder for MT4 " indicator It recognizes the following patterns: Bullish/Bearish (possible settings in brackets) : Hamme
        Le niveau Premium est un indicateur unique avec une précision de plus de 80 % des prédictions correctes ! Cet indicateur a été testé par les meilleurs Trading Specialists depuis plus de deux mois ! L'indicateur de l'auteur que vous ne trouverez nulle part ailleurs ! À partir des captures d'écran, vous pouvez constater par vous-même la précision de cet outil ! 1 est idéal pour le trading d'options binaires avec un délai d'expiration de 1 bougie. 2 fonctionne sur toutes les paires de de
        Orbit Rage Final 2
        BILLY ARANDUQUE ABCEDE
        Note : i only sell this EA on MQL5, any other sellers is fake. Orbit Rage Final, a cutting-edge trading strategy meticulously designed around the bull/bear candle approach and divergence analysis. This powerful tool is engineered to empower you to shape the life you desire. To embark on this transformative journey, simply download and seamlessly integrate it into your MetaTrader 4 platform by placing it in the experts advisors folder. Orbit Rage Final revolutionizes trading by offering a risk-f
        Renko Gold
        Ignacio Agustin Mene Franco
        Renko Gold! clearly indicates the floors and ceilings where it goes from 4 lines, the line below that marks the floor in green confirming with the thinnest line clarifies the purchase entry, the same is for sale, the top line marks the ceiling and the thinnest red line marks the sale, This indicator works for all temporalities! For Forex and Synthetic Indices markets! It also works for crypto markets! Good profit! World Investor.
        "Support and Resistance" is a fundamental concept in technical analysis for trading stocks, currencies, or other assets in financial markets. Here's how to use it: Identifying Support Support is a price level where buying is strong. When the price drops to this level, there tends to be significant buying activity, preventing the price from falling further. Identifing Support: Look for the lowest points in a given period and find levels where the price has bounced back up multiple times. Usage:
        Was: $249  Now: $99   Market Profile defines a number of day types that can help the trader to determine market behaviour. A key feature is the Value Area, representing the range of price action where 70% of trading took place. Understanding the Value Area can give traders valuable insight into market direction and establish the higher odds trade. It is an excellent addition to any system you may be using. Inspired by Jim Dalton’s book “Mind Over Markets”, this indicator is designed to suit the
        SmartTrendMt5
        Andrey Spiridonov
        The SmartTrendMt5 trend indicator generates signals based on the principle of combined analysis of calculated reference points within the Keltner channel. The indicator plots the Keltner channel in a separate window (by default, red lines and a blue line - the middle of the channel), and also draws the histogram of calculated reference points for each candle (by default, the histogram bars are yellow). The should be attached to a chart of any timeframe and any trading symbol in the usual way.
        Cet indicateur vous montrera les valeurs TP et SL (dans cette devise) que vous avez déjà définies pour chaque commande sur les graphiques (fermées à la ligne de transaction/commande) qui vous aideront beaucoup à estimer vos profits et pertes pour chaque commande. Et il vous montre également les valeurs PIP. le format affiché est "Valeurs monétaires de nos valeurs de profit ou de perte / PIPs". La valeur TP sera affichée en couleur verte et la valeur SL sera affichée en couleur rouge. Pour tou
        This indicator is the same as the popular Heiken Ashi Smoothed. The Heikin Ashi indicator for MetaTrader 5 already exists, but it has two disadvantages: It paints the candles not accurate. It's not possible to change the candle width. See also Heikin Ashi in MQL5 Code Base . In this version there are no such disadvantages.
        Wave Trend MT5
        Diego Arribas Lopez
        MT4 Version Wave Trend MT5 Wave Trend is an oscillator, which helps identifing in a extremely accurate manner market reversals. The Oscillator being obove the overbought level and a cross down of the fast into the slow MA usually indicates a good SELL signal. If the oscillators is below the oversold level and the fast MA crosses over the slower MA usually highlights a good BUY signal. The Wave Trend indicator can be also used when divergences appear against the price, indicating the current move
        Double HMA MTF for MT5
        Pavel Zamoshnikov
        5 (2)
        This is an advanced multi-timeframe version of the popular Hull Moving Average (HMA) Features Two lines of the Hull indicator of different timeframes on the same chart. The HMA line of the higher timeframe defines the trend, and the HMA line of the current timeframe defines the short-term price movements. A graphical panel with HMA indicator data from all timeframes at the same time . If the HMA switched its direction on any timeframe, the panel displays a question or exclamation mark with a tex
        Automated Trendlines MT5
        Georgios Kalomoiropoulos
        Les lignes de tendance sont l'outil d'analyse technique le plus essentiel dans le trading forex. Malheureusement, la plupart des commerçants ne les dessinent pas correctement. L'indicateur Automated Trendlines est un outil professionnel pour les traders sérieux qui vous aide à visualiser le mouvement de tendance des marchés. Il existe deux types de lignes de tendance, les lignes de tendance haussières et les lignes de tendance baissières. Dans la tendance haussière, la ligne de tendance
        PipFinite Exit EDGE MT5
        Karlo Wilson Vendiola
        4.89 (35)
        Did You Have A Profitable Trade But Suddenly Reversed? In a solid strategy, exiting a trade is equally important as entering. Exit EDGE helps maximize your current trade profit and avoid turning winning trades to losers. Never Miss An Exit Signal Again Monitor all pairs and timeframes in just 1 chart www.mql5.com/en/blogs/post/726558 How To Trade You can close your open trades as soon as you receive a signal Close your Buy orders if you receive an Exit Buy Signal. Close your Sell orde
        Atomic Analyst MT5
        Issam Kassas
        4.22 (9)
        Tout d'abord, il convient de souligner que cet indicateur de trading n'est ni repainting, ni redrawing et ne présente aucun délai, ce qui le rend idéal à la fois pour le trading manuel et automatisé. L'Analyste Atomique est un indicateur d'action sur les prix PA qui utilise la force et le momentum du prix pour trouver un meilleur avantage sur le marché. Équipé de filtres avancés qui aident à éliminer les bruits et les faux signaux, et à augmenter le potentiel de trading. En utilisant plusieur
        Big Player Range
        Thalles Nascimento De Carvalho
        5 (2)
        Bienvenue sur l'indicateur "BigPlayerRange", un outil d'analyse technique développé pour identifier les zones d'intérêt significatives des institutions financières sur les marchés. Cet indicateur offre une analyse précise des plages de prix où les principaux acteurs du marché démontrent une activité et un intérêt considérables. Principales caractéristiques : 1. Cartographie des zones d'intérêt institutionnel : "BigPlayerRange" met en évidence avec précision les zones du graphique où les in
        Golden Hunter MT5
        Rodrigo Arana Garcia
        DERNIER COPIE A 75$ ---> Suivant : 99$ !!!  Version MT4 Golden Hunter   a été développé pour les traders qui négocient manuellement sur les marchés. Il s'agit d'un outil très puissant composé de 3 indicateurs différents : Stratégie d'entrée puissante : Formée par un indicateur qui mesure la volatilité de la paire de devises et identifie la tendance du marché. LSMA : Lisse les données de prix et est utile pour détecter la tendance à court terme. Heikin Ashi : Une fois l'indicateur attaché au g
        Introduction The "Two Moving Average Crossover" indicator for MetaTrader 5 (MT5) is a technical analysis tool that displays two moving averages and notifies when the moving averages cross each other. The indicator calculates and plots two moving averages, one of which is faster and the other is slower. When the faster moving average crosses above the slower moving average, it is considered a bullish signal, indicating a potential trend reversal or the start of a new uptrend. Conversely, when th
        Volality Index scalper indicator  Meant for Volality pairs such as Volality 10, 25, 50, 75 and 100 The indicator works on all timeframes from the 1 minute to the monthly timeframe the indicator is non repaint the indicator has 3 entry settings 1 color change on zero cross 2 color change on slope change 3 color change on signal line cross Orange line is your sell signal Blue line is your buy signal.
        L'indicateur calcule et trace automatiquement les niveaux de support et de résistance de Fibonacci - l'un des outils les plus efficaces pour l'analyse de marché. Le calcul utilise les données de prix moyennes pour la période et la période sélectionnées. Le minimum et le maximum pour cette période sont considérés comme le début et la fin du mouvement. Les niveaux de Fibonacci vous permettent de voir des points de référence potentiels, autour desquels le mouvement des prix peut ralentir ou s'inver
        HMA Trend Professional MT5
        Pavel Zamoshnikov
        4.4 (5)
        Improved version of the free HMA Trend indicator (for MetaTrader 4) with statistical analysis. HMA Trend is a trend indicator based on the Hull Moving Average (HMA) with two periods. HMA with a slow period identifies the trend, while HMA with a fast period determines the short-term movements and signals in the trend direction. The main differences from the free version: Ability to predict the probability of a trend reversal using analysis of history data. Plotting statistical charts for analyz
        Les acheteurs de ce produit ont également acheté
        Bill Williams Advanced
        Siarhei Vashchylka
        5 (3)
        Bill Williams Advanced is designed for automatic chart analysis using Bill Williams' "Profitunity" system. The indicator analyzes four timeframes at once. Manual (Be sure to read before purchasing) Advantages 1. Automatically analyzes the chart using the "Profitunity" system of Bill Williams. The found signals are placed in a table in the corner of the screen. 2. Equipped with a trend filter based on the Alligator indicator. Most of the system signals are recommended to be used only accordi
        TrendMaestro5
        Stefano Frisetti
        note: this indicator is for METATRADER4, if you want the version for METATRADER5 this is the link:  https://www.mql5.com/it/market/product/108106 TRENDMAESTRO recognizes a new TREND in the bud, he never makes mistakes. The certainty of identifying a new TREND is priceless. DESCRIPTION TRENDMAESTRO identifies a new TREND in the bud, this indicator examines the volatility, volumes and momentum to identify the moment in which there is an explosion of one or more of these data and therefore the mome
        PZ Swing Trading MT5
        PZ TRADING SLU
        5 (4)
        Swing Trading is the first indicator designed to detect swings in the direction of the trend and possible reversal swings. It uses the baseline swing trading approach, widely described in trading literature. The indicator studies several price and time vectors to track the aggregate trend direction and detects situations in which the market is oversold or overbought and ready to correct. [ Installation Guide | Update Guide | Troubleshooting | FAQ | All Products ] Profit for market swings with
        Professional Scalping Tool on Deriv Attention! The indicator will be sold in limited quantities!!! Description: This trading indicator is designed for professional traders focused on scalping. Designed with the market in mind, it provides highly accurate spike trading signals. It works on the M1 timeframe and supports the following symbols: Boom 300 Index, Boom 500 Index, Boom 1000 Index, Crash 300 Index, Crash 500 Index, Crash 1000 Index. Functional Features: - Direction: - Trading is ca
        IVISTscalp5
        Vadym Zhukovskyi
        5 (3)
        Nous vous présentons l'indicateur iVISTscalp5, qui est non seulement unique, mais également efficace dans les opérations de trading. Cet indicateur est basé sur des données temporelles et est le résultat de nombreuses années d'expérience et d'analyse approfondie des marchés financiers. L'indicateur iVISTscalp5 est un excellent outil pour le trading manuel. La commodité, la simplicité et la visualisation - toute la complexité est cachée à l'intérieur. Nous avons simplifié au maximum les paramètre
        Weis Wave with Alert MT5
        Trade The Volume Waves Single Member P.C.
        4.93 (15)
        Rental/Lifetime Package Options and Privileges  * For optimum results the yearly or lifetime package is suggested due to live training ! Rent Monthly Six Months   Yearly/Lifetime Weis Wave with Speed with Alert+Speed Index x x x Manual  x x x Quick Set up Video x x x Blog x x x Lifetime Updates x x x Setup and Training Material x x Free Rectangle Break Alert Tool      x Discord Access Channel "The SI traders" x 2-hour live methodology training x How to trade with it:    http://
        This is arguably the most complete harmonic price formation auto-recognition indicator you can find for the MetaTrader Platform. It detects 19 different patterns, takes fibonacci projections as seriously as you do, displays the Potential Reversal Zone (PRZ) and finds suitable stop-loss and take-profit levels. [ Installation Guide | Update Guide | Troubleshooting | FAQ | All Products ] It detects 19 different harmonic price formations It plots primary, derived and complementary Fibonacci p
        The indicator is designed to close positions on the market in time. For example: to take profits ahead of schedule if the price has not reached TakeProfit, and the market is turning around. The indicator analyzes the momentum, not the trend. He does not give any information about the trend. The indicator is well suited for finding divergence. The Ershov 38 Parrots indicator dynamically adjusts to the market and detects price movement impulses of medium and high amplitude. It almost does not rea
        Multi-currency, multi-timeframe, harmonic pattern indicator AB = CD. Supports sending push notifications about signals to a mobile device, messages on e-mail, as well as messages using alerts on all available currency pairs and timeframes. This indicator was based on the indicator Harmonic ABCD Universal. Version for MetaTrader 5:  https://www.mql5.com/en/market/product/44972 . See also: Harmonic ABCD Universal for MetaTrader 4 . Using modern software development methods has made the indicator a
        RAD CRITICAL LEVES RAD indicator tracks “Relevant Volume” in real time, identifying accumulation and distribution processes, projecting them in the chart as SUPPORT or RESISTANCE zones. Natural   support   and resistance levels are generated by Volume Accumulation and Distribution processes. As these processes evolve, levels at which the relevant volume in the market place is positioned, become difficult areas to cross upwards or downwards. By using this information, traders can identify very s
        Tricky to find and scarce in frequency, divergences are one of the most reliable trading scenarios. This indicator finds and scans for regular and hidden divergences automatically using your favourite oscillator. [ Installation Guide | Update Guide | Troubleshooting | FAQ | All Products ] Easy to trade Finds regular and hidden divergences Supports many well known oscillators Implements trading signals based on breakouts Displays suitable stop-loss and take-profit levels Configurable oscilla
        Introduction to X3 Chart Pattern Scanner X3 Cherart Pattern Scanner is the non-repainting and non-lagging indicator detecting X3 chart patterns including Harmonic pattern, Elliott Wave pattern, X3 patterns, and Japanese Candlestick patterns. Historical patterns match with signal patterns. Hence, you can readily develop the solid trading strategy in your chart. More importantly, this superb pattern scanner can detect the optimal pattern of its kind. In addition, you can switch on and off individu
        "Piranha" - an autonomous trading system that determines overbought and oversold levels on the chart. Red and blue zones represent overbought and oversold levels respectively. Entry points are marked with arrows: a downward arrow in the red zone for "sell" and an upward arrow in the blue zone for "buy". The Take profit level is indicated by the green moving average. Key features: Adjusting the Take profit level as the green moving average changes position. Averaging ability when a new market e
        INDICATEUR basé sur l'INTELLIGENCE ARTIFICIELLE qui génère d'éventuelles entrées d'achat et de vente pour les options binaires. l'indicateur fonctionne sur 3 stratégies différentes : 1) en lisant les volumes, il envoie un signal lorsque le prix doit s'inverser 2) à travers la divergence entre prix et volume, il envoie un signal lorsque la tendance doit se poursuivre ou s'inverser 3) grâce à la convergence entre le prix et le volume, il envoie un signal lorsque la tendance doit se poursu
        VTrende Pro
        Andrii Diachenko
        5 (1)
        VTrende Pro - MTF indicator for trend trading with a display panel for MT5 *** Videos can be translated into any language using subtitles (video language - Russian) Although the signals of the VTrende Pro indicator can be used as signals of a full-fledged trading system, it is recommended to use them in conjunction with the Bill Williams TS. VTrende Pro is an extended version of the VTrende indicator. Difference between Pro version and VTrende: - Time zones - Signal V - signal 1-2 waves
        Good day! I present to you a trading technical indicator for Deriv broker synthetic indices. This indicator ONLY works with the following indices: Boom 300 Index Boom 500 Index Boom 1000 Index Crash 300 Index Crash 500 Index Crash 1000 Index The indicator was created to give signals to open medium-term trades in the direction of Spikes. But you can open trades in the opposite direction to Spikes, at your own risk. Trade only on M1. Other TFs do not guarantee the correct operation of the indic
        L'indicateur de Carré Gann est un puissant outil d'analyse du marché basé sur l'article "Formule Mathématique pour les Prédictions de Marché" écrit par W.D. Gann. Cet outil utilise des concepts mathématiques et des théories de Gann pour réaliser une analyse précise du marché. Il utilise les carrés de 144, 90, 52 et aussi le carré de 9. De plus, il intègre la méthode du  pour le carré de 9 et sa relation avec les canaux et le modèle en étoile de ce carré. Manuel d'Utilisateur et Application : Ava
        SMCpro
        Arief
        5 (1)
        SMCpro MT5  Original Price  $440   ---  Currently Price  40% OFF  ( for unlimited use ) Hello World! Introducing.. SMCpro tool and Indicator for  MetaTrader 5 , a cutting-edge feature designed to revolutionize your trading experience. With innovative ICT Smart Money Concept, you gain unparalleled insight into market dynamics, empowering you to make informed trading decisions like never before. Built on the foundation of advanced algorithms and real-time data analysis, SMCpro tool and Indicat
        PZ Day Trading MT5
        PZ TRADING SLU
        2.83 (6)
        This indicator detects price reversals in a zig-zag fashion, using only price action analysis and a donchian channel. It has been specifically designed for short-term trading, without repainting or backpainting at all. It is a fantastic tool for shrewd traders aiming to increase the timing of their operations. [ Installation Guide | Update Guide | Troubleshooting | FAQ | All Products ] Amazingly easy to trade It provides value on every timeframe It displays suitable SL and TP levels It impl
        Cet indicateur est une méthode d'analyse de marché basée sur l'article "Formule mathématique pour les prédictions de marché" écrit par W.D. Gann en fonction du carré de neuf et du carré de 144 méthodes. Manuel de l'Utilisateur: Add Your review And contact us to get it Vous pouvez acheter la version complète MT4 à partir de : https://www.mql5.com/en/market/product/15316 Vous pouvez tester gratuitement sur MT4 : https://www.mql5.com/en/market/product/15320?source=Site +Profile+Seller#!t
        Elliot Waves Analyzer Pro
        Viktor Weidenthal
        3.25 (4)
        Elliot Waves Analyzer Pro calculates Elliot Waves to Help Identify Trend direction and Entry Levels. Mainly for Swing Trading Strategies. Usually one would open a Position in trend direction for Wave 3 or a Correction for Wave C . This Indicator draws Target Levels for the current and next wave. Most important Rules for Elliot Wave Analysis are verified by the Indicator.  The Pro version analyzes Multiple Timeframes and shows the Subwaves and Target-Levels.   For an Overview  " Elliot Waves Anal
        Elliott Wave Trend was designed for the scientific wave counting. This tool focuses to get rid of the vagueness of the classic Elliott Wave Counting using the guideline from the template and pattern approach. In doing so, firstly Elliott Wave Trend offers the template for your wave counting. Secondly, it offers Wave Structural Score to assist to identify accurate wave formation. It offers both impulse wave Structural Score and corrective wave Structure Score. Structural Score is the rating to sh
        Introduction Excessive Momentum Indicator is the momentum indicator to measure the excessive momentum directly from raw price series. Hence, this is an extended price action and pattern trading. Excessive Momentum Indicator was originally developed by Young Ho Seo. This indicator demonstrates the concept of Equilibrium Fractal Wave and Practical Application at the same time. Excessive Momentum detects the market anomaly. Excessive momentum will give us a lot of clue about potential reversal and
        Tatino Super Signals is Non Repaint Indicator for Binary Option trading and Forex trading. Recommendations: Timeframe: All timeframes. For best results we recommend using it on M1, M5 and M15 timeframes. Currency pairs: All Pairs Account type: All Type Broker time: Any Brokers : Alls Binary Trading : Expired 1 Candle Buffer Buy=1, Sell=0, Entry Next Candle Recommended Forex trading stop loss : 15 pips Recommended  Forex tradingTake profit levels : 15 pips Specifications: Does not repaint  
        Smooth price for Monarch
        Konstantin Gruzdev
        5 (1)
        The Smooth Price technical indicator is used for plotting a smoothed line as close to the price of the financial instrument as possible, and serves to eliminate its noise components. The indicator is part of the Monarch trading system, but here it is presented as an independent technical analysis tool. The indicator is based on the cluster digital filter , which, unlike the ClusterSMA , is applied directly to the price time series. Smooth Price does not redraw (except the very last, zero bar) an
        Indicateur unique qui met en œuvre une approche professionnelle et quantitative pour signifier le trading de réversion. Il capitalise sur le fait que le prix dévie et revient à la moyenne de manière prévisible et mesurable, ce qui permet des règles d'entrée et de sortie claires qui surpassent largement les stratégies de trading non quantitatives. [ Installation Guide | Update Guide | Troubleshooting | FAQ | All Products ] Des signaux de trading clairs Étonnamment facile à échanger Couleurs et
        This is the famous Sunflower indicator for Metatrader5. This indicator marks possible tops and bottoms on price charts. The indicator identifies tops and bottoms in the asset's price history, keep in mind that the current sunflower of the last candle repaints, as it is not possible to identify a top until the market reverses and it is also not possible to identify a bottom without the market stop falling and start rising. If you are looking for a professional programmer for Metatrader5, please
        ZigZag de Suavizador
        Cesar Juan Flores Navarro
        Teniendo una entrada de precios suavizados, los cuales son procesador por un ZigZag en tiempo real, dando como resultado un suavizador ajustado a un ZigZag. Con valores de entrada (periodo) mayores se vuelve un poco lenta en M1,, Ideal para H1, H4, D1 Trabaja bien con otros suavizadores, ya que su intersección es ideal Al iniciar empiza con mayor precisión desde el momento de activación, siendo el historial (anterior) de referencia ----------------------------------------------------------------
        Recommended TimeFrame >= H1. 100% Non Repainted at any moment.  Use it carefully, only with Trend Direction. Trading Usage: 2 Variants: as Range System or as BreakOut System (Both Only With Trend Direction)::: (Always use StopLoss for minimise Risk); [1] as Range System: (Recommended) in UP TREND:  - BUY in Blue Line , then if price goes down by 50 points (on H1) open Second BUY.   Close in any Profit you wish: TrailingStop(45 points) or Close when Price touches upper Gold Line. in DOWN TR
        [ MT4 Version ] Order Block Indicator MT5 Order Block Indicator MT5 is currently the most accurate and customizable indicator in the market. It has been developed to facilitate the analysis of operations based on Order Blocks and Supply and Demand Zones. These zones are possible reversal points of a movement. Order Blocks indicate a possible accumulation of orders in one area. The price usually gets to reach and react strongly to those areas. The most relevant levels for this reaction are the c
        Plus de l'auteur
        Actuellement 20% de réduction ! La meilleure solution pour tout débutant ou trader expert ! Ce logiciel de tableau de bord fonctionne sur 28 paires de devises. Il est basé sur 2 de nos principaux indicateurs (Advanced Currency Strength 28 et Advanced Currency Impulse). Il donne un excellent aperçu de l'ensemble du marché Forex. Il montre les valeurs de l'Advanced Currency Strength, la vitesse de mouvement des devises et les signaux pour 28 paires de devises dans tous les (9) délais. Imagine
        ACTUELLEMENT 26% DE RÉDUCTION La meilleure solution pour tout débutant ou trader expert ! Cet indicateur est un outil de trading unique, de haute qualité et abordable car nous avons incorporé un certain nombre de caractéristiques exclusives et une nouvelle formule. Avec seulement UN graphique, vous pouvez lire la force de la devise pour 28 paires Forex ! Imaginez comment votre trading va s'améliorer parce que vous êtes capable de repérer le point de déclenchement exact d'une nouvelle tendan
        Advanced Supply Demand
        Bernhard Schweigert
        4.92 (310)
        CURRENTLY 26% OFF !! Best Solution for any Newbie or Expert Trader! This indicator is a unique, high quality and affordable trading tool because we have incorporated a number of proprietary features and a new formula. With this update, you will be able to show double timeframe zones. You will not only be able to show a higher TF but to show both, the chart TF, PLUS the higher TF: SHOWING NESTED ZONES. All Supply Demand traders will love it. :) Important Information Revealed Maximize the potenti
        ACTUELLEMENT 31% DE RÉDUCTION ! ! La meilleure solution pour tout débutant ou Expert Trader ! Cet indicateur est un outil de trading unique, de haute qualité et abordable car nous avons incorporé un certain nombre de caractéristiques exclusives et une formule secrète. Avec seulement UN graphique, il donne des alertes pour les 28 paires de devises. Imaginez comment votre trading s'améliorera parce que vous serez capable de repérer le point de déclenchement exact d'une nouvelle tendance ou d'
        GOLD Impulse with Alert
        Bernhard Schweigert
        4.56 (9)
        Cet indicateur est une super combinaison de nos 2 produits Advanced Currency IMPULSE with ALERT  +   Currency Strength Exotics . Il fonctionne pour tous les cadres temporels et montre graphiquement l'impulsion de force ou de faiblesse pour les 8 principales devises plus un symbole ! Cet indicateur est spécialisé pour montrer l'accélération de la force des devises pour tout symbole comme l'or, les paires exotiques, les matières premières, les indices ou les contrats à terme. C'est le premi
        Currency Strength Exotics
        Bernhard Schweigert
        4.88 (33)
        ACTUELLEMENT 20% DE RÉDUCTION ! La meilleure solution pour tout débutant ou trader expert ! Cet indicateur est spécialisé pour montrer la force de la devise pour tous les symboles comme les paires exotiques, les matières premières, les indices ou les contrats à terme. C'est le premier de son genre, n'importe quel symbole peut être ajouté à la 9ème ligne pour montrer la force réelle de la devise de l'or, l'argent, le pétrole, DAX, US30, MXN, TRY, CNH etc. Il s'agit d'un outil de trading uniq
        Supply and Demand Dashboard PRO
        Bernhard Schweigert
        4.82 (22)
        Actuellement 20% de réduction ! Ce tableau de bord est un logiciel très puissant qui fonctionne sur plusieurs symboles et jusqu'à 9 horizons temporels. Il est basé sur notre indicateur principal (Best reviews : Advanced Supply Demand ).   Le tableau de bord donne une excellente vue d'ensemble. Il montre :  Les valeurs d'offre et de demande filtrées, y compris l'évaluation de la force de la zone, Les distances en pips vers/et dans les zones, Il met en évidence les zones imbriquées, Il donne
        La meilleure solution pour tout débutant ou trader expert ! Cet indicateur est un outil de trading unique, de haute qualité et abordable car nous avons incorporé un certain nombre de caractéristiques exclusives et une nouvelle formule. Avec seulement UN graphique, vous pouvez lire la force de la devise pour 28 paires Forex ! Imaginez comment votre trading va s'améliorer parce que vous êtes capable de repérer le point de déclenchement exact d'une nouvelle tendance ou d'une opportunité de scalp
        La meilleure solution pour tout débutant ou Expert Trader ! Cet indicateur est un outil de trading unique, de haute qualité et abordable car nous avons incorporé un certain nombre de caractéristiques exclusives et une formule secrète. Avec seulement UN graphique, il donne des alertes pour les 28 paires de devises. Imaginez comment votre trading s'améliorera parce que vous serez capable de repérer le point de déclenchement exact d'une nouvelle tendance ou d'une opportunité de scalping ! Cons
        ACTUELLEMENT 20% DE RÉDUCTION ! La meilleure solution pour tout débutant ou trader expert ! Cet indicateur est un outil de trading abordable car nous avons incorporé un certain nombre de caractéristiques exclusives ainsi qu'une nouvelle formule. L'Indicateur Avancé de Volume Accumulé de Devises est spécialisé pour les 28 principales paires Forex et fonctionne sur tous les cadres temporels. Il s'agit d'une nouvelle formule qui, sur un seul graphique, extrait tout le volume des devises (C-V
        My Trade History PRO
        Bernhard Schweigert
        5 (3)
        ACTUELLEMENT 20% DE RÉDUCTION ! ! La meilleure solution pour tout débutant ou trader expert ! Passer en revue vos transactions est la première étape d'un trader qui réussit. Les traders qui réussissent ont l'habitude de revoir régulièrement leurs performances de trading. Cet outil vous aidera à le faire. Le processus de révision sera plus efficace avec cet outil pour suivre votre trading. Analysez vos trades manuels ou les trades de votre EA. Utilisez les 3 vues générales. Pour passer
        My Trades in Pips
        Bernhard Schweigert
        4.71 (24)
        Un outil de trading que vous ne voulez pas manquer. L'indicateur affiche toutes les transactions/opérations dans le graphique avec le symbole auquel il est attaché. Il imprime le nombre de pips en profit ou en perte. Par choix, il imprime une ligne verticale à travers les sous-fenêtres pour une meilleure analyse. Consultez également la version PRO ici : My Trade History PRO https://www.mql5.com/en/market/product/50206 Il ajoute également les informations sur le résultat total des transactio
        FREE
        ACTUELLEMENT 26% DE RÉDUCTION ! !! Cet indicateur est une super combinaison de nos deux indicateurs principaux ( Advanced Currency Strength 28   &  Advanced Currency IMPULSE with ALERT ). Il montre les valeurs de force de la devise pour les TICK-UNITS et les signaux d'alerte pour 28 paires Forex. 11 unités de tic-tac différentes peuvent être utilisées. Ce sont 1, 2, 3, 4, 5, 6, 10, 12, 15, 20 et 30 secondes. La barre de Tick-Unit dans la sous-fenêtre sera affichée et déplacée vers la gauche l
        Filtrer:
        Ely Alsedy
        3018
        Ely Alsedy 2024.03.15 09:56 
         

        it's a great tool to use for assessing the market zones and make a decision also very good to spot fake outs i love to use it with Demark channel or another channel indicator the support and the author gets a THUMBS UP from me

        Claudio Jones
        167
        Claudio Jones 2024.01.28 21:50 
         

        I bought it today at first very promising, light and well built indicator. In the backtest, the reversal arrows work very well in conjunction with the alerts. Everything working perfectly.

        update 08/03/24 - without a doubt it remains an excellent indicator. I'm not a trader yet, but in the future I will become a professional trader. Thanks Bernhard!!!

        Heyneke
        45
        Heyneke 2023.11.09 20:25 
         

        Insanely accurate indicator ! Took the time to study the logic and settings behind the indicator. Strongly doubt you’ll find better on the market. Thanks a mil

        Alexander Berger
        231
        Alexander Berger 2023.11.05 15:58 
         

        Great indicator

        Dedre Du Plessis
        245
        Dedre Du Plessis 2023.03.14 11:22 
         

        This is by far the best supply and demand indicator I have used. It takes some time to test and find the settings that will work best with your own trading style, but once you have it, it is gold. Everyone should remember, this is an indicator, it will INDICATE, but you still need to put in your own work and make sure that the zones fit your trading rules. Thank you for a great indicator, Bernhard.

        [Supprimé] 2022.10.11 13:13 
         

        L'utilisateur n'a laissé aucun commentaire sur la note

        Bernhard Schweigert
        80408
        Réponse du développeur Bernhard Schweigert 2023.11.05 17:46
        A new version of all MT5 products was released this week. A free update is available to you.
        Md Jewel Khan
        243
        Md Jewel Khan 2022.03.05 01:21 
         

        Main issue, it's an eye wash and take your money. 5 activations only when you set up windows, then each time same pc same account gone 1 Activision. After that, they said buy again and owner big drama actor. They can't help because when you buy they get money again. Chart higher timeframe resistant and pvt nothing work. it's just never 1 or 3 candle then comeback and broken as always. Unless to waste your money and don't buy. Same type out markate some software. Here most feedback free. Owner also send email write a good review then he will discount. He is a big cheater.

        Bernhard Schweigert
        80408
        Réponse du développeur Bernhard Schweigert 2022.03.05 09:13
        You must have me confused with someone else. Your accusations are not true. This is how all mql5 products work. Therefore write to Metaquotes, not to me.
        The MQL5 license gives you the possibility to use the indicator for all (unlimited) MT4 accounts on your computer. For this you need only 1 activation. It is practical and simple.
        About the break of zones: yes zones break, this is the market, especially when there is a strong trend as we have it now with the Ukraine crisis. Why not use the break alarm in this case?
        tarasovkc
        80
        tarasovkc 2022.02.09 12:46 
         

        Awesome

        Bernhard Schweigert
        80408
        Réponse du développeur Bernhard Schweigert 2022.02.09 17:16
        Thanks for the review! 👍
        Frank Paetsch
        6872
        Frank Paetsch 2022.01.24 10:51 
         

        Premium Indicator

        Bernhard Schweigert
        80408
        Réponse du développeur Bernhard Schweigert 2022.02.09 17:16
        Thanks for the feedback! 🙏👍
        Chukwuma Okoye
        967
        Chukwuma Okoye 2021.12.11 09:23 
         

        L'utilisateur n'a laissé aucun commentaire sur la note

        Bernhard Schweigert
        80408
        Réponse du développeur Bernhard Schweigert 2022.01.24 10:53
        Thanks for the review! 👍
        Narcisse DEDELISSA
        44
        Narcisse DEDELISSA 2021.07.29 20:41 
         

        J’aime bien cet indicateur, ça me trace automatiquement les zones Dynamiques, je n’ai plus à louper une zone, et ceci dans tous Timeframe. C’est cool!!!

        brightenmutswa
        25
        brightenmutswa 2021.06.30 16:06 
         

        i need help. purchased the indicator but i have a problem when i install it...it says installation failed..please help what should i do?

        Bernhard Schweigert
        80408
        Réponse du développeur Bernhard Schweigert 2021.06.30 16:21
        I will send you a Personal Message. Please check your MQL5 inbox.
        S070
        39
        S070 2021.02.17 22:38 
         

        Great indicator! Works very well. Recommend it to every trader. You buy value for your money.

        G4U FMD
        785
        G4U FMD 2020.12.20 18:51 
         

        This a great indicator if your strategy is based on Supply and Demand level. Bernhard is very helpful to advisor programming, which allows to create, test and finally get a great tool for trading. Отличный индикатор для стратегии торговли по уровням. Использую в реальной торговле с помощью советника, написанного на базе этого индикатора.

        elvisgonya
        134
        elvisgonya 2020.11.04 11:58 
         

        Best A&D, already recovered the money I spent. continue doing great you will go far

        CaesarX
        319
        CaesarX 2020.09.23 12:21 
         

        Perfect for setting TP and floating SL's by, take a bit of time to fully understand how supply and demand areas work, fake break outs etc but this will soon be an integral tool in your arsenal that you won't be able to go without.

        Ezzy28
        42
        Ezzy28 2019.11.17 11:24 
         

        Best supply and demand indicator ever

        Ositadinma Onyeugwo
        233
        Ositadinma Onyeugwo 2019.02.23 15:56 
         

        This is a great tool. Useful for TP and SL levels. Combined with the other indicators by Bernhard, that's a winning strategy.

        Répondre à l'avis
        Version 6.9 2024.03.08
        We've just released an exciting update for our indicator, packed with enhancements that take your trading to the next level.

        Upgrading your indicator is a smart move. It ensures you're leveraging the latest features, giving you a competitive edge in the market. Don't miss out!

        Should you have questions or need help with the update, our team is here for you. Reach out anytime; we're committed to your success.

        www.CurrencyStrength28.com
        Version 5.8 2023.03.03
        We are proud to announce that our Supply and Demand Zone Indicator continues to be the highest rated tool of its kind in the market. Our team has worked hard to develop and refine this powerful tool, and we believe it will help you identify profitable trading opportunities with greater accuracy.
        With the recent release of the new Metatrader version, we have made various improvements to ensure that our software continues to integrate seamlessly with this popular trading platform. These changes include performance enhancements, so you can expect even smoother and more reliable performance from our indicators.
        Version 5.3 2022.10.11
        Added more improvements.
        Updating is recommended.
        Various improvements for new Metatrader version.
        Version 4.3 2021.11.24
        Various improvements for new Metatrader version.
        Another bridge for EA import has been added.
        Version 3.5 2020.12.01
        MAJOR UPDATE 2020 SERIES
        ==================

        The new update brings many new features:
        1) MODIFICATION FOR ZONE SIZE (optional)

        Some traders of supply and demand zones asked for a new function. It was added optionally: Including a wick for the width of the supply and demand zones.

        New input:
        + Include wick 1 for the zone size
        By default, the function is not used. To use the function, you must set the new input = true (the selection is also copied to the higher time frame).
        Since the zones will be wider, some zones could be filtered. You may want to use lower XY factors.

        2) Some traders of supply and demand zones requested a new function. It was added optionally: Draw supply and demand zones only at major highs and lows.

        New input:
        + use only major highs and lows
        By default, the function is not used. To use the function, you must set the new input = true. (The choice will be copied to the higher timeframe as well.
        To show all zones at highs and lows you might want to set all XY-factors = 1.0, but it can be combined.)

        ==================

        3) Added optional: Supply and Demand zones with ENGULFING BARS pattern at the beginning of the zone.
        Use reversal candle color for bar 1 or bar 2 (the one before). Use either ones or both.
        Use true engulfing pattern for above mentioned bars. (Must choose above.)

        By default the use is false. To use the function you must set the new inputs = true.

        New inputs:
        ==== Candle pattern
        + use reversal candle color bar 1
        + use reversal candle color bar 2 (both or either)
        + use true engulfing pattern (choose above)
        Version 3.3 2020.11.17
        Various improvements.
        Version 3.2 2020.08.21
        Various improvements.
        Version 3.1 2020.08.18
        Fixed an issue with show old zones and number of broken Sup/Dem in a row.
        Version 3.0 2020.02.12
        Added zone size info in point.
        It will show in the right corner of the rectangles. The size of the higher timeframe is shifted a few bars to the left.

        New inputs:
        === Chart settings
        + show zone size (point)
        + show zone size MTF (point)

        associated inputs:
        + color price labels
        === other settings
        + font size zone
        + Label font 1
        Version 2.90 2019.10.20
        update according to last MT4 version 2.90

        1) A new alert for a fake (or false) breakout has been added with several variables:
        new inputs:
        ==== FBO Alert settings
        + Alert Fake Breakout (FBO)
        + FBO min bar Size Point
        + FBO bar closes back % (20-90)
        + FBO pattern bar count (1-3)

        2) For old zones a new candle limit was added. If there is a strong trend, zones with only 2000 bars lookback may not be within range. Therefore, this limit has been increased to 5000. But so far we don't have to draw old zones. Therefore, a new limit has been added for old zones with 1000 bars.
        new input:
        + Show Bars back for old zones

        3) Now you can edit the size for arrow as requested by trader.
        new input:
        + reverse candle arrow size (1 to 5)

        4) Added room in points for HIT-alert. Now the trader can receive an earlier alert when price is NEAR a zone. Then he can take action or watch. This input should be applied according to the symbol and timeframe. The trader can make it bigger to suit his needs. The default value is 5 points. (10 point = 1 pip.)
        new input:
        + room in points for HIT-alert
        Version 2.40 2018.12.10
        Optimized XY-filter for higher timeframe MTF.
        To make sure the higher timeframe filters out weak S/D zones the same way as the lower timeframe (chart) does.
        Also you can setup different values for each timeframe.
        Default values are now set to:
        + min X-factor of price travel away (ATR) = 1.4
        + min Y-factor of price travel away (zone size) = 2
        Version 2.30 2018.11.05
        New features added!

        Added an optional filter to alert only nested zones. (The lower timeframe zone must be within a higher timeframe zone.)
        It applies to all 3 actual alerts (hit - reverse - break).
        If turned off the alerts will still tell if the alerted zone was nested or not.
        New input:
        + alert only NESTED zones! (within MTF)

        Added an optional pause in seconds for less CPU use. (Set to 0 to turn it off) At least on each new candle new zones will be checked.
        New input:
        + pause runs in seconds to next update (for less CPU use) (0=not)
        Version 2.10 2018.10.02
        Added XY-filter for higher timeframe.
        If you want the higher timeframe to show like before set XY-filter MTF = 1.0

        New input parameters:
        ==== MTF settings
        + min HTF!-candles before a zone is printed
        + min X-factor of price travel away (ATR) MTF
        + min Y-factor of price travel away (zone size) MTF

        Added pre-name for objects. In case you want to use the indicator twice on a chart, enter here a letter for the 2nd.

        New input parameters:
        ==== other settings
        + prename for additional objects
        Version 2.0 2018.09.24
        Final upgrade with faster calculations.

        + added "usePIN" for developments (Global variables)
        Gives access to all 5 supply and demand zones (outer price, inner price, is used or not, timeframe, symbol).
        Version 1.20 2018.09.23
        Optimized the main function and made equations faster.