
Other classes in DoEasy library (Part 70): Expanding functionality and auto updating the chart object collection

Contents
- Concept
- Improving library classes
- Auto update of the collection class of chart objects and windows
- Test
- What's next?
Concept
In the previous article, I created the chart object collection. Now, each symbol chart opened in the terminal is represented by a chart object. Each chart object features a set of window objects containing window indicator objects. Any chart object has at least one window object — this is the main chart window. All the remaining indicator windows can be added to the chart window list and removed from it. I placed the entire object set in the chart object collection.
Detailed testing of the chart object collection from the previous article revealed some issues when adding new windows to the main chart window. I will fix them here. Besides, I will add the new functionality for chart objects — navigation within the symbol chart window, creating window screenshots, as well as saving and uploading templates to the chart.
In addition to the scheduled improvements, I am going to implement auto tracking of some events occurring to charts in the client terminal and to chart object windows — adding a new/removing an existing symbol chart (chart object), adding a new/removing an existing indicator window from the chart object, as well as adding a new/removing an existing indicator from the chart window.
Improving library classes
As usual, the file \MQL5\Include\DoEasy\Data.mqh receives the indices of new messages:
   MSG_CHART_OBJ_CHART_WINDOW,                        // Main chart window
   MSG_CHART_OBJ_CHART_SUBWINDOW,                     // Chart subwindow
   MSG_CHART_OBJ_CHART_SUBWINDOWS_NUM,                // Subwindows
   MSG_CHART_OBJ_INDICATORS_MW_NAME_LIST,             // Indicators in the main chart window
   MSG_CHART_OBJ_INDICATORS_SW_NAME_LIST,             // Indicators in the chart window
   MSG_CHART_OBJ_INDICATOR,                           // Indicator
   MSG_CHART_OBJ_INDICATORS_TOTAL,                    // Indicators
   MSG_CHART_OBJ_WINDOW_N,                            // Window
   MSG_CHART_OBJ_INDICATORS_NONE,                     // No indicators
   MSG_CHART_OBJ_ERR_FAILED_GET_WIN_OBJ,              // Failed to receive the chart window object
   MSG_CHART_OBJ_SCREENSHOT_CREATED,                  // Screenshot created
   MSG_CHART_OBJ_TEMPLATE_SAVED,                      // Chart template saved
   MSG_CHART_OBJ_TEMPLATE_APPLIED,                    // Template applied to chart

//--- CChartObjCollection
   MSG_CHART_COLLECTION_TEXT_CHART_COLLECTION,        // Chart collection
   MSG_CHART_COLLECTION_ERR_FAILED_CREATE_CHART_OBJ,  // Failed to create a new chart object
   MSG_CHART_COLLECTION_ERR_FAILED_ADD_CHART,         // Failed to add a chart object to the collection
   MSG_CHART_COLLECTION_ERR_CHARTS_MAX,               // Cannot open new chart. Number of open charts at maximum

  };
//+------------------------------------------------------------------+
and message texts corresponding to newly added indices:
   {"Главное окно графика","Main chart window"},
   {"Подокно графика","Chart subwindow"},
   {"Подокон","Subwindows"},
   {"Индикаторы в главном окне графика","Indicators in the main chart window"},
   {"Индикаторы в окне графика","Indicators in the chart window"},
   {"Индикатор","Indicator"},
   {"Индикаторов","Indicators total"},
   {"Окно","Window"},
   {"Отсутствуют","No indicators"},
   {"Не удалось получить объект-окно графика","Failed to get the chart window object"},
   {"Скриншот создан","Screenshot created"},
   {"Шаблон графика сохранён","Chart template saved"},
   {"Шаблон применён к графику","Template applied to the chart"},

//--- CChartObjCollection
   {"Коллекция чартов","Chart collection"},
   {"Не удалось создать новый объект-чарт","Failed to create new chart object"},
   {"Не удалось добавить объект-чарт в коллекцию","Failed to add chart object to collection"},
   {"Нельзя открыть новый график, так как количество открытых графиков уже максимальное","You cannot open a new chart, since the number of open charts is already maximum"},

  };
//+---------------------------------------------------------------------+
Since I am going to implement the additional functionality of chart objects including the ability to create screenshots and handle templates, we need to specify storage folders for screenshots and templates, as well as the default file name extension (which also means the format of the saved image file) for screenshots. Possible types of files available for saving screenshots are *.gif, *.png and *.bmp.
Add these new macro substitutions to \MQL5\Include\DoEasy\Defines.mqh:
//--- Data parameters for file operations
#define DIRECTORY                      ("DoEasy\\")               // Library directory for storing object folders
#define RESOURCE_DIR                   ("DoEasy\\Resource\\")     // Library directory for storing resource folders
#define SCREENSHOT_DIR                 ("DoEasy\\ScreenShots\\")  // Library directory for storing screenshot folders
#define TEMPLATE_DIR                   ("DoEasy\\")               // Library directory for storing template folders
#define FILE_EXT_GIF                   (".gif")                   // GIF image file name extension
#define FILE_EXT_PNG                   (".png")                   // PNG image file name extension
#define FILE_EXT_BMP                   (".bmp")                   // BMP image file name extension
#define SCREENSHOT_FILE_EXT            (FILE_EXT_PNG)             // Chart screenshot file format (extension: .gif, .png and .bmp can be used)
//--- Symbol parameters
The folders for storing screenshots and templates in the terminal are different.
Screenshots are saved to the folder (Terminal data folder)\MQL5\Files\
Templates are saved to (Terminal data folder)\ MQL5\Profiles\Templates\
Thus, adding specified macro substitutions to a file name makes storing library files more target-focused.
Screenshots are to be saved to \MQL5\Files\DoEasy\ScreenShots\, while templates are to be saved to MQL5\Profiles\Templates\DoEasy\.
To make saving screenshot files more convenient, implement the function in the file of service functions \MQL5\Include\DoEasy\Services\DELib.mqh. The function returns the file name consisting of the name of the program it is launched from, a prefix passed to the function parameters and a local PC time:
//+------------------------------------------------------------------+
//| Return the file name (program name+local time)                   |
//+------------------------------------------------------------------+
string FileNameWithTimeLocal(const string time_prefix=NULL)
  {
   string name=
     (
      MQLInfoString(MQL_PROGRAM_NAME)+"_"+time_prefix+(time_prefix==NULL ? "" : "_")+
      TimeToString(TimeLocal(),TIME_DATE|TIME_MINUTES|TIME_SECONDS)
     );
   ResetLastError();
   if(StringReplace(name," ","_")==WRONG_VALUE)
      CMessage::ToLog(DFUN,GetLastError(),true);
   if(StringReplace(name,":",".")==WRONG_VALUE)
      CMessage::ToLog(DFUN,GetLastError(),true);
   return name;
  }
//+------------------------------------------------------------------+
The string in the function consists of a program name + a passed value in the function parameters + local PC time in the format Date/Hours-Minutes/Seconds. Then all spaces are replaced with underscores (_), while all colons are replaced with periods (.) and the resulting string is returned. If the replacements have not been activated, display the appropriate messages in the journal.
The function returns the same file name within a second. I.e. if the function is called several times per second, it always returns the same string within that second. Therefore, here we implement a function input allowing passing additional file data to make its identification unique and more informative.
We are able to specify coordinates in pixels for each chart window. These coordinates correspond to time/price coordinates using ChartXYToTimePrice(). Beside, we can perform reverse transformation using ChartTimePriceToXY(). Let's add this functionality to the objects. The first function is to work in the chart object, while the second one — in the chart window object. The ChartXYToTimePrice() function features the subwindow index containing the cursor. The index is returned by a link from the function. This works in any chart window. The window index containing the cursor is set in the variable that we embed into the function parameters when calling that function. On the contrary, an index of the window, whose price/time coordinates we need to obtain from the window screen coordinates, should be manually passed to the second function for transforming time and price in the chart window to the appropriate screen coordinates in pixels. It is more reasonable to place the function (i.e. the method to work with it) in the chart window object to get the appropriate coordinates from it.
In the private class section in \MQL5\Include\DoEasy\Objects\Chart\ChartWnd.mqh, add variables for storing the cursor coordinates in the window:
//+------------------------------------------------------------------+
//| Chart window object class                                        |
//+------------------------------------------------------------------+
class CChartWnd : public CBaseObj
  {
private:
   CArrayObj         m_list_ind;                                        // Indicator list
   int               m_window_num;                                      // Subwindow index
   int               m_wnd_coord_x;                                     // The X coordinate for the time on the chart in the window
   int               m_wnd_coord_y;                                     // The Y coordinates for the price on the chart in the window
//--- Return the flag indicating the presence of an indicator from the list in the window
   bool              IsPresentInWindow(const CWndInd *ind);
//--- Remove indicators not present in the window from the list
   void              IndicatorsDelete(void);
//--- Add new indicators to the list
   void              IndicatorsAdd(void);
//--- Set a subwindow index
   void              SetWindowNum(const int num)                        { this.m_window_num=num;   }

public:
In the public section of the class, declare the method converting the chart coordinates from the time/price representation to the X and Y coordinates and write the two methods returning the already obtained coordinates to the variables, as well as method returning the relative Y coordinate in the window:
//--- Update data on attached indicators
   void              Refresh(void);

//--- Convert the coordinates of a chart from the time/price representation to the X and Y coordinates
   bool              TimePriceToXY(const datetime time,const double price);
//--- Return X and Y coordinates of the cursor location in the window
   int               XFromTimePrice(void)                         const { return this.m_wnd_coord_x;  }
   int               YFromTimePrice(void)                         const { return this.m_wnd_coord_y;  }
//--- Return the relative Y coordinate of the cursor location in the window
   int               YFromTimePriceRelative(void)  const { return this.m_wnd_coord_y-this.YDistance();}

  };
//+------------------------------------------------------------------+
Since the values of Y coordinates in all windows are specified from the start of the coordinates (the upper left corner of the chart main window), we need to subtract the distance from the upper edge of the window from the Y coordinate to get the coordinate relative to the upper window border. We do this in the last method.
In the initialization list of the parametric class constructor, initialize new variables using the default values:
//+------------------------------------------------------------------+
//| Parametric constructor                                           |
//+------------------------------------------------------------------+
CChartWnd::CChartWnd(const long chart_id,const int wnd_num) : m_window_num(wnd_num),
                                                              m_wnd_coord_x(0),
                                                              m_wnd_coord_y(0)
  {
   CBaseObj::SetChartID(chart_id);
   this.IndicatorsListCreate();
  }
//+------------------------------------------------------------------+
Beyond the class body, implement the method converting the chart coordinates from the time/price representation to the X and Y axis coordinates:
//+------------------------------------------------------------------+
//| Convert chart coordinates from the time/price representation     |
//| to X and Y coordinates                                           |
//+------------------------------------------------------------------+
bool CChartWnd::TimePriceToXY(const datetime time,const double price)
  {
   ::ResetLastError();
   if(!::ChartTimePriceToXY(this.m_chart_id,this.m_window_num,time,price,this.m_wnd_coord_x,this.m_wnd_coord_y))
     {
      //CMessage::ToLog(DFUN,::GetLastError(),true);
      return false;
     }
   return true;
  }
//+------------------------------------------------------------------+
Here we simply return the result of the ChartTimePriceToXY() function operation by passing all the necessary values to it. I have commented out the error message in the log since we get too many of these messages in the journal in case the cursor is located outside the chart field but within the chart window.
The method writes the obtained result to the newly added variables for storing them, while the XFromTimePrice() and YFromTimePrice() methods return the variable values. Thus, we should first call the TimePriceToXY() method. After it returns true, we can receive the value of the necessary coordinate.
Let's improve the method for updating data on indicators attached to the window. In order to avoid constant recreation of the indicator list, we first compare the number of indicators in the window with their number in the list. If there are any changes, recreate the indicator list:
//+------------------------------------------------------------------+
//| Update data on attached indicators                               |
//+------------------------------------------------------------------+
void CChartWnd::Refresh(void)
  {
   int change=::ChartIndicatorsTotal(this.m_chart_id,this.m_window_num)-this.m_list_ind.Total();
   if(change!=0)
     {
      this.IndicatorsDelete();
      this.IndicatorsAdd();
     }
  }
//+------------------------------------------------------------------+
Improve the chart object class in \MQL5\Include\DoEasy\Objects\Chart\ChartObj.mqh. In the previous article, I arranged the WindowsTotal() method so that we can get the value from the environment and set it to the object properties after a single call. However, this turned out to be not very practical in terms of code logic construction clarity and the number of references to the environment, so I decided to abandon this idea. Now the method simply returns the object property value:
int WindowsTotal(void) const { return (int)this.GetProperty(CHART_PROP_WINDOWS_TOTAL); }
The value from the environment is to be set to an object property where it is really necessary.
The chart object will receive the remaining additional functionality scheduled for the current article: navigating the chart, creating chart screenshots, working with chart templates and converting chart X and Y coordinates to the time and price values.
Include the CSelect class file to the CChartObj class file:
//+------------------------------------------------------------------+
//|                                                     ChartObj.mqh |
//|                                  Copyright 2021, MetaQuotes Ltd. |
//|                             https://mql5.com/en/users/artmedia70 |
//+------------------------------------------------------------------+
#property copyright "Copyright 2021, MetaQuotes Ltd."
#property link      "https://mql5.com/en/users/artmedia70"
#property version   "1.00"
#property strict    // Necessary for mql4
//+------------------------------------------------------------------+
//| Include files                                                    |
//+------------------------------------------------------------------+
#include "..\..\Objects\BaseObj.mqh"
#include "..\..\Services\Select.mqh"
#include "ChartWnd.mqh"
//+------------------------------------------------------------------+
It is used to sort out the list of chart objects by their properties.
In the private section of the class, add two new class member variables for storing time for the X coordinate and the price for the Y coordinate on the chart:
//+------------------------------------------------------------------+
//| Chart object class                                               |
//+------------------------------------------------------------------+
class CChartObj : public CBaseObj
  {
private:
   CArrayObj         m_list_wnd;                                  // List of chart window objects
   long              m_long_prop[CHART_PROP_INTEGER_TOTAL];       // Integer properties
   double            m_double_prop[CHART_PROP_DOUBLE_TOTAL];      // Real properties
   string            m_string_prop[CHART_PROP_STRING_TOTAL];      // String properties
   int               m_digits;                                    // Symbol's Digits()
   datetime          m_wnd_time_x;                                // Time for X coordinate on the windowed chart
   double            m_wnd_price_y;                               // Price for Y coordinate on the windowed chart
Here, in the private class section, declare the method adding an extension to the screenshot file if it is missing:
//--- Create the list of chart windows
   void              CreateWindowsList(void);
//--- Add an extension to the screenshot file if it is missing
   string            FileNameWithExtention(const string filename);

public:
Declare the new methods at the end of the class body listing:
//--- Return the flag indicating that the chart object belongs to the program chart
   bool              IsMainChart(void)                               const { return(this.m_chart_id==CBaseObj::GetMainChartID());            }
//--- Return the chart window specified by index
   CChartWnd        *GetWindowByIndex(const int index)               const { return this.m_list_wnd.At(index);                               }
//--- Return the window object by its subwindow index
   CChartWnd        *GetWindowByNum(const int win_num)               const;
//--- Return the window object by the indicator name in it
   CChartWnd        *GetWindowByIndicator(const string ind_name)     const;

//--- Display data of all indicators of all chart windows in the journal
   void              PrintWndIndicators(void);
//--- Display the properties of all chart windows in the journal
   void              PrintWndParameters(void);

//--- Shift the chart by the specified number of bars relative to the specified chart position
   bool              Navigate(const int shift,const ENUM_CHART_POSITION position);
//--- Shift the chart (1) to the left and (2) to the right by the specified number of bars
   bool              NavigateLeft(const int shift);
   bool              NavigateRight(const int shift);
//--- Shift the chart (1) to the beginning and (2) to the end of the history data
   bool              NavigateBegin(void);
   bool              NavigateEnd(void);

//--- Create the chart screenshot
   bool              ScreenShot(const string filename,const int width,const int height,const ENUM_ALIGN_MODE align);
//--- Create the screenshot of the (1) chart window, (2) 800х600 and (3) 750х562 pixels
   bool              ScreenShotWndSize(const string filename=NULL,const ENUM_ALIGN_MODE align=ALIGN_CENTER);
   bool              ScreenShot800x600(const string filename=NULL,const ENUM_ALIGN_MODE align=ALIGN_CENTER);
   bool              ScreenShot750x562(const string filename=NULL,const ENUM_ALIGN_MODE align=ALIGN_CENTER);

//--- Save the chart template with the current settings
   bool              SaveTemplate(const string filename=NULL);
//--- Apply the specified template to the chart
   bool              ApplyTemplate(const string filename=NULL);

//--- Convert X and Y chart window coordinates into time and price
   int               XYToTimePrice(const long x,const double y);
//--- Return (1) time and (2) price from XY coordinates
   datetime          TimeFromXY(void)                                const { return this.m_wnd_time_x;   }
   double            PriceFromXY(void)                               const { return this.m_wnd_price_y;  }

  };
//+------------------------------------------------------------------+
In the initialization list of the paramteric constructor, initialize new class member variables using the default values:
//+------------------------------------------------------------------+
//| Parametric constructor                                           |
//+------------------------------------------------------------------+
CChartObj::CChartObj(const long chart_id) : m_wnd_time_x(0),m_wnd_price_y(0)
  {
  }
Let's consider the implementation of new methods.
The method returning the window object by an indicator name in it:
//+------------------------------------------------------------------+
//| Return the window object by the indicator name in it             |
//+------------------------------------------------------------------+
CChartWnd *CChartObj::GetWindowByIndicator(const string ind_name) const
  {
   int index=(this.m_program==PROGRAM_INDICATOR && ind_name==NULL ? ::ChartWindowFind() : ::ChartWindowFind(this.m_chart_id,ind_name));
   return this.GetWindowByIndex(index);
  }
//+------------------------------------------------------------------+
If the launched program based on the library is an indicator, call the ChartWindowFind() function without the parameters to let the indicator know what window it is launched in. If we need to find a window of another indicator, ChartWindowFind() should receive the ID of the chart whose window index is to be found by the indicator name.
Therefore, here we first check the type of the program, and if this is an indicator and NULL is passed as a name, call the ChartWindowFind() function without the parameters — this is a request from the indicator for searching a custom window.
Otherwise, call ChartWindowFind(), which receives the ID of the chart belonging to the chart object and an indicator short name passed to the method whose window index is to be found.
As a result, in order to return the window object the specified indicator is located in, we use the method returning the window object belonging to the chart object by the detected window index with the indicator.
The method shifting the chart by the specified number of bars relative to the specified chart position:
//+------------------------------------------------------------------+
//| Move the chart by the specified number of bars                   |
//| relative to the specified chart position                         |
//+------------------------------------------------------------------+
bool CChartObj::Navigate(const int shift,const ENUM_CHART_POSITION position)
  {
   ::ResetLastError();
   bool res=::ChartNavigate(m_chart_id,position,shift);
   if(!res)
      CMessage::ToLog(DFUN,::GetLastError(),true);
   return res;
  }
//+------------------------------------------------------------------+
The method simply calls the ChartNavigate() function with the shift parameters passed to the method — number of bars (shift) and chart position, relative to which the shift is performed (position). If the function execution is unsuccessful, the method displays the error message in the journal. Return the result of calling the ChartNavigate() function. Before calling the method, disable the auto scroll to the right edge of the chart for the chart object so that the method works correctly.
The method shifting the chart to the left by the specified number of bars:
//+------------------------------------------------------------------+
//| Shift the chart to the left by the specified number of bars      |
//+------------------------------------------------------------------+
bool CChartObj::NavigateLeft(const int shift)
  {
   this.SetAutoscrollOFF();
   return this.Navigate(shift,CHART_CURRENT_POS);
  }
//+------------------------------------------------------------------+
Here we first disable the auto scroll to the right edge of the chart for the chart object and return the Navigate() method operation result. The method receives the chart shift value (in bars) passed to the method.
Shift the chart from the current position.
The method shifting the chart to the right by the specified number of bars:
//+------------------------------------------------------------------+
//| Shift the chart to the right by the specified number of bars     |
//+------------------------------------------------------------------+
bool CChartObj::NavigateRight(const int shift)
  {
   this.SetAutoscrollOFF();
   return this.Navigate(-shift,CHART_CURRENT_POS);
  }
//+------------------------------------------------------------------+
Here we first disable the auto scroll to the right edge of the chart for the chart object and return the Navigate() method operation result. The method receives a negative chart shift value (in bars) passed to the method.
Shift the chart from the current position.
The method shifting the chart to the beginning of historical data:
//+------------------------------------------------------------------+
//| Shift the chart to the beginning of the history data             |
//+------------------------------------------------------------------+
bool CChartObj::NavigateBegin(void)
  {
   this.SetAutoscrollOFF();
   return this.Navigate(0,CHART_BEGIN);
  }
//+------------------------------------------------------------------+
Here we first disable the auto scroll to the right edge of the chart for the chart object and return the Navigate() method operation result. The method receives the zero chart shift value (in bars).
Shift the chart to the beginning of the history.
The method shifting the chart to the end of historical data (to the current time):
//+------------------------------------------------------------------+
//| Shift the chart to the end of the history data                   |
//+------------------------------------------------------------------+
bool CChartObj::NavigateEnd(void)
  {
   this.SetAutoscrollOFF();
   return this.Navigate(0,CHART_END);
  }
//+------------------------------------------------------------------+
Here we first disable the auto scroll to the right edge of the chart for the chart object and return the Navigate() method operation result. The method receives the zero chart shift value (in bars).
Shift the chart to the end of history — to the current time.
The method creating the chart screenshot:
//+------------------------------------------------------------------+
//| Create the chart screenshot                                      |
//+------------------------------------------------------------------+
bool CChartObj::ScreenShot(const string filename,const int width,const int height,const ENUM_ALIGN_MODE align)
  {
   ::ResetLastError();
   if(!::ChartScreenShot(m_chart_id,filename,width,height,align))
     {
      CMessage::ToLog(DFUN,::GetLastError(),true);
      return false;
     }
   return true;
  }
//+------------------------------------------------------------------+
The method receives the screenshot file name, width and height of an obtained image and the alignment (ENUM_ALIGN_MODE). The latter is needed to create vertical screenshots when the image height exceeds its width. In this case, the alignment specifies the edge of the chart the image is to be aligned with.
Here we simply take a screenshot with the parameters passed to the method using the ChartScreenShot() function.
If the screenshot is taken successfully, return true.
If failed to take a screenshot, display an appropriate message in the journal and return false.
The three methods creating screenshots of specified size are used as additional methods:
- screenshot fitting the chart window,
- screenshot 800х600,
- screenshot 750х562.
The second and third size are chosen for a reason — they are often required for publishing images on the MQL5.com forum, in articles and in Market product descriptions. The chart-fitting screenshot allows setting the appearance and size of the window directly in the terminal and take a screenshot of a required size.
The method creating a chart screenshot fitting the chart window resolution (including the price and time scales if they are present):
//+------------------------------------------------------------------+
//| Create the chart screenshot fitting the chart window resolution  |
//+------------------------------------------------------------------+
bool CChartObj::ScreenShotWndSize(const string filename=NULL,const ENUM_ALIGN_MODE align=ALIGN_CENTER)
  {
//--- Create the file name or use the one passed to the method
   string name=
     (filename==NULL || filename=="" ?
      SCREENSHOT_DIR+FileNameWithTimeLocal(this.Symbol()+"_"+TimeframeDescription(this.Timeframe()))+SCREENSHOT_FILE_EXT :
      this.FileNameWithExtention(filename)
     );
//--- Get the chart window having the largest number of all windows
   CChartWnd *wnd=this.GetWindowByNum(this.m_list_wnd.Total()-1);
   if(wnd==NULL)
     {
      ::Print(DFUN,CMessage::Text(MSG_CHART_OBJ_ERR_FAILED_GET_WIN_OBJ),string(this.m_list_wnd.Total()-1));
      return false;
     }
//--- Calculate the screenshot width and height considering the size of the price and time scales
   int width=this.WidthInPixels()+(IsShowPriceScale() ? 56 : 0);
   int height=wnd.YDistance()+wnd.HeightInPixels()+(this.IsShowDateScale() ? 15 : 0);
//--- Create a screenshot and return the result of the ScreenShot() method
   bool res=this.ScreenShot(name,width,height,align);
   if(res)
      ::Print(DFUN,CMessage::Text(MSG_CHART_OBJ_SCREENSHOT_CREATED),": ",name," (",(string)width," x ",(string)height,")");
   return res;
  }
//+------------------------------------------------------------------+
The method listing features the comments describing the logic in detail. In short, if NULL is passed to the method when creating a name, create the file name consisting of the path to the library screenshot files, the program name and an extension specified in Defines.mqh by default. If the file name passed to the method is not empty, use the FileNameWithExtention() method (to be described later) to check the presence of an extension in the file name (screenshots may have one of three extensions: .gif, .png and .bmp) and add an extension to the file name if it is not present.
To calculate the screenshot size considering all windows belonging to the chart, we need to find a window with the largest index (0 — main chart window, 1, 2, 3, N — all windows open in it from top to bottom). In other words, the lowest window will have the highest number. Knowing the distance from the top edge of the main chart window to the top edge of the bottommost window open on the chart, we get a reference point, to which we need to add the height of this window. Thus, we obtain the full height of the entire chart. We just have to check the presence of the time scale on the chart. If the scale is present, add 15 pixels to the calculated height (the size has been chosen on a trial basis). If there is no scale, add nothing. This is how we find the height of the future screenshot.
The case is a bit easier with the screenshot width — get the width of the chart object and add 56 pixels to it in case the chart has the price scale. If there is no scale, add nothing. The price scale size was set on a trial basis as well.
On screens having different resolutions, the size of price and time scales may differ. I have not had the opportunity to experiment with different monitors and their resolutions. Anyway, the size of scales added to the screenshot size do not introduce considerable errors in the appearance of the image.
The method creating the chart screenshot of 800x600 pixels:
//+------------------------------------------------------------------+
//| Create the chart screenshot of 800x600 pixels                    |
//+------------------------------------------------------------------+
bool CChartObj::ScreenShot800x600(const string filename=NULL,const ENUM_ALIGN_MODE align=ALIGN_CENTER)
  {
   string name=
     (filename==NULL || filename=="" ?
      SCREENSHOT_DIR+FileNameWithTimeLocal(this.Symbol()+"_"+TimeframeDescription(this.Timeframe()))+SCREENSHOT_FILE_EXT :
      this.FileNameWithExtention(filename)
     );
   int width=800;
   int height=600;
   bool res=this.ScreenShot(name,width,height,align);
   if(res)
      ::Print(DFUN,CMessage::Text(MSG_CHART_OBJ_SCREENSHOT_CREATED),": ",name," (",(string)width," x ",(string)height,")");
   return res;
  }
//+------------------------------------------------------------------+
Here all is simpler than in the above method. The file name is created the same way as in the previous method, and the file size is hard-coded here. The size is passed to the ScreenShot() method and its result is returned.
The method creating the chart screenshot of 750x562 pixels:
//+------------------------------------------------------------------+
//| Create the chart screenshot of 750x562 pixels                    |
//+------------------------------------------------------------------+
bool CChartObj::ScreenShot750x562(const string filename=NULL,const ENUM_ALIGN_MODE align=ALIGN_CENTER)
  {
   string name=
     (filename==NULL || filename=="" ?
      SCREENSHOT_DIR+FileNameWithTimeLocal(this.Symbol()+"_"+TimeframeDescription(this.Timeframe()))+SCREENSHOT_FILE_EXT :
      this.FileNameWithExtention(filename)
     );
   int width=750;
   int height=562;
   bool res=this.ScreenShot(name,width,height,align);
   if(res)
      ::Print(DFUN,CMessage::Text(MSG_CHART_OBJ_SCREENSHOT_CREATED),": ",name," (",(string)width," x ",(string)height,")");
   return res;
  }
//+------------------------------------------------------------------+
The method is similar to the one for creating a screenshot of 800х600 pixels except for the image size.
Any chart with all its settings, indicators and EA can be saved as a template to be applied to other charts later. We will have two methods — for saving the chart template and applying a specified template to the chart described by the chart object.
The method saving the chart template with the current settings:
//+------------------------------------------------------------------+
//| Save the chart template with the current settings                |
//+------------------------------------------------------------------+
bool CChartObj::SaveTemplate(const string filename=NULL)
  {
   ::ResetLastError();
   string name=
     (filename==NULL || filename=="" ?
      TEMPLATE_DIR+::MQLInfoString(MQL_PROGRAM_NAME) :
      filename
     );
   if(!::ChartSaveTemplate(this.m_chart_id,name))
     {
      CMessage::ToLog(DFUN,::GetLastError(),true);
      return false;
     }
   ::Print(DFUN,CMessage::Text(MSG_CHART_OBJ_TEMPLATE_SAVED),": ",this.Symbol()," ",TimeframeDescription(this.Timeframe()));
   return true;
  }
//+------------------------------------------------------------------+
The method passes the file name to be used when saving the template. If the name is empty (by default), it is made of the path (predetermined in Defines.mqh) and a program name.
If the template file is saved successfully, the appropriate entry is made in the journal specifying the chart (symbol and timeframe), whose template was saved, and true is returned. If failed to save the template, the appropriate message is sent to the journal as well and the method returns false.
The method applying the specified template to the chart:
//+------------------------------------------------------------------+
//| Apply the specified template to the chart                        |
//+------------------------------------------------------------------+
bool CChartObj::ApplyTemplate(const string filename=NULL)
  {
   ::ResetLastError();
   string name=
     (filename==NULL || filename=="" ?
      TEMPLATE_DIR+::MQLInfoString(MQL_PROGRAM_NAME) :
      filename
     );
   if(!::ChartApplyTemplate(this.m_chart_id,name))
     {
      CMessage::ToLog(DFUN,::GetLastError(),true);
      return false;
     }
   ::Print(DFUN,CMessage::Text(MSG_CHART_OBJ_TEMPLATE_APPLIED),": ",this.Symbol()," ",TimeframeDescription(this.Timeframe()));
   return true;
  }
//+------------------------------------------------------------------+
The method is similar to the one saving the chart template. The template file name passed to the method or created automatically is used as well. Next, the template is applied to the chart and an entry informing of the operation result is displayed in the journal.
Keep in mind that if we apply the template featuring another EA to the current chart with a running EA, which called the method, the current EA is unloaded from the memory and no longer works. It is replaced with a new EA from the template. The method does not check the possibility of such a collision. Therefore, we need to monitor our templates and check the likelihood of replacing the current EA with the one that may be launched from the template applied to the chart.
The method converting the window chart X and Y coordinates into time and price values:
//+------------------------------------------------------------------------------+
//|Convert X and Y coordinates of the chart window into the time and price values|
//+------------------------------------------------------------------------------+
int CChartObj::XYToTimePrice(const long x,const double y)
  {
   int sub_window=WRONG_VALUE;
   ::ResetLastError();
   if(!::ChartXYToTimePrice(this.m_chart_id,(int)x,(int)y,sub_window,this.m_wnd_time_x,this.m_wnd_price_y))
     {
      //CMessage::ToLog(DFUN,::GetLastError(),true);
      return WRONG_VALUE;
     }
   return sub_window;
  }
//+------------------------------------------------------------------+
The ChartXYToTimePrice() function converts the X and Y coordinates on a chart to the time and price values. At the same time, the sub_window variable passed to it by the link receives the index of the subwindow, in which the chart X and Y coordinates the time and price should be returned for are located.
Based on that, the method returns the chart subwindow index: 0 — if the coordinates are located in the main chart window, 1,2,3 etc. — if the coordinates fall into the corresponding chart subwindow, -1 — if failed to calculate the coordinates. If the value obtained after calling the method is not -1, it is possible to receive the time and price using the TimeFromXY() and PriceFromXY() methods, which simply return the variables containing the time and price obtained by the ChartXYToTimePrice() function.
The method adding an extension to the screenshot file if it is missing:
//+------------------------------------------------------------------+
//| Add an extension to the screenshot file if it is missing         |
//+------------------------------------------------------------------+
string CChartObj::FileNameWithExtention(const string filename)
  {
   if(::StringFind(filename,FILE_EXT_GIF)>WRONG_VALUE || ::StringFind(filename,FILE_EXT_PNG)>WRONG_VALUE || ::StringFind(filename,FILE_EXT_BMP)>WRONG_VALUE)
      return filename;
   return filename+SCREENSHOT_FILE_EXT;
  }
//+------------------------------------------------------------------+
The method receives the verified string, in which we need to find the screenshot file extension. Since screenshot file formats are strictly defined and include only three types — GIF, PNG and BMP, then, if the string passed to the method features at least one substring with such an extension (i.e. the extension is already set), the method returns the string passed to it unchanged. Otherwise, the string receives the file name extension set by default in Defines.mqh. This is a .png file. The changed string is returned as a result.
About some issues detected when adding a new window to the chart:
during a detailed test, it was detected that when we add a new indicator in the window to the chart, its window appears (although we have not clicked ОК or Cancel yet). This window is immediately seen in the terminal as an already existing one. The library sees it and adds it to the chart object window list, while the indicator will no longer be present in the window. But if we click Cancel in the window of adding a new windowed indicator, the window will no longer be present in the list of the client terminal chart window. The library removes the window from the list during the next check.
To avoid such unnecessary actions and accidental access to an empty chart window, which does not exist in the client terminal, we need to make sure that the window has the indicator before adding the window to the list. If the indicator is present, add the window. If it is not, then the window is open but not added to the chart. It should be skipped.
Thus, the method for creating the chart window list will be improved:
//+------------------------------------------------------------------+
//| Create the list of chart windows                                 |
//+------------------------------------------------------------------+
void CChartObj::CreateWindowsList(void)
  {
   //--- Clear the chart window list
   this.m_list_wnd.Clear();
   //--- Get the total number of chart windows from the environment
   int total=(int)::ChartGetInteger(this.m_chart_id,CHART_WINDOWS_TOTAL);
   //--- In the loop by the total number of windows
   for(int i=0;i<total;i++)
     {
      //--- Create a new chart window object
      CChartWnd *wnd=new CChartWnd(this.m_chart_id,i);
      if(wnd==NULL)
         continue;
      //--- If the window index exceeds 0 (not the main chart window) and it still has no indicator,
      //--- remove the newly created chart window object and go to the next loop iteration
      if(wnd.WindowNum()!=0 && wnd.IndicatorsTotal()==0)
        {
         delete wnd;
         continue;
        }
      //--- If the object was not added to the list, remove that object
      this.m_list_wnd.Sort();
      if(!this.m_list_wnd.Add(wnd))
         delete wnd;
     }
   //--- If the number of objects in the list corresponds to the number of windows on the chart,
   //--- write that value to the chart object property
   //--- If the number of objects in the list does not correspond to the number of windows on the chart,
   //--- write the number of objects in the list to the chart object property.
   int value=int(this.m_list_wnd.Total()==total ? total : this.m_list_wnd.Total());
   this.SetProperty(CHART_PROP_WINDOWS_TOTAL,value);
  }
//+------------------------------------------------------------------+
The method logic is described in its listing in detail. The check for the necessity of adding a window that has not yet been created to the list is located in the highlighted code block. In other words, when adding a windowed indicator only, we may have a window that has not yet been created. Therefore, we do not analyze the window with the index 0. This is the main chart window and it is definitely present. Only new indicators can be added to it. If a new window without an indicator has been detected (which is impossible if the indicator window has already been added to the chart), then this is the window where we have not clicked OK yet to add it to the chart. Skip such a window to avoid adding it to the window list.
Upon completion of the entire loop, write the number of windows to the chart object property. Here we make sure that all windows have been successfully added to the list. If their real number is equal to the number in the list, this means all windows have been added — write the number of windows on the chart to the object property. If the numbers are not equal, the number present in the list is set in the property (it is not equal to the actual one), so that the next check shows the inequality again and we are able to add the created window to the list. If we click Cancel when adding a new window, the numbers of windows on the chart and in the list become equal and there is no need to handle any change.
This concludes the improvement of the library classes.
Auto update of the collection class of chart objects and windows
Now let's make sure that with any change in the number of open charts, in the number of windows on the charts and in the number of indicators in these windows, the library automatically updates all this data, so that we are not distracted by that, while always having the relevant data.
In \MQL5\Include\DoEasy\Objects\Chart\ChartObj.mqh of the chart object class, supplement the Refresh() method so that we are able to check not only the change in the number of open windows on the chart (in the chart object) but also manage the number of indicators in already open windows (one window fits several indicators).
The method updating the chart object and the list of its windows:
//+------------------------------------------------------------------+
//| Update the chart object and its window list                      |
//+------------------------------------------------------------------+
void CChartObj::Refresh(void)
  {
   for(int i=0;i<m_list_wnd.Total();i++)
     {
      CChartWnd *wnd=m_list_wnd.At(i);
      if(wnd==NULL)
         continue;
      wnd.Refresh();
     }
   int change=(int)::ChartGetInteger(this.m_chart_id,CHART_WINDOWS_TOTAL)-this.WindowsTotal();
   if(change==0)
      return;
   this.CreateWindowsList();
  }
//+------------------------------------------------------------------+
Before checking the changes in the number of open windows in the chart object, we first should move along the list of all object windows and call the update method for each subsequent window in the loop. The Refresh() method of the chart window object checks the change of the number of indicators placed in it and recreates their list when registering the changes.
In the collection class file of chart objects \MQL5\Include\DoEasy\Collections\ChartObjCollection.mqh, fix the logical error preventing us from updating the chart objects in the collection list and, accordingly, updating their windows and indicators in them.
Previously, the block of updating chart objects was located below the check for the changes in the number of open charts, which did not allow us to reach it in case there were no changes in the number of open charts:
//+------------------------------------------------------------------+
//| Update the collection list of chart objects                      |
//+------------------------------------------------------------------+
void CChartObjCollection::Refresh(void)
  {
   //--- Get the number of open charts in the terminal and
   int charts_total=this.ChartsTotal();
   //--- calculate the difference between the number of open charts in the terminal
   //--- and chart objects in the collection list. These values are displayed in the chart comment
   int change=charts_total-this.m_list.Total();
   Comment(DFUN,", list total=",DataTotal(),", charts total=",charts_total,", change=",change);
   //--- If there are no changes, leave
   if(change==0)
      return;
   //--- If a chart is added in the terminal
   if(change>0)
     {
      //--- Find the missing chart object, create and add it to the collection list
      this.FindAndCreateMissingChartObj();
      //--- Get the current chart and return to it since
      //--- adding a new chart switches the focus to it
      CChartObj *chart=this.GetChart(GetMainChartID());
      if(chart!=NULL)
         chart.SetBringToTopON(true);
     }
   //--- If a chart is removed in the terminal
   else if(change<0)
    {
     //--- Find an extra chart object in the collection list and remove it from the list
     this.FindAndDeleteExcessChartObj();
    }
   //--- In the loop by the number of chart objects in the list,
   for(int i=0;i<this.m_list.Total();i++)
     {
      //--- get the next chart object and
      CChartObj *chart=this.m_list.At(i);
      if(chart==NULL)
         continue;
      //--- update it
      chart.Refresh();
     }
  }
//+------------------------------------------------------------------+
The solution is quite trivial — simply move the chart object update code block higher — before checking the number of open charts in the client terminal:
//+------------------------------------------------------------------+
//| Update the collection list of chart objects                      |
//+------------------------------------------------------------------+
void CChartObjCollection::Refresh(void)
  {
   //--- In the loop by the number of chart objects in the list,
   for(int i=0;i<this.m_list.Total();i++)
     {
      //--- get the next chart object and
      CChartObj *chart=this.m_list.At(i);
      if(chart==NULL)
         continue;
      //--- update it
      chart.Refresh();
     }
   //--- Get the number of open charts in the terminal and
   int charts_total=this.ChartsTotal();
   //--- calculate the difference between the number of open charts in the terminal
   //--- and chart objects in the collection list. These values are displayed in the chart comment
   int change=charts_total-this.m_list.Total();
   //--- If there are no changes, leave
   if(change==0)
      return;
   //--- If a chart is added in the terminal
   if(change>0)
     {
      //--- Find the missing chart object, create and add it to the collection list
      this.FindAndCreateMissingChartObj();
      //--- Get the current chart and return to it since
      //--- adding a new chart switches the focus to it
      CChartObj *chart=this.GetChart(GetMainChartID());
      if(chart!=NULL)
         chart.SetBringToTopON(true);
     }
   //--- If a chart is removed in the terminal
   else if(change<0)
    {
     //--- Find an extra chart object in the collection list and remove it from the list
     this.FindAndDeleteExcessChartObj();
    }
  }
//+------------------------------------------------------------------+
Now, before checking the change in the number of open charts (and exiting the method if the number has not changed), we first loop through all chart objects in the collection list and check the changes of their window objects in their Refresh() method, in which their own Refresh() method is called, to check the number of indicators in the window. Thus, we first perform a complete check of all possible changes in the number of indicators in windows and in the number of indicators in charts checking the changes in the number of open charts afterwards.
Add the methods for opening a new chart and closing an already existing one to the chart object collection class.
In the public section of the class, declare two new methods:
//--- Update (1) the chart object collection list and (2) the specified chart object
   void                    Refresh(void);
   void                    Refresh(const long chart_id);

//--- (1) Open a new chart with the specified symbol and period, (2) close the specified chart
   bool                    Open(const string symbol,const ENUM_TIMEFRAMES timeframe);
   bool                    Close(const long chart_id);

  };
//+------------------------------------------------------------------+
Let's write their implementation outside the class body.
The method opening a new chart with the specified symbol and period:
//+------------------------------------------------------------------+
//| Open a new chart with the specified symbol and period            |
//+------------------------------------------------------------------+
bool CChartObjCollection::Open(const string symbol,const ENUM_TIMEFRAMES timeframe)
  {
   if(this.m_list.Total()==CHARTS_MAX)
     {
      ::Print(CMessage::Text(MSG_CHART_COLLECTION_ERR_CHARTS_MAX)," (",(string)CHARTS_MAX,")");
      return false;
     }
   ::ResetLastError();
   long chart_id=::ChartOpen(symbol,timeframe);
   if(chart_id==0)
      CMessage::ToLog(::GetLastError(),true);
   return(chart_id>0);
  }
//+------------------------------------------------------------------+
Here, if the number of chart objects in the collection exceeds the threshold one (CHARTS_MAX), an attempt to open a new chart will be useless. Inform of that and return false. Next, if we are still able to open a new chart, call the ChartOpen() function with the specified parameters of the opened chart. In case of an error, send an entry to the journal. Return the flag indicating that the function of opening a new chart has returned a non-zero value.
The method closing a specified chart:
//+------------------------------------------------------------------+
//| Close a specified chart                                          |
//+------------------------------------------------------------------+
bool CChartObjCollection::Close(const long chart_id)
  {
   ::ResetLastError();
   bool res=::ChartClose(chart_id);
   if(!res)
      CMessage::ToLog(DFUN,::GetLastError(),true);
   return res;
  }
//+------------------------------------------------------------------+
Here, if an attempt to close a chart specified by ID is unsuccessful, display the appropriate journal entry.
The method returns the result of the ChartClose() function.
In \MQL5\Include\DoEasy\Engine.mqh of the CEngine library main object, add the methods for managing the chart collection.
Two methods returning the chart object lists by symbol and timeframe
//--- Return the list of chart objects by (1) symbol and (2) timeframe
   CArrayObj           *ChartGetChartsList(const string symbol)                        { return this.m_charts.GetChartsList(symbol);         }
   CArrayObj           *ChartGetChartsList(const ENUM_TIMEFRAMES timeframe)            { return this.m_charts.GetChartsList(timeframe);      }
are renamed to match similar methods of other classes and moved a little higher in the listing:
//--- Current the chart collection
   bool                 ChartCreateCollection(void)                                    { return this.m_charts.CreateCollection();            }
//--- Return (1) the chart collection and (2) the list of charts from the chart collection
   CChartObjCollection *GetChartObjCollection(void)                                    { return &this.m_charts;                              }
   CArrayObj           *GetListCharts(void)                                            { return this.m_charts.GetList();                     }
//--- Return the list of chart objects by (1) symbol and (2) timeframe
   CArrayObj           *GetListCharts(const string symbol)                             { return this.m_charts.GetChartsList(symbol);         }
   CArrayObj           *GetListCharts(const ENUM_TIMEFRAMES timeframe)                 { return this.m_charts.GetChartsList(timeframe);      }
Add the method returning the chart object of the last open chart, the method returning the number of chart objects in the collection list and two methods for opening and closing the specified chart:
//--- Current the chart collection
   bool                 ChartCreateCollection(void)                                    { return this.m_charts.CreateCollection();            }
//--- Return (1) the chart collection and (2) the list of charts from the chart collection
   CChartObjCollection *GetChartObjCollection(void)                                    { return &this.m_charts;                              }
   CArrayObj           *GetListCharts(void)                                            { return this.m_charts.GetList();                     }
//--- Return the list of chart objects by (1) symbol and (2) timeframe
   CArrayObj           *GetListCharts(const string symbol)                             { return this.m_charts.GetChartsList(symbol);         }
   CArrayObj           *GetListCharts(const ENUM_TIMEFRAMES timeframe)                 { return this.m_charts.GetChartsList(timeframe);      }

//--- Return (1) the specified chart object, (2) the chart object with the program and (3) the chart object of the last open chart
   CChartObj           *ChartGetChartObj(const long chart_id)                          { return this.m_charts.GetChart(chart_id);            }
   CChartObj           *ChartGetMainChart(void)                                        { return this.m_charts.GetChart(this.m_charts.GetMainChartID());}
   CChartObj           *ChartGetLastOpenedChart(void)                                  { return this.m_charts.GetChart(this.GetListCharts().Total()-1);}

//--- Return the number of charts in the collection list
   int                  ChartsTotal(void)                                              { return this.m_charts.DataTotal();                   }

//--- Update (1) the chart specified by ID and (2) all charts
   void                 ChartRefresh(const long chart_id)                              { this.m_charts.Refresh(chart_id);                    }
   void                 ChartsRefreshAll(void)                                         { this.m_charts.Refresh();                            }

//--- (1) Open and (2) close the specified chart
   bool                 ChartOpen(const string symbol,const ENUM_TIMEFRAMES timeframe) { return this.m_charts.Open(symbol,timeframe);        }
   bool                 ChartClose(const long chart_id)                                { return this.m_charts.Close(chart_id);               }

//--- Return (1) the buffer collection and (2) the buffer list from the collection
The ChartGetLastOpenedChart() method simply returns the pointer to the very last object located in the chart object collection list, while the ChartsTotal() method returns the size of the chart object collection list.
The ChartOpen() and ChartClose() methods return the results of the Open() and Close() methods of the chart collection class accordingly.
These are all the changes and improvements I have planned for the current article.
Test
To perform the test, let's use the EA from the previous article and save it to \MQL5\Experts\TestDoEasy\Part70\ as TestDoEasyPart70.mq5.
What am I going to do? Add new buttons with the following icons to the EA panel:
- "<" and ">" — the button for shifting a chart by one bar to the left and right, respectively;
- "<<" and ">>" — the button for shifting a chart by ten bars to the left and right, respectively;
- "|<" and ">|" — the button for setting a chart at the beginning and at the end of history, respectively;
- "N" and "X" — the button for opening a new and closing the last open symbol chart, respectively;
- "[O]" — the button for creating a screenshot of the current chart with an EA.
The logic of testing a new functionality is as follows:
- When clicking the chart shifting buttons, the EA shifts the chart to the left and right by one bar and by 10 bars, respectively.
- When clicking the buttons for setting a chart at the beginning and at the end of history, the chart is set accordingly.
- When clicking the chart open button, the EA sequentially opens the charts of symbols set in the chart object collection list in the order they appear there, rather than in the Market Watch window (since sorting may be different in the Market Watch window).
In order to save and apply the chart template, the EA saves the template of the last open chart and applies it when a new chart is opened. In other words, if we open a new chart, for example GBPUSD, manually and configure its appearance to be different from the current one before clicking the button for opening a new chart, all subsequent charts will have the same appearance. To be more precise, the template with the appearance of the predefined chart will be applied to them after opening.
This means that in order to perform the test, we need to first open a new GBPUSD chart and configure its appearance. The saved template based on the manually configured GBPUSD chart will then be applied to all other charts opened by the EA. - When clicking the chart close button, the EA closes the very last of the open charts.
- By sequentially clicking the screenshot creation buttons, the EA will create chart screenshots:
sequentially in a circle in the following resolution: 800х600 --> 750x562 --> Current chart size.
In the EA's OnInit() handler, add the inclusion of the permission to track mouse events for the current chart:
//--- Check playing a standard sound by macro substitution and a custom sound by description
   engine.PlaySoundByDescription(SND_OK);
//--- Wait for 600 milliseconds
   engine.Pause(600);
   engine.PlaySoundByDescription(TextByLanguage("Звук упавшей монетки 2","Falling coin 2"));


//--- Check the calculation of the cursor coordinates in the chart windows.
//--- Allow the current chart to track mouse movement events
   engine.ChartGetMainChart().SetEventMouseMoveON();
//---
   return(INIT_SUCCEEDED);
  }
//+------------------------------------------------------------------+
This enables the program to receive messages about mouse button movement and pressing events (CHARTEVENT_MOUSE_MOVE).
Upon receiving a mouse movement event, we need to get the cursor coordinates on the chart in pixels in the OnChartEvent() handler, convert them into time, price and index of the window the cursor is located in using the created library methods and, finally, convert the newly obtained time and price back to the cursor coordinates on the chart and display all these values in the chart comment.
Write handling the cursor movement event:
//+------------------------------------------------------------------+
//| ChartEvent function                                              |
//+------------------------------------------------------------------+
void OnChartEvent(const int id,
                  const long &lparam,
                  const double &dparam,
                  const string &sparam)
  {
//--- If working in the tester, exit
   if(MQLInfoInteger(MQL_TESTER))
      return;
//--- Handling mouse events
   if(id==CHARTEVENT_OBJECT_CLICK)
     {
      //--- Handle pressing the buttons in the panel
      if(StringFind(sparam,"BUTT_")>0)
         PressButtonEvents(sparam);
     }
//--- Handling DoEasy library events
   if(id>CHARTEVENT_CUSTOM-1)
     {
      OnDoEasyEvent(id,lparam,dparam,sparam);
     }
//--- Check ChartXYToTimePrice()
   if(id==CHARTEVENT_MOUSE_MOVE)
     {
      //--- Get the chart object of the current (main) program chart
      CChartObj *chart=engine.ChartGetMainChart();
      if(chart==NULL)
         return;
      //--- Get the index of a subwindow the cursor is located at
      int wnd_num=chart.XYToTimePrice(lparam,dparam);
      if(wnd_num==WRONG_VALUE)
         return;
      //--- Get the calculated cursor location time and price
      datetime time=chart.TimeFromXY();
      double price=chart.PriceFromXY();
      //--- Get the window object of the chart the cursor is located in by the subwindow index
      CChartWnd *wnd=chart.GetWindowByNum(wnd_num);
      if(wnd==NULL)
         return;
      //--- If X and Y coordinates are calculated by time and price (make a reverse conversion),
      if(wnd.TimePriceToXY(time,price))
        {
         //--- in the comment, show the time, price and index of the window that are calculated by X and Y cursor coordinates,
         //--- as well as the cursor X and Y coordinates converted back from the time and price
         Comment
           (
            DFUN,"time: ",TimeToString(time),", price: ",DoubleToString(price,Digits()),
            ", win num: ",(string)wnd_num,": x: ",(string)wnd.XFromTimePrice(),
            ", y: ",(string)wnd.YFromTimePrice()," (",(string)wnd.YFromTimePriceRelative(),")")
           ;
        }
     }
  }
//+------------------------------------------------------------------+
The logic of handling a mouse movement event is described in the EA's OnChartEvent() code in detail.
In the EA's CreateButtons() function, add the code for creating new panel buttons:
//+------------------------------------------------------------------+
//| Create the buttons panel                                         |
//+------------------------------------------------------------------+
bool CreateButtons(const int shift_x=20,const int shift_y=0)
  {
   int h=18,w=82,offset=2,wpt=14;
   int cx=offset+shift_x+wpt*2+2,cy=offset+shift_y+(h+1)*(TOTAL_BUTT/2)+3*h+1;
   int x=cx,y=cy;
   int shift=0;
   for(int i=0;i<TOTAL_BUTT;i++)
     {
      x=x+(i==7 ? w+2 : 0);
      if(i==TOTAL_BUTT-6) x=cx;
      y=(cy-(i-(i>6 ? 7 : 0))*(h+1));
      if(!ButtonCreate(butt_data[i].name,x,y,(i<TOTAL_BUTT-6 ? w : w*2+2),h,butt_data[i].text,(i<4 ? clrGreen : i>6 && i<11 ? clrRed : clrBlue)))
        {
         Alert(TextByLanguage("Не удалось создать кнопку \"","Could not create button \""),butt_data[i].text);
         return false;
        }
     }

   h=18; offset=2;
   cx=offset+shift_x; cy=offset+shift_y+(h+1)*(TOTAL_BUTT/2)+3*h+1;
   x=cx; y=cy;
   shift=0;
   for(int i=0;i<18;i++)
     {
      y=(cy-(i-(i>6 ? 7 : 0))*(h+1));
      if(!ButtonCreate(butt_data[i].name+"_PRICE",((i>6 && i<14) || i>17 ? x+wpt*2+w*2+5 : x),y,wpt,h,"P",(i<4 ? clrGreen : i>6 && i<11 ? clrChocolate : clrBlue)))
        {
         Alert(TextByLanguage("Не удалось создать кнопку \"","Could not create button \""),butt_data[i].text+" \"P\"");
         return false;
        }
      if(!ButtonCreate(butt_data[i].name+"_TIME",((i>6 && i<14) || i>17 ? x+wpt*2+w*2+5+wpt+1 : x+wpt+1),y,wpt,h,"T",(i<4 ? clrGreen : i>6 && i<11 ? clrChocolate : clrBlue)))
        {
         Alert(TextByLanguage("Не удалось создать кнопку \"","Could not create button \""),butt_data[i].text+" \"T\"");
         return false;
        }
     }
   //--- Left and Right buttons
   int xbn=x+wpt*2+w*2+5;
   int ybn=y+h*3+3;
   if(!ButtonCreate(prefix+"BUTT_NAVIGATE_LEFT1",xbn,ybn,wpt,h,"<",clrGreen))
     {
      Alert(TextByLanguage("Не удалось создать кнопку \"","Could not create button \""),prefix+"BUTT_NAVIGATE_LEFT1");
      return false;
     }
   if(!ButtonCreate(prefix+"BUTT_NAVIGATE_RIGHT1",xbn+wpt+1,ybn,wpt,h,">",clrGreen))
     {
      Alert(TextByLanguage("Не удалось создать кнопку \"","Could not create button \""),prefix+"BUTT_NAVIGATE_RIGHT1");
      return false;
     }
   //--- Left 10 and Right 10 buttons
   ybn=y+h*2+2;
   if(!ButtonCreate(prefix+"BUTT_NAVIGATE_LEFT10",xbn,ybn,wpt,h,"<<",clrGreen))
     {
      Alert(TextByLanguage("Не удалось создать кнопку \"","Could not create button \""),prefix+"BUTT_NAVIGATE_LEFT10");
      return false;
     }
   if(!ButtonCreate(prefix+"BUTT_NAVIGATE_RIGHT10",xbn+wpt+1,ybn,wpt,h,">>",clrGreen))
     {
      Alert(TextByLanguage("Не удалось создать кнопку \"","Could not create button \""),prefix+"BUTT_NAVIGATE_RIGHT10");
      return false;
     }
   //--- Home and End buttons
   ybn=y+h+1;
   if(!ButtonCreate(prefix+"BUTT_NAVIGATE_HOME",xbn,ybn,wpt,h,"|<",clrGreen))
     {
      Alert(TextByLanguage("Не удалось создать кнопку \"","Could not create button \""),prefix+"BUTT_NAVIGATE_HOME");
      return false;
     }
   if(!ButtonCreate(prefix+"BUTT_NAVIGATE_END",xbn+wpt+1,ybn,wpt,h,">|",clrGreen))
     {
      Alert(TextByLanguage("Не удалось создать кнопку \"","Could not create button \""),prefix+"BUTT_NAVIGATE_END");
      return false;
     }
   //--- Open and Close buttons
   ybn=y;
   if(!ButtonCreate(prefix+"BUTT_CHART_OPEN",xbn,ybn,wpt,h,"N",clrBlue))
     {
      Alert(TextByLanguage("Не удалось создать кнопку \"","Could not create button \""),prefix+"BUTT_CHART_OPEN");
      return false;
     }
   if(!ButtonCreate(prefix+"BUTT_CHART_CLOSE",xbn+wpt+1,ybn,wpt,h,"X",clrRed))
     {
      Alert(TextByLanguage("Не удалось создать кнопку \"","Could not create button \""),prefix+"BUTT_CHART_CLOSE");
      return false;
     }
   //--- ScreenShot button
   ybn=y-h-1;
   if(!ButtonCreate(prefix+"BUTT_CHART_SCREENSHOT",xbn,ybn,wpt*2+offset,h,"[O]",clrBlue))
     {
      Alert(TextByLanguage("Не удалось создать кнопку \"","Could not create button \""),prefix+"BUTT_CHART_SCREENSHOT");
      return false;
     }

   ChartRedraw(0);
   return true;
  }
//+------------------------------------------------------------------+
Here all is simple: coordinates are calculated for each new button and the button is created using the ButtonCreate() function, which receives a name of a created graphical objects, its coordinates, width, height, caption and color. If failed to create the button, the alert is activated and false is returned. In the OnInit() handler, if the panel creation function returns false, exit with the INIT_FAILED return code.
In the PressButtonEvents() function for handling button clicks, add handling new button clicks:
//+------------------------------------------------------------------+
//| Handle pressing the buttons                                      |
//+------------------------------------------------------------------+
void PressButtonEvents(const string button_name)
  {
   bool comp_magic=true;   // Temporary variable selecting the composite magic number with random group IDs
   string comment="";
   //--- Convert button name into its string ID
   string button=StringSubstr(button_name,StringLen(prefix));
   //--- Random group 1 and 2 numbers within the range of 0 - 15
   group1=(uchar)Rand();
   group2=(uchar)Rand();
   uint magic=(comp_magic ? engine.SetCompositeMagicNumber(magic_number,group1,group2) : magic_number);
   //--- If the button is pressed
   if(ButtonState(button_name))
     {
      //--- If the button of shifting a chart 1 bar to the left is clicked
      if(button=="BUTT_NAVIGATE_LEFT1")
        {
         CChartObj *chart=engine.ChartGetMainChart();
         if(chart!=NULL)
            chart.NavigateLeft(1);
        }
      //--- If the button of shifting a chart 1 bar to the right is clicked
      if(button=="BUTT_NAVIGATE_RIGHT1")
        {
         CChartObj *chart=engine.ChartGetMainChart();
         if(chart!=NULL)
            chart.NavigateRight(1);
        }
      //--- If the button of shifting a chart 10 bars to the left is clicked
      if(button=="BUTT_NAVIGATE_LEFT10")
        {
         CChartObj *chart=engine.ChartGetMainChart();
         if(chart!=NULL)
            chart.NavigateLeft(10);
        }
      //--- If the button of shifting a chart 10 bars to the right is clicked
      if(button=="BUTT_NAVIGATE_RIGHT10")
        {
         CChartObj *chart=engine.ChartGetMainChart();
         if(chart!=NULL)
            chart.NavigateRight(10);
        }
      //--- If the button of shifting a chart to the start of history is clicked
      if(button=="BUTT_NAVIGATE_HOME")
        {
         CChartObj *chart=engine.ChartGetMainChart();
         if(chart!=NULL)
            chart.NavigateBegin();
        }
      //--- If the button of shifting a chart to the end of history is clicked
      if(button=="BUTT_NAVIGATE_END")
        {
         CChartObj *chart=engine.ChartGetMainChart();
         if(chart!=NULL)
            chart.NavigateEnd();
        }
      //--- If the new chart open button is pressed
      if(button=="BUTT_CHART_OPEN")
        {
         int total_charts=engine.ChartsTotal();
         static int first_index=total_charts;
         string name=SymbolName(total_charts-first_index,true);
         if(engine.ChartOpen(name,PERIOD_CURRENT))
           {
            engine.ChartsRefreshAll();
            CChartObj *chart=engine.ChartGetMainChart();
            if(chart!=NULL)
               chart.SetBringToTopON(true);
           }
         //--- This code block is needed only for the test and only if there is an open GBPUSD chart
         //--- GBPUSD chart settings should differ from that of charts opened by default
         CArrayObj *list_gbpusd=engine.GetListCharts("GBPUSD");
         if(list_gbpusd!=NULL && list_gbpusd.Total()>0)
           {
            CChartObj *chart=list_gbpusd.At(0);
            if(chart.SaveTemplate())
              {
               chart=engine.ChartGetLastOpenedChart();
               if(chart!=NULL)
                  chart.ApplyTemplate();
              }
           }
         //--- End of the test code block
        }
      //--- If the the last chart close button is pressed
      if(button=="BUTT_CHART_CLOSE")
        {
         CArrayObj *list_charts=engine.GetListCharts();
         if(list_charts!=NULL)
           {
            list_charts.Sort(SORT_BY_CHART_ID);
            CChartObj *chart=list_charts.At(list_charts.Total()-1);
            if(chart!=NULL && !chart.IsMainChart())
              engine.ChartClose(chart.ID());
           }
        }
      //--- If the ScreenShot button is pressed
      if(button=="BUTT_CHART_SCREENSHOT")
        {
         static int num=0;
         if(++num>3) num=1;
         CChartObj *chart=engine.ChartGetMainChart();
         if(chart!=NULL)
           {
            switch(num)
              {
               case 1 : chart.ScreenShot800x600(); break;
               case 2 : chart.ScreenShot750x562(); break;
               default: chart.ScreenShotWndSize(); break;
              }
           }
        }

      //--- If the 'BUTT_BUY: Open Buy position' is pressed
      if(button==EnumToString(BUTT_BUY))
        {
         ...
         ...
         ...
       ...
       ...
     ...
     ...
Rather than showing the entire function code, only added changes are displayed.
Here we simply handle clicking each new button. The logic is simple and there is no point in describing it. I will leave it for independent analysis, especially considering that this handler just serves as an example of how you can work with library methods in your programs. However, you are welcome to use the comments section if you have any questions related to the code.
These are all the improvements that I needed to do in the new test EA.
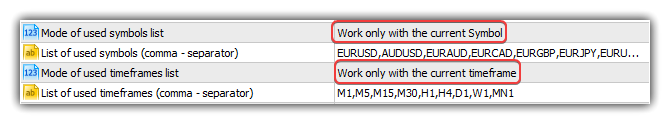
Compile the EA and launch it on the chart with the "Work only with the current Symbol" and "Work only with the current timeframe" settings:
Before launching the EA, make sure to open a new chart of GBPUSD symbol and configure its appearance differently from the charts opened by default when using the default.tpl template, for example, the following way (the GBPUSD chart was opened in advance):
Now we are able to test the new library functionality by clicking the panel buttons:
Every time a new chart was opened, the EA saved the template of a previously configured GBPUSD symbol chart and immediately applied it to each newly opened chart making the appropriate journal entries:
CChartObj::SaveTemplate: Chart template saved: GBPUSD H4
CChartObj::ApplyTemplate: Template applied to the chart: USDCHF H1
CChartObj::SaveTemplate: Chart template saved: GBPUSD H4
CChartObj::ApplyTemplate: Template applied to the chart: GBPUSD H1
CChartObj::SaveTemplate: Chart template saved: GBPUSD H4
CChartObj::ApplyTemplate: Template applied to the chart: EURUSD H1
CChartObj::SaveTemplate: Chart template saved: GBPUSD H4
CChartObj::ApplyTemplate: Template applied to the chart: USDRUB H1
CChartObj::SaveTemplate: Chart template saved: GBPUSD H4
CChartObj::ApplyTemplate: Template applied to the chart: EURJPY H1
CChartObj::SaveTemplate: Chart template saved: GBPUSD H4
CChartObj::ApplyTemplate: Template applied to the chart: EURGBP H1
CChartObjCollection::Close: Wrong chart ID (4101)
Closing the charts brings one error. The library updates the status of open charts once every half a second.
This is set in the Defines.mqh file:
//--- Parameters of the chart collection timer
#define COLLECTION_CHARTS_PAUSE        (500)                      // Chart collection timer pause in milliseconds
#define COLLECTION_CHARTS_COUNTER_STEP (16)                       // Chart timer counter increment
#define COLLECTION_CHARTS_COUNTER_ID   (9)                        // Chart timer counter ID
I clicked the button of closing the last open chart faster than two times per second, so an attempt to close the already closed previous chart (which still had the appropriate entry in the chart collection list) was made. The frequency of updating the current state of open charts, their windows and indicators can be adjusted by changing the specified macro substitution. Decrease the value of the constant to update the environment faster. In this case, the load on the CPU increases due to a higher frequency of updates. It is important to find the "golden mean" here since this functionality is still intended for manual control of charts, so the frequency of updates is customizable. Occasional errors arising when trying to access missing charts are not critical. Simply press the button a second time when the next environment update occurs and the chart object list is synchronized in the library with the chart object status in the client terminal.
Now it is time to test creating screenshots of the current chart. Each button click creates a chart screenshot of a certain size. First click — 800x600, second — 750x562, third — the current chart size:
After creating three screenshots in different resolutions (accompanied by the appropriate journal entries),
CChartObj::ScreenShot800x600: Screenshot created: DoEasy\ScreenShots\TestDoEasyPart70_EURUSD_H1_2021.04.13_14.02.25.png (800 x 600)
CChartObj::ScreenShot750x562: Screenshot created: DoEasy\ScreenShots\TestDoEasyPart70_EURUSD_H1_2021.04.13_14.02.28.png (750 x 562)
CChartObj::ScreenShotWndSize: Screenshot created: DoEasy\ScreenShots\TestDoEasyPart70_EURUSD_H1_2021.04.13_14.02.29.png (726 x 321)
we also viewed the contents of the folder these screenshots are saved to.
Before creating the screenshots, I hovered the cursor over different areas of two windows of the current chart, and the chart comment displays the time, price and index of the subwindow, as well as the cursor X/Y coordinates in pixels. The cursor Y coordinate has two values. The first value displays the Y coordinate of the initial coordinates of the symbol main window. The second value displayed (in brackets) shows the Y coordinate relative to the upper border of the window the cursor is located in.
As we can see, all the functionality planned for the current article works properly.
What's next?
In the next article, I will implement the auto tracking of events of changing the chart object properties and their windows.
All files of the current version of the library are attached below together with the test EA file for MQL5 for you to test and download.
Leave your questions and suggestions in the comments.
*Previous articles within the series:
Other classes in DoEasy library (Part 67): Chart object class
Other classes in DoEasy library (Part 68): Chart window object class and indicator object classes in the chart window
Other classes in DoEasy library (Part 69): Chart object collection class
Translated from Russian by MetaQuotes Ltd.
Original article: https://www.mql5.com/ru/articles/9293
 Swaps (Part I): Locking and Synthetic Positions
 Tips from a professional programmer (Part I): Code storing, debugging and compiling. Working with projects and logs
- Free trading apps
- Over 8,000 signals for copying
- Economic news for exploring financial markets
You agree to website policy and terms of use