
Grid and martingale: what are they and how to use them?

Introduction
In this article, I am going to use math and programming to delve into these strategies and evaluate their profitability. The article features mathematical and practical sections. In the math section, I will provide equations for calculating the expected payoff of the strategies and other important parameters not taken into account by many traders. In the practical part, I will develop a simple grid and martingale, and compare the equations with reality. The article is especially useful for beginners since these strategies are usually the first ones they come across. Blind faith into them may lead to disappointments and waste of time, as happened to me back in the time. If I had not known math, perhaps I would still have believed in them. But these strategies still have a rationale if you look at them correctly. This is what I am going to prove.
What do these two strategies have in common?
To understand the popularity of these two strategies, we should have a look at what all novice Forex traders want. Most novice traders are mathematicians and dreamers who think their intellect can help them get rich quickly and easily. I was once such a dreamer as well. Both these strategies give the appearance of profitable trading in the form of graphs constantly going up in the strategy tester. On many segments of the quote history, the tester may show Grail-like results even without any filters. In any field of activity and in any business, there is a danger of more informed people being able to enrich themselves at your expense. Forex trading is no exception. Forex features plenty of such deceptive practices, and these two strategies are the most illustrative and popular proof of this. The first time you use these strategies, you will see that they work on all currency pairs with incredible profit factors and expected payoffs and can even cope with any spreads, so it seems that this algorithm is beyond the market. This is because they are based on pure math and no logic. Even after so many years, I would still like to find algorithms allowing me to always get profit regardless of the price direction. Mathematicians are generally interesting people. They are able to prove anything with the right equations regardless of whether this is true in reality. )) In general, these two strategies exploit the illusion of breakeven to convince you to use them. Both of them work on any currency pair and any period, or rather create the illusion of working to convince you of their simplicity and efficiency. Delving into these strategies, you will sooner or later realize you do not know anything. ) However, this stage is necessary as this is the only way to start thinking rationally and understand the true nature of the market and what strategies you really need to use.
Grid and its basic equations
The order grid was created with the aim of making profit in any market. It does not matter whether it is falling or growing, if the market features a clearly visible movement, then, according to the idea, the grid opens orders using a clever order opening system so that in total these orders gain enough profit at some point to close them all at once. Let me show this in the images below:
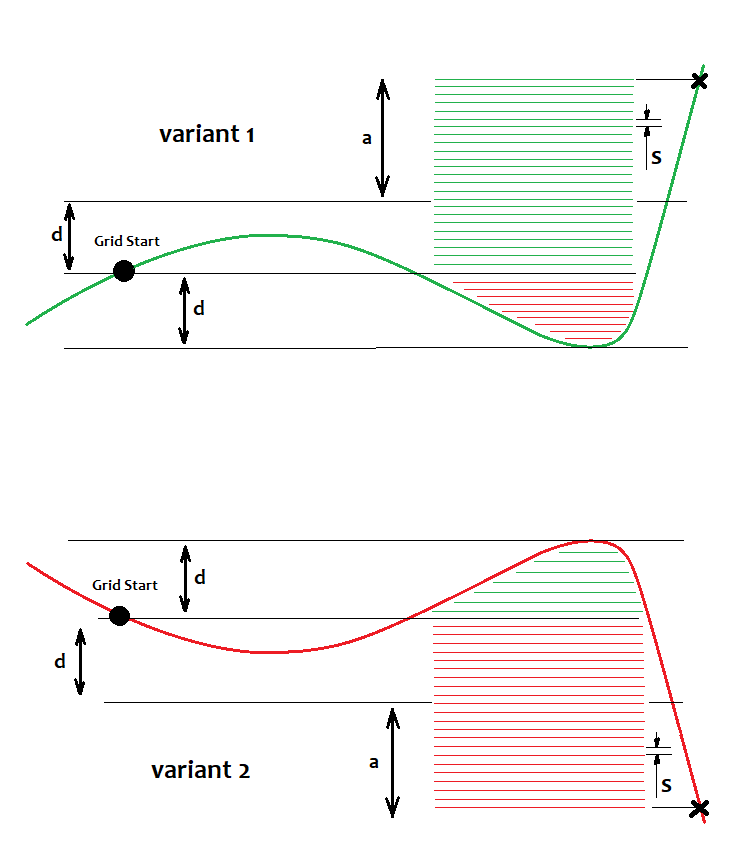
Here I have displayed two options for rising and falling markets, respectively. According to the grid strategy, we should win regardless of which option we get. Those using the grid always say to use pending orders as they are triggered at the best price. This is true, but I believe that market orders are no worse, if only by the fact that you are able to control spreads and slippages at the time of entry. Besides, you can slightly postpone the entry. However, limit orders are better in this strategy. We have a starting point, relative to which orders are placed. Above this point, we set buy orders with the step of "s", while below it, we set sell orders. If the price reaches them, they are turned into market ones. The image displays open orders based on the specific pricing situation. There is no point in displaying limit orders here since they remain at the same levels going up and down indefinitely. Only open real orders are important to us since their profit or loss adds up to the total profit or loss, respectively. To ensure profit, some orders should be greater than others by "K" times, i.e. we should provide K=a/d, where K>=K0. Upon reaching К0, the total profit of all grid orders exceeds the zero threshold. We can also calculate the current profit of a position or orders in case of MetaTrader 4 in the same simple manner. Otherwise, we will get a situation when the price immediately moves in a certain direction and we take the profit after the price moves "n" points up or down. Strictly speaking, this ratio can be calculated but it can be easily selected manually. The possible calculation looks as follows:
- Nl=d/s - 1
- NP=(a+d)/s -1
- Pr=Sum(1,NP)(s*i)=(s+s*NP)*Np/2
- Ls=Sum(1,Nl)(s*j+ s*NP)=(s+s*Nl)*Nl/2+s*NP^2
Summing up the loss or profit of all orders, we can see that these sums are arithmetic progressions. There is an equation describing the sum of the arithmetic progression (using its first and last terms), which is applied here.
Considering Pr-Ls=0, solving this equation yields "a" making possible to calculate K0=a/d. Besides, using these equations allows defining the profit factor and expected payoff of trading cycles that are to feature open buy and sell positions.
- Prf=Pr/Ls
- M=(Pr-Ls)/(Np+Nl)
These equations calculate the profit factor and expected payoff of a certain trading cycle rather than the entire graph. Provided that our graph ended at the end point of the cycle, the profit factor will be positive. A cycle is a separate grid. The grid is built, used to the maximum possible extent, positions are closed and a new grid is built. This is an infinite process in case of the infinite deposit. This is how it approximately looks on the balance curve:
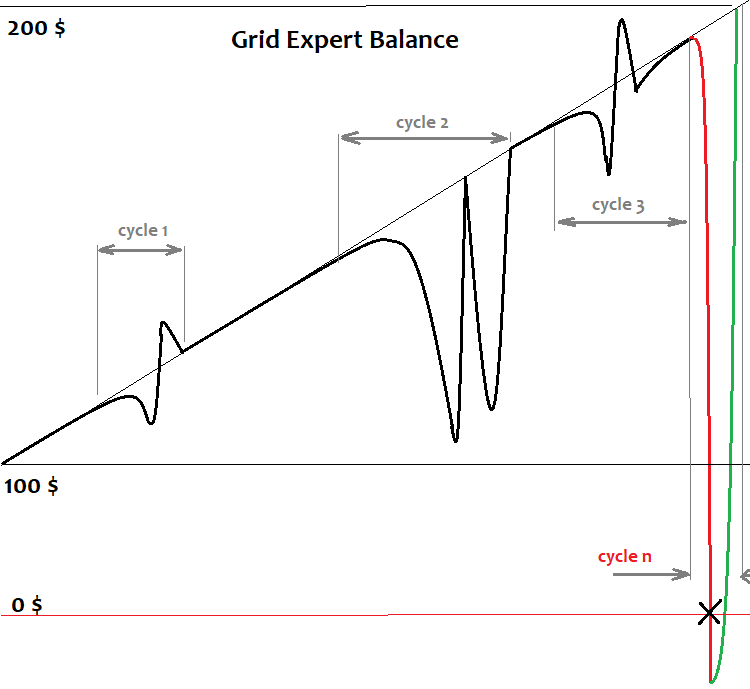
Here I have provided a simplified representation of a grid robot balance graph when running through history. There are a few cycles that the deposit is able to withstand and the graph goes up. But this inevitably ends with a cycle when the deposit is insufficient and all our visible profit goes to the broker. In terms of math, this is considered an unfinished cycle. The unfinished cycle is always unprofitable and its loss overlaps all profit earned during the cycles that worked to the end. The cycle may also become unfinished due to insufficient amount of orders necessary to continue the grid. All brokers impose limits on the number of simultaneously open orders in the terminal or on a specific pair. The grid cannot be constructed indefinitely. Even if we assume that we are able to do that, we still eventually get the above outcome. At the end of the article, I will briefly explain why this happens in terms of math.
Martingale and its basic equations
Like the grid, the idea behind the martingale is to win regardless of the market direction. It is based on the same illusion of eternal profit. If we open an order and it turns out profitable, we simply trade further. As soon as we get a loss, we increase the lot of the next order "n" times relative to the losing position. If our order is profitable, we simply close it and reset the lot back to the initial value. If the order turns out to be losing again, repeat the previous step while increasing the lot "n" times relative to the sum of lots of all losing positions within the cycle. Repeat till we have a profitable deal again. The last deal in the cycle is always profitable and its profit always covers the loss of losing deals. This is how the graph starts consisting of cycles. Provided that the graph ended with the last cycle, we get a positive expectation and profit factor. It is of no importance how and where we open these orders. Preferably, these orders should have fixed profit and loss or simply close on fixed stop levels. Here is how the martingale robot balance graph looks like:
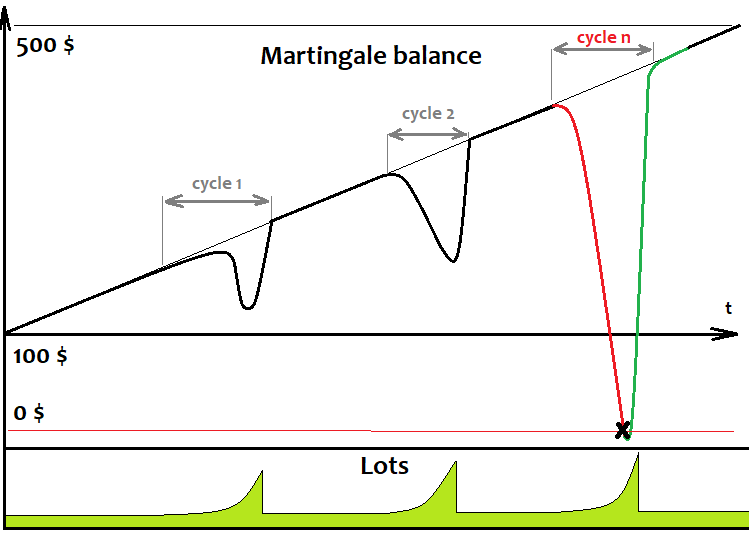
As we can see, it is very similar to the grid balance graph since the martingale works in cycles, just like the grid. The only difference is that it always opens a single order and waits till it is closed to open the next one. Just like in the case of the grid, sooner or later, the deposit becomes insufficient to finish the cycle, all orders are closed and the deposit is wiped out. To ensure profitable cycles, the profit of the last deal should cover the loss of the previous ones:
- Nl
- Np=1
- Pr=L[Nl+Np]*TP[Nl+Np]*TickSize
- Ls=Sum(1,Nl)(L[i]*SL[i])*TickSize
Here the profit is calculated in your account currency units rather than in points since the system deals with a lot size. Lots of a specific order are calculated using recursion:
- L[1]=StartLot
- for(2,Nl) L[i]=(K*Sum(1,i-1)(L[j]*SL[j]))/TP[i]
where "K" is the required profit factor of the cycle. Spreads, commissions and swaps are not considered here but I don't think this is important. If the need arises, the equations can be easily modified, although I do not see the point in that. The martingale equations are similar to the grid ones. SL and TP are the obtained loss and desired profit of an order. We are able to obtain the definition by solving the following simple equation: K=(L[i]* TP[i])/Sum(1,i-1)(L[j]*SL[j]).
Developing and testing the simplest grid EA
To test the above assumptions, let's write a simple grid EA and a simple martingale in MQL5 language to test them and see the results. I am going to start with the grid. First, add a couple of convenient classes for working with positions to our template:
#include <Trade\PositionInfo.mqh>
#include <Trade\Trade.mqh>
CPositionInfo  m_position=CPositionInfo();// trade position object
CTrade         m_trade=CTrade();          // trading object
These two libraries are always present in MetaTrader 5 by default, so there will be no compilation issues.
Next, let's describe all the necessary inputs:
///grid variables
input int MaxChannelSizePoints=500;//Max Of a+d
input int MinMoveToClose=100;//Mininum Move
input int GridStepPoints=20;//Grid Step In Points
input int BarsI=999;//Bars To Start Calculate
input double KClose=3.5;//Asymmetry
///

////////minimum trading implementation
input int SlippageMaxOpen=15; //Slippage For Open In Points
input double Lot=0.01;//Lot
input int MagicC=679034;//Magic
/////////
The first block implements all the necessary grid parameters, while the second one implements the ability to trade a fixed lot in its simplest form.
When launching the EA, we will need the verification and recovery of the grid parameters from the previous session in case the operation was terminated incorrectly. This feature is optional but it is better to implement such things beforehand:
void DimensionAllMQL5Values()//////////////////////////////
   {
   ArrayResize(Time,BarsI,0);
   ArrayResize(High,BarsI,0);
   ArrayResize(Low,BarsI,0);
   }

void CalcAllMQL5Values()///////////////////////////////////
   {
   ArraySetAsSeries(High,false);
   ArraySetAsSeries(Low,false);
   ArraySetAsSeries(Time,false);
   CopyHigh(_Symbol,_Period,0,BarsI,High);
   CopyLow(_Symbol,_Period,0,BarsI,Low);
   CopyTime(_Symbol,_Period,0,BarsI,Time);
   ArraySetAsSeries(High,true);
   ArraySetAsSeries(Low,true);
   ArraySetAsSeries(Time,true);
   }
This code is necessary to implement predefined arrays to complete the initial analysis. We are not going to need these arrays afterwards. We will use them only during the initial calculation.
The recovery is performed the following way:
void RestoreGrid()//recover the grid if the robot is restarted
   {
   DimensionAllMQL5Values();
   CalcAllMQL5Values();
   bool ord=PositionSelect(Symbol());
   if ( ord && int(PositionGetInteger(POSITION_MAGIC)) == MagicC )
      {
      GridStartTime=datetime(PositionGetInteger(POSITION_TIME));
      GridStartPrice=double(PositionGetDouble(POSITION_PRICE_OPEN));
      GridUpPrice=GridStartPrice;
      GridDownPrice=GridStartPrice;

      for(int i=0;i<BarsI;i++)
         {
         if ( High[i] > GridUpPrice ) GridUpPrice=High[i];
         if ( Low[i] < GridDownPrice ) GridDownPrice=Low[i];
         if ( Time[i] < GridStartTime ) break;
         }
      bCanUpdate=true;
      bTryedAlready=false;
      }
   }
To track the current grid status, we need to additional variables displaying the upper and lower prices during the existence of the grid, as well as the starting grid price and the time it was set.
datetime GridStartTime;//grid construction time
double GridStartPrice;//grid starting price
double GridUpPrice;//upper price within the corridor
double GridDownPrice;//lower price within the corridor
We also need two boolean variables to track or update grid variables during the price movement, as well as for additional attempts to close the grid if the first attempt failed.
bool bCanUpdate;//whether it is possible to update the grid
bool bTryedAlready;//whether there was an attempt to close a position
Creating and updating the grid parameters during the development looks as follows:
void CreateNewGrid()//create a new grid
   {
   SymbolInfoTick(Symbol(),LastTick);
   GridStartTime=TimeCurrent();
   GridStartPrice=LastTick.bid;
   GridUpPrice=GridStartPrice;
   GridDownPrice=GridStartPrice;

   double SummUp=LastTick.ask+double(GridStepPoints)*_Point;
   double SummDown=LastTick.bid-double(GridStepPoints)*_Point;

   while ( SummUp <= LastTick.ask+double(MaxChannelSizePoints)*_Point )
      {
      m_trade.BuyStop(Lot,SummUp,Symbol());
      SummUp+=double(GridStepPoints)*_Point;
      }

   while ( SummDown >= LastTick.bid-double(MaxChannelSizePoints)*_Point )
      {
      m_trade.SellStop(Lot,SummDown,Symbol());
      SummDown-=double(GridStepPoints)*_Point;
      }
   }

void UpdateGrid()//update the grid parameters
   {
   SymbolInfoTick(Symbol(),LastTick);
   if ( LastTick.bid > GridUpPrice ) GridUpPrice=LastTick.bid;
   if ( LastTick.bid < GridDownPrice ) GridDownPrice=LastTick.bid;
   }
The functions for closing positions and clearing the remaining limit orders, as well as the predicate function that detects the condition for closing the grid:
void ClosePosition()//close a position by a symbol
   {
   bool ord;
   ord=PositionSelect(Symbol());
   if ( ord && int(PositionGetInteger(POSITION_MAGIC)) == MagicC  )
      {
      if(m_position.SelectByIndex(0)) m_trade.PositionClose(m_position.Ticket());
      }
   }

void CleanLimitOrders()//clear limit orders
   {
   int orders=OrdersTotal();
   for(int i=0;i<orders;i++)
      {
      ulong ticket=OrderGetTicket(i);
      if(ticket!=0)
         {
         m_trade.OrderDelete(ticket);
         }
      }
   }

bool bCanClose()//closure condition
   {
   if ( GridStartPrice == GridUpPrice && (GridStartPrice-GridDownPrice)/_Point >= MinMoveToClose ) return true;
   if ( GridStartPrice == GridDownPrice && (GridUpPrice-GridStartPrice)/_Point >= MinMoveToClose ) return true;

   if ( GridStartPrice != GridUpPrice && GridStartPrice != GridDownPrice
   && (GridStartPrice-GridDownPrice)/(GridUpPrice-GridStartPrice) >= KClose
   && (GridStartPrice-GridDownPrice)/_Point >= MinMoveToClose ) return true;
   if ( GridStartPrice != GridDownPrice && GridStartPrice != GridUpPrice
   && (GridUpPrice-GridStartPrice)/(GridStartPrice-GridDownPrice) >= KClose
   && (GridUpPrice-GridStartPrice)/_Point >= MinMoveToClose ) return true;

   /*
   if ( GridUpPrice >= GridStartPrice+MaxChannelSizePoints*_Point
   //|| GridDownPrice <= GridStartPrice-MaxChannelSizePoints*_Point ) return true;
   */
   return false;
   }
I have commented out the last condition in the predicate function. It closes the grid in case the price moves outside the grid. You can use it at will, it does not change anything else. Now we only need to write the main trading function:
void Trade()//the main function where all actions are performed
   {
   bool ord=PositionSelect(Symbol());

   if ( bCanUpdate ) UpdateGrid();

   if ( ord && bCanClose() )//if there is a position and the closing condition is met
       {
       ClosePosition();
       CleanLimitOrders();
       bCanUpdate=false;
       bTryedAlready=true;
       }
   if ( bTryedAlready ) ClosePosition();

   if ( !bCanUpdate && !ord )
       {
       CleanLimitOrders();
       CreateNewGrid();
       bCanUpdate=true;
       bTryedAlready=false;
       }
   }
Also, let's define where and what to call and what to do when initializing the EA:
int OnInit()
  {
  m_trade.SetExpertMagicNumber(MagicC);//set the magic number for positions
  RestoreGrid();//restore the grid if present
   return(INIT_SUCCEEDED);
  }

void OnTick()
  {
  Trade();
  }
We have developed the grid EA. Now let's test it and see how it behaves:
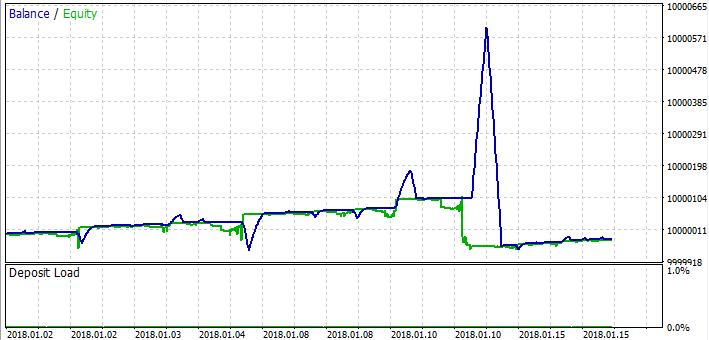
As you can see, the assumptions about the unprofitable cycle have been confirmed. At first, the grid works pretty well, but then comes a moment when the grid is insufficient leading to a losing cycle devastating all the profit. Trendy market segments usually demonstrate good results, while losses mostly occur on flat segments. The overall result is always a loss since we still have a spread.
Developing and testing the simplest martingale EA
Now that we have dealt with the grid, let's move on to the martingale EA. Its code will be much simpler. To work with positions, we will use the libraries applied in the grid EA. There is no point in displaying the code for the second time. Let's consider the inputs right away:
input int SLE=100;//Stop Loss Points
input int TPE=300;//Take Profit Points
input int SlippageMaxOpen=15; //Slippage For Open In Points
input double Lot=0.01;//Start Lot
input int MagicC=679034;//Magic
input int HistoryDaysLoadI=10;//History Deals Window Days
For more simplicity, I have chosen the system, in which positions are closed strictly by stop loss or take profit. The last variable allows us to avoid constantly loading the entire order history, but rather the necessary window only (purely for optimization). I believe, other variables are self-explanatory.
The EA is to feature only two functions:
double CalcLot()//calculate the lot
   {
   bool ord;
   double TotalLot=0;
   HistorySelect(TimeCurrent()-HistoryDaysLoadI*86400,TimeCurrent());
   for ( int i=HistoryDealsTotal()-1; i>=0; i-- )
      {
      ulong ticket=HistoryDealGetTicket(i);
      ord=HistoryDealSelect(ticket);
      if ( ord && HistoryDealGetString(ticket,DEAL_SYMBOL) == _Symbol
      && HistoryDealGetInteger(ticket,DEAL_MAGIC) == MagicC
      && HistoryDealGetInteger(ticket,DEAL_ENTRY) == DEAL_ENTRY_OUT )
         {
         if ( HistoryDealGetDouble(ticket,DEAL_PROFIT) < 0 )
            {
            TotalLot+=HistoryDealGetDouble(ticket,DEAL_VOLUME);
            }
         else
            {
            break;
            }
         }
      }
   return TotalLot == 0 ? Lot: TotalLot;
   }


void Trade()//the main function where all actions are performed
   {
   bool ord=PositionSelect(Symbol());
   SymbolInfoTick(Symbol(),LastTick);
   if ( !ord )
      {
      if ( MathRand() > 32767.0/2.0 )
         {
         m_trade.Buy(CalcLot(),_Symbol,LastTick.ask,LastTick.bid-double(SLE)*_Point,LastTick.ask+double(TPE)*_Point);
         }
      else
         {
         m_trade.Sell(CalcLot(),_Symbol,LastTick.ask,LastTick.ask+double(SLE)*_Point,LastTick.bid-double(TPE)*_Point);
         }
      }
   }
The first one is needed to calculate the final lot used to open a position after looking at the deal history. If the last deal is unprofitable, the next lot will be equal to the sum of lots of previous losing deals up to the first profitable one. If the last deal is profitable, reset the lot to its starting value. In the main function, we open orders in different directions with fixed stop levels at random, while volumes are calculated using the first function. In order for all this to work correctly, we need to assign a magic number to the EA in the initializer, while the main function is called in the OnTick handler, just like in the grid.
This concludes the development of the simplest martingale. Now let's test it and see the result:
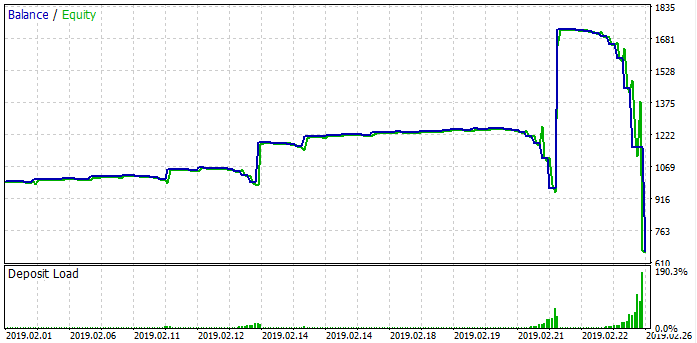
The case is similar to the grid. We can see the cycles. The martingale EA works right before the losing cycle sets in. The margin becomes insufficient to open the next position and the loss occurs. Just like the grid, somewhere it works, somewhere it is not, but it always ends in a loss. Now that we have considered both strategies, it is time to draw mathematical conclusions leading us to more important answers than just understanding these two strategies.
Common math behind grid and martingale
Why do I believe the common math behind grid and martingale is so important? If we thoroughly understand it, we can finally say goodbye to a whole series of ideas that will never bring us profit, although we may want to believe in them. At the very least, we will understand what conditions can contribute to the performance of these strategies. Besides, we will realize why pure martingale and grid are losing strategies.
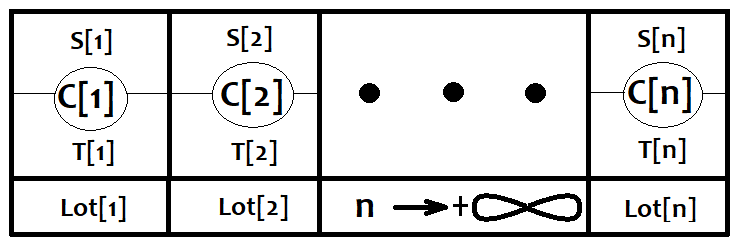
Let's imagine that any strategy consists of an infinite number of the simplest strategies. When an order is opened, one of them is activated. We will assume that these orders are closed at a fixed loss or profit. Let's put them in correspondence with the C [i] and Lot [i] arrays where the size of these arrays is equal and tends to infinity. Suppose that the lot applied by each of the strategies is always different. Also, let's introduce the probability of any of these strategies being triggered. PC[i], of course these events form a complete group so that Sum(0,n)( PC[i] ) = 1. All outcomes of these events form new event spaces S[i], T[i], which represent, respectively, activations by loss and profit. These events have their own conditional probabilities PS[i], PT[i], which, of course, also form a complete group. The graphical representation is provided below:
Now let's consider any single strategy from this list and calculate its expected payoff.
- M[i]=(PT[i]*TP-PS[i]*SL)*Lot[i]*TickSize.
If we don't know the price direction in position opening points, we can say that M[i]=0, where M[i] is the array of expected payoffs of certain strategies. In other words, if we don't know where the price is heading, we get 0 regardless of how we trade provided that the number of deals tends to infinity.
The general expected payoff equation looks as follows:
- M0=Sum(0,n)(PC[i]*M[i])
We know that when n tends to infinity, all M[i] tend to zero meaning that all terms of our sum tend to 0 in case the number of strategies is finite, while the number of deals is infinite. This, in turn, means that the general expected payoff M0 is still equal to 0. If we think further, it turns out that an infinite set of such finite sets of strategies is also equal to zero, since summing up an infinite number of zeros results in 0. In case of the grid, the lot size is the same everywhere, while in case of the martingale, it is different, but this difference does not affect the final expectation in any way. Both strategies can be described using this general equation without even bothering about combinatorics. All is quite simple and straightforward.
Since these strategies can be described using this equation, then it works for any strategy. This entails the conclusion that all strategies involving variation and manipulating deal volumes, as well as order opening/closing systems of any complexity are doomed to fail without knowing the approximate movement direction at the time of opening and closing deals or at least some auxiliary market parameters. Without a correct forecast, all our efforts are just a waste of time and money.
How to use grid and martingale correctly
The grid may be useful in case you know about the upcoming market movement in a certain direction or the probability of such an event is high, while there is also the risk of a gap. Gaps and grids do not mix very well. This is because orders are placed with a certain step, and it may happen that the next tick will fly past all orders and appear far beyond the grid. Of course, this is a rare occasion, but it inevitably reduces the system performance. The grid size should be set equal or slightly less than the predicted movement, while we do not need to know the direction of the movement, but only its approximate value. Below is how the balance graph looks in case of a successful trend detection algorithm:
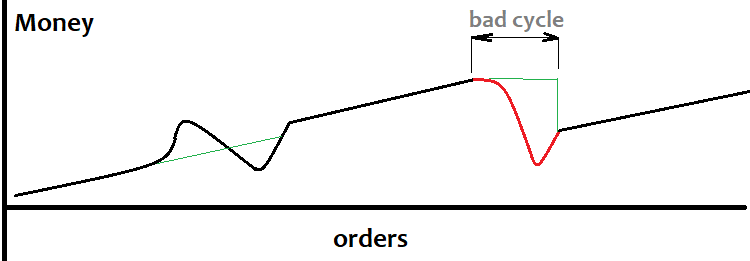
It is not always possible to define a trend beforehand. This often leads to losing cycles (marked red above) and the drawdown is also quite large. The grid may be useful for those having methods of detecting large movements. In this case, the grid can be based on the custom signal. I have not dealt with this question yet, so if someone has good algorithms for detecting strong movements, feel free to share your experience.
Now let's consider the martingale. If we have any signal with the expected payoff of "0", but it is known that the sequence of losses is such that the probability of a profitable deal is close to one for a certain number of losses in a row, then the signal can be used for martingale. The balance graph looks like this:
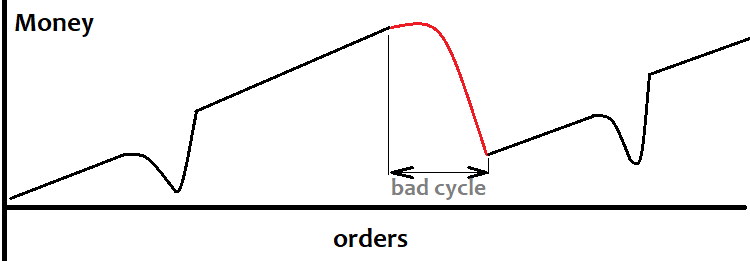
But I personally believe that martingale is dangerous in any case. I believe that it is almost impossible to achieve such conditions as I described, although in case of the grid all seems easier, and, most importantly, clearer.
Conclusion
In this article, I tried to describe these two strategies as clearly as possible highlighting their similarities, advantages and drawbacks. I believe, all explanations are easy to understand even for beginners. The article was intended mostly for novice traders, however the derived conclusions are much more important than just a simple assessment of the strategies and the limits of their application. The general mathematical conclusions provided here allow everyone to use their time efficiently while developing their own trading systems. The article itself does not bring anything new to understanding the market physics, but I think it can prevent many traders from thoughtlessly exploiting these principles for their own good.
Translated from Russian by MetaQuotes Ltd.
Original article: https://www.mql5.com/ru/articles/8390
 Brute force approach to pattern search
 Neural networks made easy (Part 4): Recurrent networks
- Free trading apps
- Over 8,000 signals for copying
- Economic news for exploring financial markets
You agree to website policy and terms of use