Ashkan Hazegh Nikrou / Perfil
- Información
5+ años
experiencia
|
20
productos
|
50
versiones demo
|
84
trabajos
|
0
señales
|
0
suscriptores
|
https://www.mql5.com/en/job/new?prefered=ashkan.nikrou
Estoy trabajando arduamente para desarrollar estrategias confiables para el mercado de divisas. Por favor, visita mi página de productos y prueba mis soluciones para el mercado Forex:
https://www.mql5.com/en/users/ashkan.nikrou/seller#products
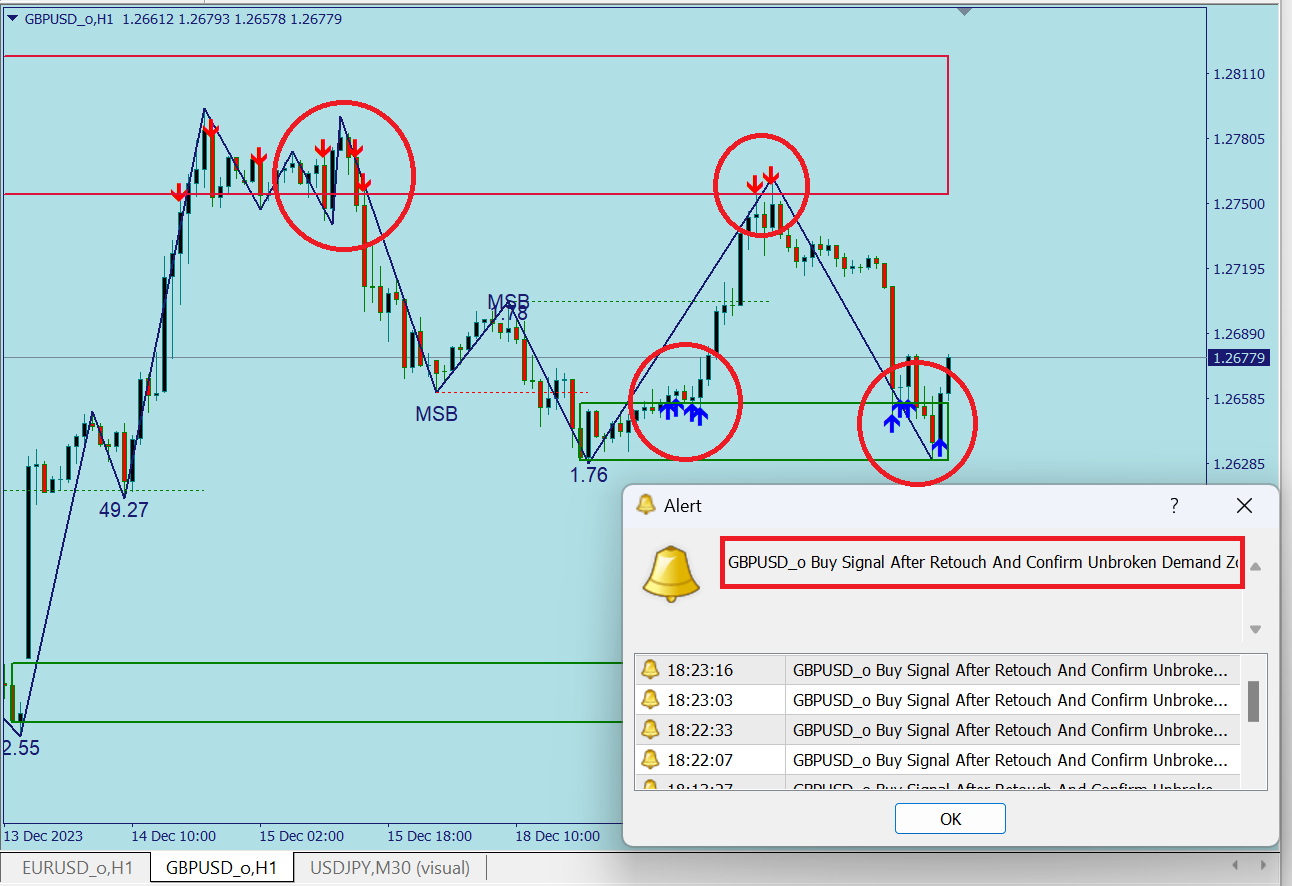
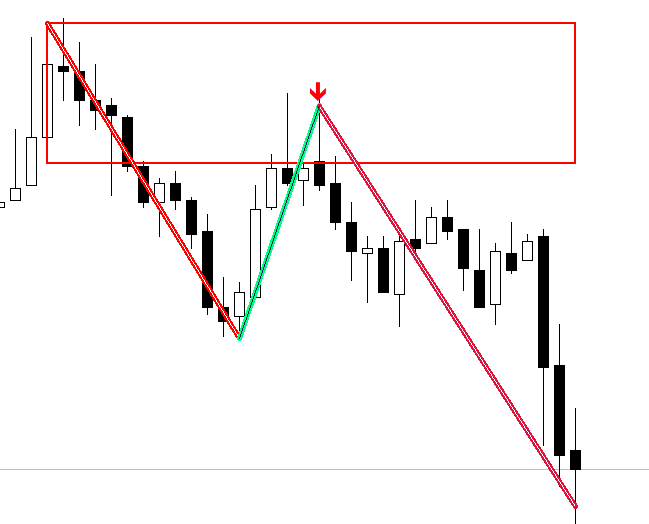
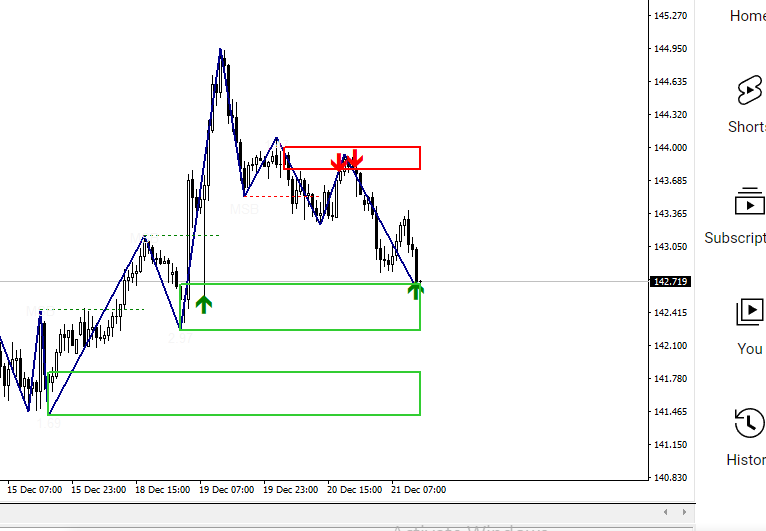
MSB (Market Structure Break Out) Article :
https://www.mql5.com/en/blogs/post/755387
Mira mis videos de Forex en YouTube:
https://www.mql5.com/en/blogs/post/740668
Únete al canal ProEngulfing:
https://www.mql5.com/en/channels/proengulfing
Below image show the result of signal, seems prediction was correct and market goes up and up.
Try Supply Demand :
https://www.mql5.com/en/market/product/110390
Try Market Structure Break Out :
https://www.mql5.com/en/market/product/109958
Koala FVG
https://www.mql5.com/en/market/product/108907
QualifiedEngulfing
https://www.mql5.com/en/market/product/108512
Koala BTC Level
https://www.mql5.com/en/market/product/57995
Koala Trend Line
https://www.mql5.com/en/market/product/57692
Best SAR MT5
https://www.mql5.com/en/market/product/77662
Best SAR
https://www.mql5.com/en/market/product/77418
Koala Fibo Base Time
https://www.mql5.com/en/market/product/58460
Accuracy Meter
https://www.mql5.com/en/market/product/51210
As you know when GBPUSD goes up, it means GBP going to more power or USD goes more weak, but you cant understand what is the reason of this movement, it was about GBP ? or it was about USD ?
To determine GBP power , This indicator, will check all pairs contain GBP and determine there movements and finally calculate average power of movement for GBP, and show us by percent and also histogram,
By this way you can see histogram by some green and red bars, and also percent's, can show you want is the power of GBP or USD or EUR or JPY and ..
https://www.mql5.com/en/market/product/51181
https://www.mql5.com/en/market/product/58172
COMBINATION OF MSB(MARKET STRUCTURE BREAK OUT) AND UNBROKEN ZONES
https://www.mql5.com/en/blogs/post/755387
https://www.mql5.com/en/market/product/110390
Supply and Demand Zones are crucial concepts in technical analysis, providing valuable insights for traders. Here's a tip to enhance your understanding and trading skills:
"Supply and Demand Zones act as key levels where price dynamics shift, reflecting imbalances between buying and selling forces. A Supply Zone is an area where selling interest surpasses buying, causing price declines. On the other hand, a Demand Zone is where buying interest dominates, leading to price increases.
Why are they important?
Price Reversals: Recognizing Supply and Demand Zones helps traders identify potential reversal points. When price approaches a Demand Zone, it may bounce upwards, and when it reaches a Supply Zone, it might reverse downwards.
Trade Entries and Exits: Supply and Demand Zones serve as excellent areas for defining entry and exit points. Traders often place buy orders near Demand Zones and sell orders near Supply Zones, aiming to capture favorable price movements.
Risk Management: Understanding these zones aids in setting stop-loss and take-profit levels. Placing stops beyond Supply or Demand Zones helps manage risk, as a breach of these zones may indicate a change in market sentiment.
Confirmation of Trends: Supply and Demand Zones can act as confirmation indicators for existing trends. For example, in an uptrend, a pullback to a Demand Zone might be a potential entry point for traders expecting the trend to continue.
Institutional Trading: Large institutional traders often focus on Supply and Demand Zones. Recognizing these zones allows retail traders to align their strategies with institutional buying or selling activities.
Remember, mastering the art of identifying and utilizing Supply and Demand Zones takes practice. Combine this knowledge with other technical analysis tools for a holistic trading approach." 🚀💡
https://www.mql5.com/en/market/product/110390
https://www.mql5.com/en/market/product/52023
As we bid farewell to the old year, let's welcome the new one with hope, optimism, and a renewed passion for trading success. May the coming year bring you profitable trades, wise decisions, and financial prosperity.
Reflect on your achievements, learn from your experiences, and gear up for exciting opportunities in the markets. May your charts be bullish, your analysis be accurate, and your profits be plentiful.
Wishing you a year filled with abundance, growth, and successful trades! Here's to reaching new heights in your trading journey. Happy New Year to our trading community! 🚀✨
Cheers
Find out more in link below :
https://www.mql5.com/en/market/product/110390
Supply demand zones is back test able on chart by click any where
Presentamos el Indicador de Oferta y Demanda Koala para MetaTrader 4: Bienvenido al Indicador de Oferta y Demanda Koala. Este indicador está diseñado para identificar zonas de oferta y demanda ininterrumpidas. Puede ayudar al trader a ver el mercado como áreas de zona; puede observar cómo el precio respeta algunas zonas poderosas. Este indicador también puede mostrar señales de acción del precio cuando se forman dentro de las zonas. Únete al Canal de Soluciones de Trading Koala en
https://www.mql5.com/en/market/product/109958
Test MSB indicator by follow link below
https://www.mql5.com/en/market/product/109958
Welcome to this blog post, i am happy to explain about one of major and meaning full concepts in forex market, i am talking about price mobement structure and also supply demand zones that made after market movement, in below article i try to show you how does MSB or marlket structure break out work and how we can extract market price movement as wave by using MSB tools, and after that i try to show unbroken supply and demand zones can formed based on MSB waves, finally we will merge these 2 concepts and try to generate entry buy and sell signals based on combination of MSB and unbroken zones. read more in below article : https://www.mql5.com/en/blogs/post/755387