Double Top Double Bottom Pattern Scanner
- Indicadores
- Mihails Babuskins
- Versión: 1.0
- Activaciones: 20
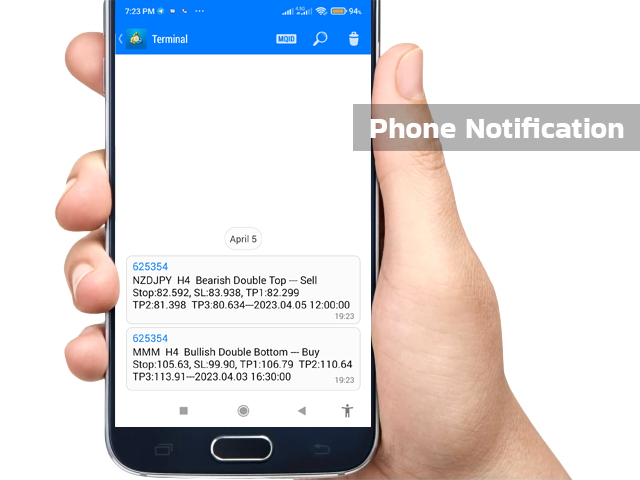
- Contact me after payment to send you the User-Manual PDF File.
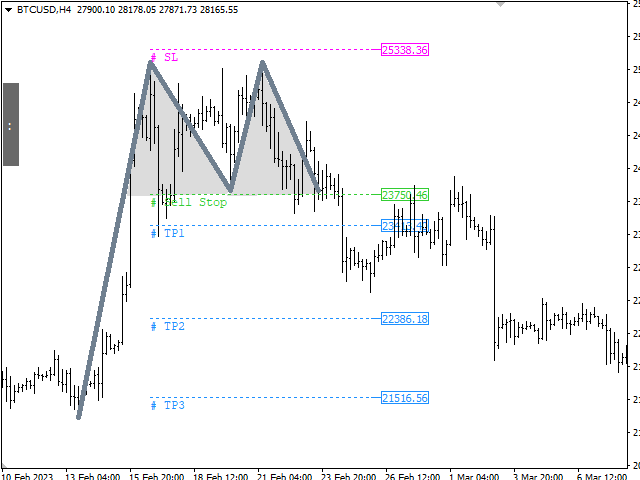
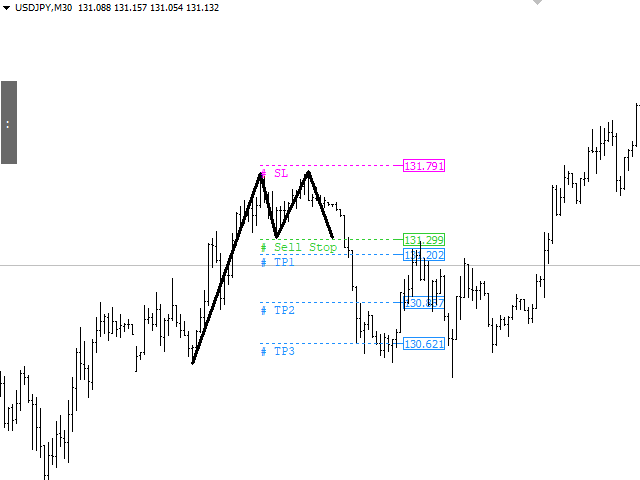
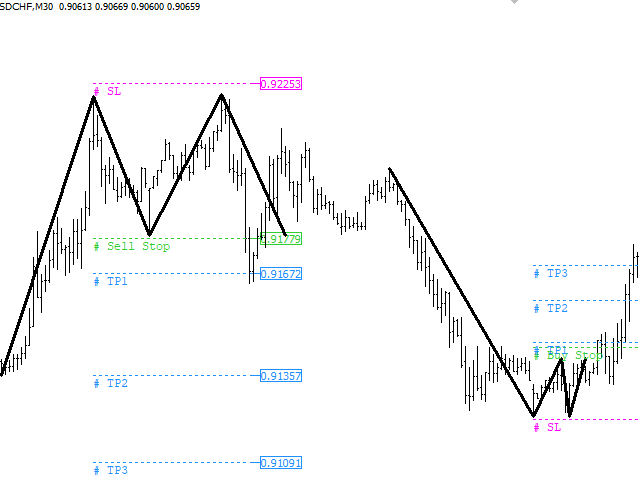
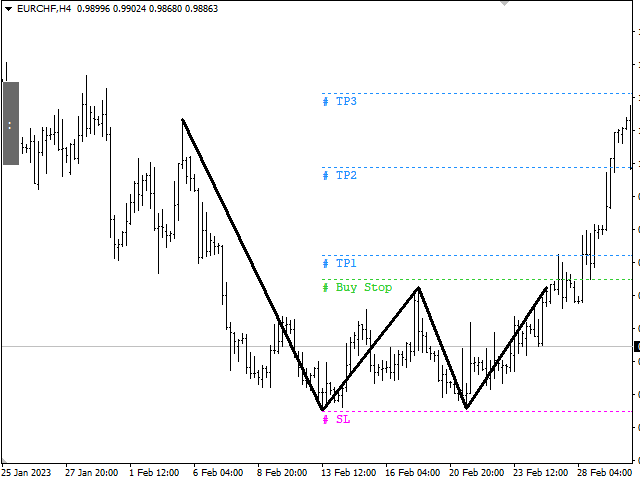
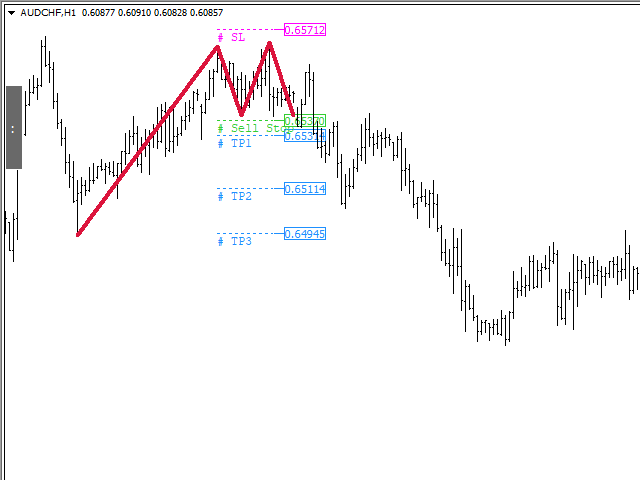
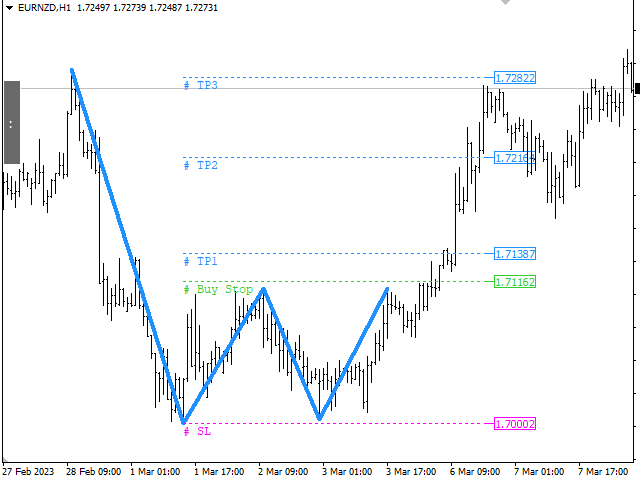
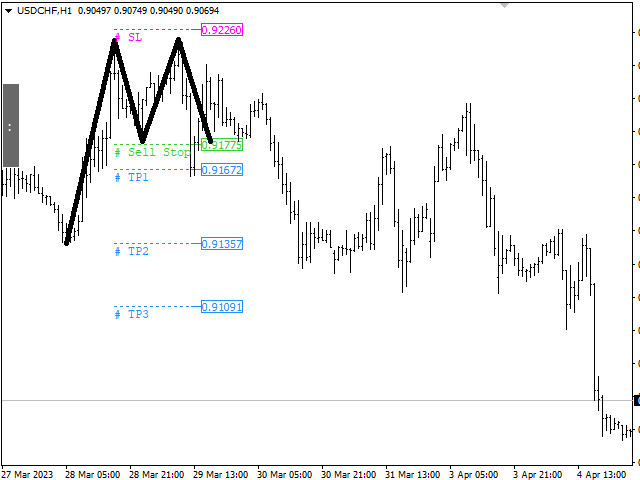
Double Top/Bottom Pattern
Double top and bottom patterns are chart patterns that occur when the underlying investment moves in a similar pattern to the letter "W" (double bottom) or "M" (double top). Double top and bottom analysis are used in technical analysis to explain movements in a security or other investment, and can be used as part of a trading strategy to exploit recurring patterns.
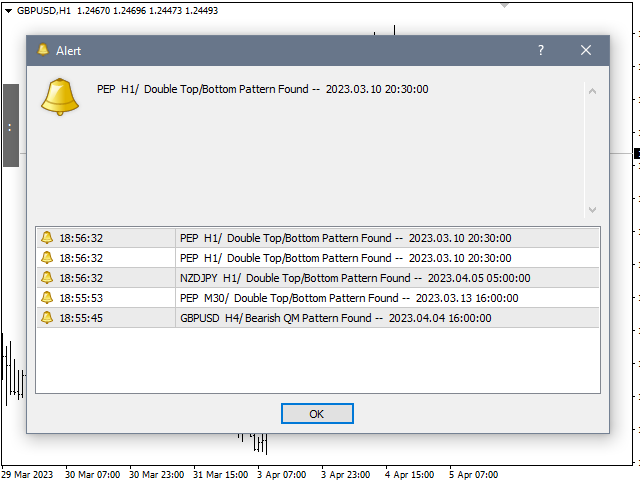
Searching for this pattern among the charts is time consuming, this indicator searches among the symbols that selected by the user, and finds the double top/bottom pattern.
This indicator as an effective tool can be part of the strategy, used as an independent strategy or combined with another method.
For example: this indicator can be used when a divergence occurs or when a double top/bottom pattern is found, a momentum indicator in higher time-frame can be used for confirmation....
Each time several symbols are scanned, the indicator may find patterns, but in the end, is up to you to determine if the pattern that found is valid or not, then take the position.
Double Top/Bottom Pattern Scanner Indicator
Double Top/Bottom Pattern Scanner Indicator
It is usually difficult for a trader to recognize classic patterns on a chart, as well as searching for dozens of charts and time frames will take time, and there is also a possibility of a trader's mistake in calculations. This indicator can automatically search all charts and time frames to find possible patterns in seconds. Searching, Fibonacci calculations, and pattern recognition are completely the responsibility of the indicator; All you have to do is "press the scan button".
How To Trade?
All parameters necessary to enter the trade are calculated, such as entry point, stop-loss, and take-profit. By observing the signal and deciding to trade, we enter the trade with the "set and forget" method. 


Hi! Can you send me the instructions?
I sent the user manual file to you, please check your private messages. 🌺🙏☘️