• Información general
  • Comentarios (3)
  • Discusión (20)
  • Novedades

MetaForecast M5

5

MetaForecast predice y visualiza el futuro de cualquier mercado basándose en las armonías de los datos de precios. Aunque el mercado no siempre es predecible, si existe un patrón en el precio, MetaForecast puede predecir el futuro con la mayor precisión posible. En comparación con otros productos similares, MetaForecast puede generar resultados más precisos al analizar las tendencias del mercado.


Parámetros de entrada

Past size (Tamaño del pasado)

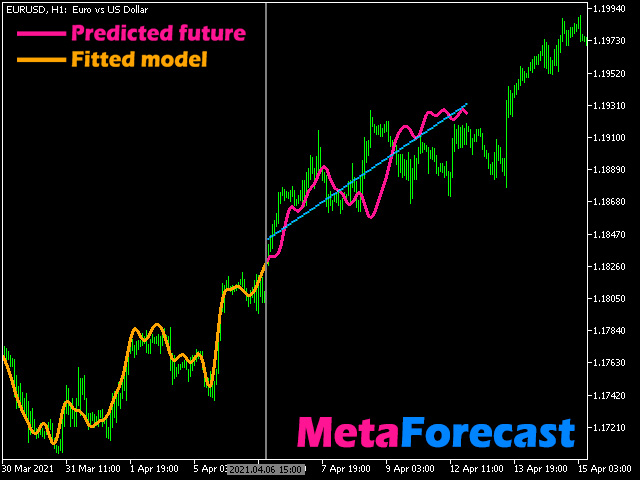
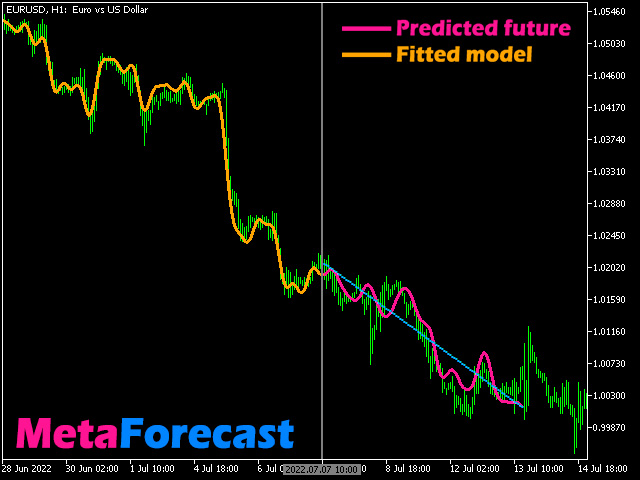
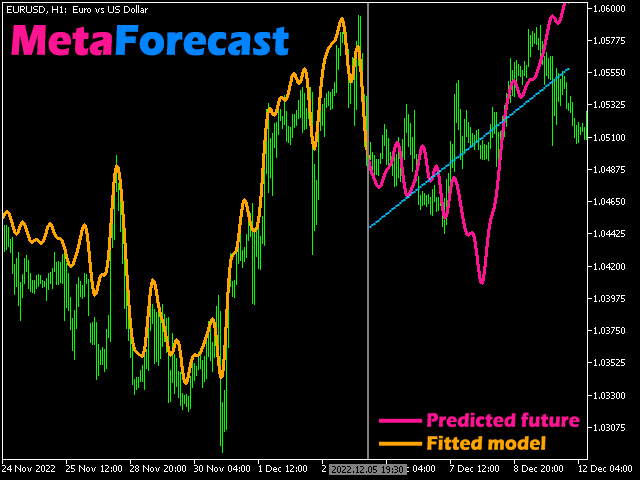
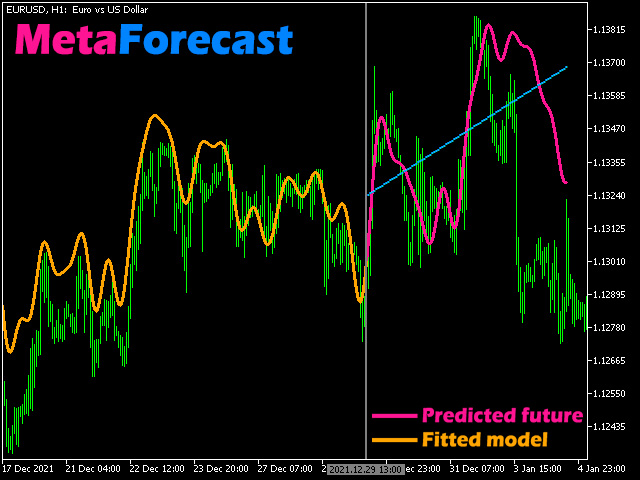
Especifica el número de barras que MetaForecast utiliza para crear un modelo para generar predicciones futuras. El modelo se representa mediante una línea amarilla trazada sobre las barras seleccionadas.

Future size (Tamaño del futuro)

Especifica el número de barras futuras que se deben predecir. El futuro predicho se muestra mediante una línea rosa con líneas de regresión azules dibujadas sobre ella.

Degree (Grado)

Este valor de entrada determina el nivel de análisis que MetaForecast llevará a cabo en el mercado.

Degree Descripción
 0 Para un grado de 0, se recomienda utilizar un valor grande para el parámetro "Tamaño del pasado" para abarcar todos los picos y valles, así como los detalles en el precio.
 1 (recomendado) Para un grado 1, MetaForecast puede comprender las tendencias y generar mejores resultados con un valor más pequeño para el parámetro "Tamaño del pasado".
 2 Para un grado 2, además de las tendencias, MetaForecast también puede identificar puntos de reversión. Para grados superiores a 1, se deben utilizar valores más altos para los parámetros 'Detalles' y 'Reducción de ruido'.
 Mayor que 2 No se recomienda utilizar grados mayores que 2, pero se puede intentar.
Se pueden utilizar múltiples instancias de MetaForecast con diferentes grados para confirmar las predicciones. Por ejemplo, se puede usar una instancia con PastSize=5000 y Degree=0, y otra instancia con PastSize=600 y Degree=1 juntas.

Details (Detalles)

Especifica el porcentaje de detalles en los datos de precios que se deben extraer para generar predicciones. Valores más altos requieren más tiempo de procesamiento.

Noise Reduction (Reducción de ruido)

Cuando se utilizan grados mayores que 1, MetaForecast requiere reducción de ruido para los datos de entrada con el fin de crear un modelo adecuado. Por ejemplo, para degree=2, establece la reducción de ruido en un 90%. Para obtener un mejor resultado, aumenta los detalles al 20%.

Remove jumps (Eliminar saltos)

A veces, existen grandes saltos en los resultados de predicción, especialmente para grados superiores a 1. Habilitar esta opción de entrada puede corregir la forma de la predicción.

Regression lines (Líneas de regresión)

MetaForecast dibuja líneas de regresión en las barras predichas para hacer la tendencia más clara. Utiliza esta entrada para especificar el número de líneas.

Calculate per n bars (Calcular por cada n barras)

Establece el intervalo entre dos predicciones utilizando esta entrada. Por ejemplo, si lo configuras en 100, significa que predice el futuro y luego se detiene durante 100 barras antes de realizar la siguiente predicción.

MetaForecast permite a los traders predecir los movimientos futuros de precios en el historial de precios, lo que les permite comparar los resultados con los precios reales futuros. Para utilizar esta función, presiona la tecla "H" en tu teclado para ver la línea vertical, que se puede mover para ajustar la predicción a los precios históricos en lugar de la vela actual. Para navegar a través del historial, mantén presionada la tecla "Ctrl" y mueve el mouse para desplazar la línea vertical. Para volver a la vela actual, presiona nuevamente la tecla "H". Si tienes múltiples MetaForecasts en tu gráfico y necesitas restablecerlos al mismo tiempo, presiona la tecla "R" en tu teclado.

Siempre estoy explorando nuevas ideas para predecir el futuro del mercado. Cada vez que descubro un nuevo método o algoritmo que funcione, lo incorporo al producto. Aprecio tu apoyo para permitirme seguir desarrollando esta oferta única.

Comentarios 3
Leon Hans Morten Voige
419
Leon Hans Morten Voige 2023.08.09 18:14 
 

I absolutely love it. You don't need to waste your time searching out all the support and resistance levels. For me it is very very lucrative trading the 1 hr timeframe with this indicator. Especially on pairs that are more trendy. Even BTC trading is easily possible with this indicator. Absolutely great!

31416
282
31416 2023.04.10 11:18 
 

So far it looks intuitive. I will try to update while gaining confidence and expertise with it. Thanks.

Update after a month using it: confirmed. Very useful.

Productos recomendados
Description : Rainbow EA MT5 is a simple Expert advisor based on   Rainbow MT5 indicator witch is based on Moving average with period 34. The indicator is incorporated in the EA, therefore, it is not required for the EA to operate, but if you wish, you can download it from   my product page . The Expert Advisor settings are as follows : Suitable for Timeframes up to H1 The parameters below can be set according to your trading rules. StopLoss ( Stop Loss in pips) TakeProfit ( Take Profit in pi
¡El nivel Premium es un indicador único con más del 80% de precisión de predicciones correctas! ¡Este indicador ha sido probado por los mejores especialistas en comercio durante más de dos meses! ¡El indicador del autor no lo encontrarás en ningún otro lugar! ¡A partir de las capturas de pantalla, puede ver por sí mismo la precisión de esta herramienta! 1 es ideal para operar con opciones binarias con un tiempo de vencimiento de 1 vela. 2 funciona en todos los pares de divisas, accion
Noize Absorption Index - is the manual trading system that measures the difference of pressure between bears forces and bulls forces. Green line - is a noize free index that showing curent situation. Zero value of index shows totally choppy/flat market.Values above zero level shows how powerfull bullish wave is and values below zero measures bearish forces.Up arrow appears on bearish market when it's ready to reverse, dn arrow appears on weak bullish market, as a result of reverse expectation.
Note : i only sell this EA on MQL5, any other sellers is fake. Orbit Rage Final, a cutting-edge trading strategy meticulously designed around the bull/bear candle approach and divergence analysis. This powerful tool is engineered to empower you to shape the life you desire. To embark on this transformative journey, simply download and seamlessly integrate it into your MetaTrader 4 platform by placing it in the experts advisors folder. Orbit Rage Final revolutionizes trading by offering a risk-f
Owl Smart Levels MT5
Sergey Ermolov
4.47 (36)
Versión MT4  |  FAQ El Indicador Owl Smart Levels es un sistema comercial completo dentro de un indicador que incluye herramientas de análisis de mercado tan populares como los fractales avanzados de Bill Williams , Valable ZigZag que construye la estructura de onda correcta del mercado y los niveles de Fibonacci que marcan los niveles exactos de entrada. en el mercado y lugares para tomar ganancias. Descripción detallada de la estrategia Instrucciones para trabajar con el indicador Asesor de c
Was: $249  Now: $99   Market Profile defines a number of day types that can help the trader to determine market behaviour. A key feature is the Value Area, representing the range of price action where 70% of trading took place. Understanding the Value Area can give traders valuable insight into market direction and establish the higher odds trade. It is an excellent addition to any system you may be using. Inspired by Jim Dalton’s book “Mind Over Markets”, this indicator is designed to suit the
PipFinite Exit EDGE MT5
Karlo Wilson Vendiola
4.89 (35)
Did You Have A Profitable Trade But Suddenly Reversed? In a solid strategy, exiting a trade is equally important as entering. Exit EDGE helps maximize your current trade profit and avoid turning winning trades to losers. Never Miss An Exit Signal Again Monitor all pairs and timeframes in just 1 chart www.mql5.com/en/blogs/post/726558 How To Trade You can close your open trades as soon as you receive a signal Close your Buy orders if you receive an Exit Buy Signal. Close your Sell orde
El indicador construye cotizaciones actuales, que se pueden comparar con las históricas y, sobre esta base, hacer un pronóstico de movimiento de precios. El indicador tiene un campo de texto para una navegación rápida a la fecha deseada. Opciones: Símbolo - selección del símbolo que mostrará el indicador; SymbolPeriod - selección del período del cual el indicador tomará datos; IndicatorColor - color del indicador; HorisontalShift: cambio de cotizaciones dibujadas por el indicador
Indicator and Expert Adviser  EA Available in the comments section of this product. Download with Indicator must have indicator installed for EA to work. Mt5 indicator alerts for bollinger band and envelope extremes occurring at the same time. Buy signal alerts occur when A bullish candle has formed below both the lower bollinger band and the lower envelope  Bar must open and close below both these indicators. Sell signal occur when A bear bar is formed above the upper bollinger band and upp
Cumulative delta indicator As most traders believe, the price moves under the pressure of market buying or selling. When someone redeems an offer standing in the cup, the deal is a "buy". If someone pours into the bid standing in the cup - the deal goes with the direction of "sale". The delta is the difference between purchases and sales. A cumulative delta - the difference between the cumulative sum of purchases and sales for a certain period of time. It allows you to see who is currently contr
Una de las secuencias numéricas se llama "Secuencia de incendios forestales". Ha sido reconocida como una de las secuencias nuevas más bellas. Su característica principal es que esta secuencia evita tendencias lineales, incluso las más cortas. Es esta propiedad la que formó la base de este indicador. Al analizar una serie de tiempo financiera, este indicador intenta rechazar todas las opciones de tendencia posibles. Y solo si falla, entonces reconoce la presencia de una tendencia y da la señal
Gioteen Volatility Index (GVI) - your ultimate solution to overcoming market unpredictability and maximizing trading opportunities. This revolutionary indicator helps you in lowering your losing trades due to choppy market movements. The GVI is designed to measure market volatility, providing you with valuable insights to identify the most favorable trading prospects. Its intuitive interface consists of a dynamic red line representing the volatility index, accompanied by blue line that indicate
Pullback Hunter
Anton Polkovnikov
PULLBACK HUNTER (CAZADOR DE RETROCESOS) ¿Cuál es el último sueño de todo comerciante? Para ver sin demora dónde se producirá el retroceso. Por supuesto, es una especie de magia, aunque... nada es imposible. Pero mientras tanto he preparado para usted un indicador que marca en tiempo real el final de la corrección al movimiento actual o en pocas palabras - capta los retrocesos. ¿Cuál es la idea principal? Mucha gente practica los rebotes cuando el precio se mueve en la dirección de la posición ab
Este innovador indicador de medición de la fuerza de la moneda de INFINITY es un ayudante indispensable para los revendedores y comerciantes que negocian en el largo plazo. El sistema de Análisis de fortaleza / debilidad de las monedas ha sido conocido y utilizado en el mercado por los principales operadores del mundo. Cualquier comercio de arbitraje no está completo sin este análisis. Nuestro indicador determina fácilmente la fuerza de las monedas subyacentes entre sí. Muestra gráficos de líne
The standard Bollinger Bands indicator has been improved by integrating additional indications from the Standard Deviation indicator (StdDev), which gives an additional filter for confirming trading signals. In addition, the color of the indicator's lines shows the beginning of a trend, its development and exhaustion. This indicator has a signal block that notifies the trader of the beginning of the trend on any time frame to which it is attached. Settings Type of messages - select the type of
Your Trend Friend
Luigi Nunes Labigalini
The trend is your friend! Look at the color of the indicator and trade on that direction. It does not  repaint. After each candle is closed, that's the color of the trend. You can focus on shorter faster trends or major trends, just test what's most suitable for the symbol and timeframe you trade. Simply change the "Length" parameter and the indicator will automatically adapt. You can also change the color, thickness and style of the lines. Download and give it a try! There are big movements
Fractal 358 Plus
Renato Fridschtein
Fractal 358 Plus is a predictive indicator that provides the clearest sight of price movements. Identifying graphic patterns such as Caixote (Crate), Pivot and Inside Candle , it shows entries and exits spots, as well as threats to your trades in the markets. It comes ready to use with B3 Mini Index (WIN$ series) and can be adjusted to use with any asset and timeframe. Fractal 358 unravels price movement Based on the Fibonacci sequence, Fractal 358 is a new and different way of reading and un
PZ Trend Trading MT5
PZ TRADING SLU
3.67 (3)
Trend Trading es un indicador diseñado para sacar el máximo provecho posible de las tendencias que tienen lugar en el mercado, mediante el cronometraje de retrocesos y rupturas. Encuentra oportunidades comerciales al analizar qué está haciendo el precio durante las tendencias establecidas. [ Guía de instalación | Guía de actualización | Solución de problemas | FAQ | Todos los productos ] Opere en los mercados financieros con confianza y eficiencia Aproveche las tendencias establecidas sin s
Banana Binary MT5 Signal
Nirundorn Promphao
1 (1)
Promotion $66 lifetime for you. The principle of this indicator is very simple: detecting the trend with Moving Average, then monitoring the return point of graph by using the crossing of Stochastic Oscillator and finally predicting BUY and SELL signal with arrows, alerts and notifications. The parameters are fixed and automatically calculated on each time frame. Example: If you install indicator on EURUSD, timeframe M5: the indicator will detect the main trend with the Moving Average on this
LT Rainbow Trend
Thiago Duarte
5 (1)
Do you, like me, like to trade with the trend? Then this indicator will help you! Rainbow Trend is a trend indicator, which uses several Moving Averages on the chart. It measures different trend strenght zones for different periods: very long term, long term, mid term, short term and very short term. Each zone has its color, and it is possible to have sound alert when the prices leaves a zone and enters another. Its configuration is very simple. If you find any bug or have any suggestions, co
Point Black
Ignacio Agustin Mene Franco
Pack Black Card indicador 5/1  Point black  cuenta con la estrategia de bollingers profesionales donde cada flecha te da una señal distinta de entrada .  sirve asta para operar en m1 y en d1  sirve para hacer scalping y intraday ,  modificado para los mercados de forex !  apto para todo los pares  modificado para los mercados de indices sinteticos apto para todo los pares !  Ideal para los volatilitys y jumps ! 
"Pattern 123" is an indicator-a trading system built on a popular pattern, pattern 123. This is the moment when we expect a reversal on the older trend and enter the continuation of the small trend, its 3rd impulse. The indicator displays signals and markings on an open chart. You can enable/disable graphical constructions in the settings. The indicator has a built-in notification system   (email, mobile terminal, standard terminal alert). "Pattern 123" has a table that displays signals fr
El indicador calcula y traza automáticamente los niveles de soporte y resistencia de Fibonacci, una de las herramientas más efectivas para el análisis de mercado. El cálculo utiliza los datos de precios promediados para el período y el marco de tiempo seleccionados. El mínimo y el máximo para este período se toman como inicio y final del movimiento. Los niveles de Fibonacci le permiten ver puntos de referencia potenciales, alrededor de los cuales el movimiento del precio puede ralentizarse o rev
Ante todo, vale la pena enfatizar que esta Herramienta de Trading es un Indicador No Repintado, No Redibujado y No Retrasado, lo que la hace ideal para el trading profesional. El Indicador de Conceptos de Acción del Precio Inteligente es una herramienta muy potente tanto para traders nuevos como experimentados. Combina más de 20 indicadores útiles en uno solo, combinando ideas avanzadas de trading como el Análisis del Trader del Círculo Interior y Estrategias de Trading de Conceptos de Dinero
Double HMA MTF for MT5
Pavel Zamoshnikov
5 (2)
This is an advanced multi-timeframe version of the popular Hull Moving Average (HMA) Features Two lines of the Hull indicator of different timeframes on the same chart. The HMA line of the higher timeframe defines the trend, and the HMA line of the current timeframe defines the short-term price movements. A graphical panel with HMA indicator data from all timeframes at the same time . If the HMA switched its direction on any timeframe, the panel displays a question or exclamation mark with a tex
Awesome Oscillator by Bill Williams with the ability to fine-tune and replace the averaging algorithms of the indicator, which significantly expands the possibilities of using this oscillator in algorithmic trading and brings it closer in its properties to such an indicator as the MACD. To reduce price noise, the final indicator is processed with an additional Smooth averaging. The indicator has the ability to give alerts, send mail messages and push signals when the direction of movement of th
El patrón 123 es uno de los patrones de gráficos más populares, potentes y flexibles. El patrón se compone de tres puntos de precio: un fondo, un pico o valle, y un retroceso de Fibonacci entre 38.2% y 71.8%. Un patrón se considera válido cuando el precio se rompe más allá del último pico o valle, momento en el que el indicador traza una flecha, levanta una alerta y se puede colocar el comercio. [ Guía de instalación | Guía de actualización | Solución de problemas | FAQ | Todos los productos ]
No Demand No Supply MT5
Trade The Volume Waves Single Member P.C.
No Demand No Supply   This indicator identifies   No Demand –No Supply candles  to your chart and plots volume bars colored according to the signal. It can be applied to all timeframes or to a specific one only. It can also be used as regular volume indicator  with exceptional future of WEIGHTED VOLUME. Furthermore is has an alert notification, sound and email when a signals occurs. The indicator does not repaint but the alert will come on two candles back due to the definition of No Demand No S
Este indicador le mostrará los valores TP y SL (en esa moneda) que ya configuró para cada pedido en los gráficos (cerrados a la línea de transacción/pedido) que lo ayudarán mucho a estimar sus ganancias y pérdidas para cada pedido. Y también te muestra los valores de PIP. el formato que se muestra es "Valores de moneda de nuestros valores de ganancias o pérdidas / PIP". El valor TP se mostrará en color verde y el valor SL se mostrará en color rojo. Para cualquier pregunta o más información, n
Order Book, known also as Market Book, market depth, Level 2, - is a dynamically updated table with current volumes of orders to buy and to sell specific financial instument at price levels near Bid and Ask. MetaTrader 5 provides the means for receiving market book from your broker, but in real time only, without access to its history. The indicator OrderBook Cumulative Indicator accumulates market book data online and visualizes them on the chart. In addition, the indicator can show the market
Los compradores de este producto también adquieren
TrendMaestro5
Stefano Frisetti
note: this indicator is for METATRADER4, if you want the version for METATRADER5 this is the link:  https://www.mql5.com/it/market/product/108106 TRENDMAESTRO recognizes a new TREND in the bud, he never makes mistakes. The certainty of identifying a new TREND is priceless. DESCRIPTION TRENDMAESTRO identifies a new TREND in the bud, this indicator examines the volatility, volumes and momentum to identify the moment in which there is an explosion of one or more of these data and therefore the mome
Bill Williams Advanced
Siarhei Vashchylka
5 (3)
Bill Williams Advanced is designed for automatic chart analysis using Bill Williams' "Profitunity" system. The indicator analyzes four timeframes at once. Manual (Be sure to read before purchasing) Advantages 1. Automatically analyzes the chart using the "Profitunity" system of Bill Williams. The found signals are placed in a table in the corner of the screen. 2. Equipped with a trend filter based on the Alligator indicator. Most of the system signals are recommended to be used only accordi
PZ Swing Trading MT5
PZ TRADING SLU
5 (4)
Swing Trading es el primer indicador diseñado para detectar oscilaciones en la dirección de la tendencia y posibles oscilaciones de reversión. Utiliza el enfoque de intercambio de línea de base, ampliamente descrito en la literatura comercial. El indicador estudia varios vectores de precios y tiempos para rastrear la dirección de la tendencia agregada y detecta situaciones en las que el mercado está sobrevendido o sobrecomprado y listo para corregir. [ Guía de instalación | Guía de actualización
Professional Scalping Tool on Deriv Attention! The indicator will be sold in limited quantities!!! Description: This trading indicator is designed for professional traders focused on scalping. Designed with the market in mind, it provides highly accurate spike trading signals. It works on the M1 timeframe and supports the following symbols: Boom 300 Index, Boom 500 Index, Boom 1000 Index, Crash 300 Index, Crash 500 Index, Crash 1000 Index. Functional Features: - Direction: - Trading is ca
IVISTscalp5
Vadym Zhukovskyi
5 (3)
Te presentamos el indicador iVISTscalp5, que no solo es único sino también efectivo en operaciones de trading. Este indicador se basa en datos temporales y es el resultado de muchos años de experiencia y análisis profundo de los mercados financieros. El indicador iVISTscalp5 es una excelente herramienta para el trading manual. La conveniencia, simplicidad y visualización, toda la complejidad está oculta en su interior. Hemos simplificado al máximo la configuración y uso del indicador iVISTscalp5
Weis Wave with Alert MT5
Trade The Volume Waves Single Member P.C.
4.93 (15)
Rental/Lifetime Package Options and Privileges  * For optimum results the yearly or lifetime package is suggested due to live training ! Rent Monthly Six Months   Yearly/Lifetime Weis Wave with Speed with Alert+Speed Index x x x Manual  x x x Quick Set up Video x x x Blog x x x Lifetime Updates x x x Setup and Training Material x x Free Rectangle Break Alert Tool      x Discord Access Channel "The SI traders" x 2-hour live methodology training x How to trade with it:    http://
The indicator is designed to close positions on the market in time. For example: to take profits ahead of schedule if the price has not reached TakeProfit, and the market is turning around. The indicator analyzes the momentum, not the trend. He does not give any information about the trend. The indicator is well suited for finding divergence. The Ershov 38 Parrots indicator dynamically adjusts to the market and detects price movement impulses of medium and high amplitude. It almost does not rea
VTrende Pro
Andrii Diachenko
5 (1)
VTrende Pro - MTF indicator for trend trading with a display panel for MT5 *** Videos can be translated into any language using subtitles (video language - Russian) Although the signals of the VTrende Pro indicator can be used as signals of a full-fledged trading system, it is recommended to use them in conjunction with the Bill Williams TS. VTrende Pro is an extended version of the VTrende indicator. Difference between Pro version and VTrende: - Time zones - Signal V - signal 1-2 waves
Multi-currency, multi-timeframe, harmonic pattern indicator AB = CD. Supports sending push notifications about signals to a mobile device, messages on e-mail, as well as messages using alerts on all available currency pairs and timeframes. This indicator was based on the indicator Harmonic ABCD Universal. Version for MetaTrader 5:  https://www.mql5.com/en/market/product/44972 . See also: Harmonic ABCD Universal for MetaTrader 4 . Using modern software development methods has made the indicator a
Este es posiblemente el indicador de reconocimiento automático de formación de precios más completo que puede encontrar para la plataforma MetaTrader. Detecta 19 patrones diferentes, toma las proyecciones de Fibonacci tan en serio como usted, muestra la zona de reversión potencial (PRZ) y encuentra niveles adecuados de stop-loss y take-profit. [ Guía de instalación | Guía de actualización | Solución de problemas | FAQ | Todos los productos ] Detecta 19 formaciones de precios armónicos difer
NIVELES CRITICOS DE RAD Los procesos de Acumulación y Distribución de Volumen generan los soportes y resistencias naturales del mercado.  A medida que estos proceso se generan, los niveles en los que el volumen relevante se posiciona se convierten en zonas de difíciles de franquear al alza o a la baja. El indicador RAD,   rastrea el Volumen Relevante en tiempo real, identificando los  procesos de acumulación y distribución, graficándolos como  zonas de SOPORTE o RESISTENCIA.  Mediante el uso de
Difícil de encontrar y escasa en frecuencia, las divergencias son uno de los escenarios comerciales más confiables. Este indicador busca y escanea las divergencias regulares y ocultas automáticamente usando su oscilador favorito. [ Guía de instalación | Guía de actualización | Solución de problemas | FAQ | Todos los productos ] Fácil de comerciar Encuentra divergencias regulares y ocultas Admite muchos osciladores bien conocidos Implementa señales comerciales basadas en rupturas Muestra n
"Piranha" - an autonomous trading system that determines overbought and oversold levels on the chart. Red and blue zones represent overbought and oversold levels respectively. Entry points are marked with arrows: a downward arrow in the red zone for "sell" and an upward arrow in the blue zone for "buy". The Take profit level is indicated by the green moving average. Key features: Adjusting the Take profit level as the green moving average changes position. Averaging ability when a new market e
Big Player Range
Thalles Nascimento De Carvalho
5 (2)
Bienvenido al indicador "BigPlayerRange", una herramienta de análisis técnico desarrollada para identificar áreas de interés significativas por parte de las instituciones financieras en los mercados. Este indicador proporciona un análisis preciso de los rangos de precios donde los principales participantes del mercado muestran una actividad e interés considerable. Principales características: 1. Mapeo de Áreas de Interés Institucional: "BigPlayerRange" destaca con precisión las áreas del g
Introduction to X3 Chart Pattern Scanner X3 Cherart Pattern Scanner is the non-repainting and non-lagging indicator detecting X3 chart patterns including Harmonic pattern, Elliott Wave pattern, X3 patterns, and Japanese Candlestick patterns. Historical patterns match with signal patterns. Hence, you can readily develop the solid trading strategy in your chart. More importantly, this superb pattern scanner can detect the optimal pattern of its kind. In addition, you can switch on and off individu
INDICADOR basado en INTELIGENCIA ARTIFICIAL que genera posibles entradas de compra y venta de opciones binarias. El indicador funciona con 3 estrategias diferentes: 1) al leer volúmenes, envía una señal cuando el precio debería revertirse 2) a través de la divergencia entre precio y volumen, envía una señal de cuándo la tendencia debe continuar o revertirse 3) a través de la convergencia entre precio y volumen, envía una señal de cuándo debe continuar la tendencia. el indicador fu
El Indicador de Cuadrados de Gann es una herramienta poderosa de análisis de mercado basada en el artículo "Fórmula Matemática para Predicciones de Mercado" escrito por W.D. Gann, que se basa en conceptos matemáticos para el análisis. Incorpora elementos de las técnicas de Gann relacionadas con los cuadrados de 144, 90 y 52, así como el cuadrado de 9. Además, incluye el método del  sobre cómo combinar el cuadrado de 9 con canales y patrones de estrellas. Manual del Usuario y Modo de Uso: Antes d
SMCpro
Arief
5 (1)
SMCpro MT5  Original Price  $440   ---  Currently Price  40% OFF  ( for unlimited use ) Hello World! Introducing.. SMCpro tool and Indicator for  MetaTrader 5 , a cutting-edge feature designed to revolutionize your trading experience. With innovative ICT Smart Money Concept, you gain unparalleled insight into market dynamics, empowering you to make informed trading decisions like never before. Built on the foundation of advanced algorithms and real-time data analysis, SMCpro tool and Indicat
PZ Day Trading MT5
PZ TRADING SLU
2.83 (6)
Este indicador detecta reversiones de precios en forma de zig-zag, utilizando solo análisis de acción de precios y un canal donchian. Ha sido diseñado específicamente para el comercio a corto plazo, sin repintar ni pintar en absoluto. Es una herramienta fantástica para comerciantes astutos con el objetivo de aumentar el tiempo de sus operaciones. [ Guía de instalación | Guía de actualización | Solución de problemas | FAQ | Todos los productos ] Increíblemente fácil de comerciar Proporciona
Este indicador es un método de análisis de mercado basado en el artículo "Fórmula matemática para predicciones de mercado" escrito por W.D. Gann según los métodos del cuadrado de nueve y el cuadrado de 144. Manual de usuario: Add Your review And contact us to get it Puede comprar la versión MT4 completa en: https://www.mql5.com/en/market/product/15316 Puede probar en MT4 gratis: https://www.mql5.com/en/market/product/15320?source=Site +Profile+Seller#!tab=reviews Est
Elliot Waves Analyzer Pro
Viktor Weidenthal
3.25 (4)
Elliot Waves Analyzer Pro calculates Elliot Waves to Help Identify Trend direction and Entry Levels. Mainly for Swing Trading Strategies. Usually one would open a Position in trend direction for Wave 3 or a Correction for Wave C . This Indicator draws Target Levels for the current and next wave. Most important Rules for Elliot Wave Analysis are verified by the Indicator.  The Pro version analyzes Multiple Timeframes and shows the Subwaves and Target-Levels.   For an Overview  " Elliot Waves Anal
Elliott Wave Trend was designed for the scientific wave counting. This tool focuses to get rid of the vagueness of the classic Elliott Wave Counting using the guideline from the template and pattern approach. In doing so, firstly Elliott Wave Trend offers the template for your wave counting. Secondly, it offers Wave Structural Score to assist to identify accurate wave formation. It offers both impulse wave Structural Score and corrective wave Structure Score. Structural Score is the rating to sh
Good day! I present to you a trading technical indicator for Deriv broker synthetic indices. This indicator ONLY works with the following indices: Boom 300 Index Boom 500 Index Boom 1000 Index Crash 300 Index Crash 500 Index Crash 1000 Index The indicator was created to give signals to open medium-term trades in the direction of Spikes. But you can open trades in the opposite direction to Spikes, at your own risk. Trade only on M1. Other TFs do not guarantee the correct operation of the indic
Introduction Excessive Momentum Indicator is the momentum indicator to measure the excessive momentum directly from raw price series. Hence, this is an extended price action and pattern trading. Excessive Momentum Indicator was originally developed by Young Ho Seo. This indicator demonstrates the concept of Equilibrium Fractal Wave and Practical Application at the same time. Excessive Momentum detects the market anomaly. Excessive momentum will give us a lot of clue about potential reversal and
Tatino Super Signals is Non Repaint Indicator for Binary Option trading and Forex trading. Recommendations: Timeframe: All timeframes. For best results we recommend using it on M1, M5 and M15 timeframes. Currency pairs: All Pairs Account type: All Type Broker time: Any Brokers : Alls Binary Trading : Expired 1 Candle Buffer Buy=1, Sell=0, Entry Next Candle Recommended Forex trading stop loss : 15 pips Recommended  Forex tradingTake profit levels : 15 pips Specifications: Does not repaint  
Smooth price for Monarch
Konstantin Gruzdev
5 (1)
The Smooth Price technical indicator is used for plotting a smoothed line as close to the price of the financial instrument as possible, and serves to eliminate its noise components. The indicator is part of the Monarch trading system, but here it is presented as an independent technical analysis tool. The indicator is based on the cluster digital filter , which, unlike the ClusterSMA , is applied directly to the price time series. Smooth Price does not redraw (except the very last, zero bar) an
How to use Pair Trading Station Pair Trading Station is recommended for H1 time frame and you can use it for any currency pairs. To generate buy and sell signal, follow few steps below to apply Pair Trading Station to your MetaTrader terminal. When you load Pair Trading Station on your chart, Pair Trading station will assess available historical data in your MetaTrader platforms for each currency pair. On your chart, the amount of historical data available will be displayed for each currency pai
Indicador único que implementa un enfoque profesional y cuantitativo para el comercio de reversión a la media. Aprovecha el hecho de que el precio se desvía y vuelve a la media de manera predecible y medible, lo que permite reglas claras de entrada y salida que superan ampliamente las estrategias comerciales no cuantitativas. [ Installation Guide | Update Guide | Troubleshooting | FAQ | All Products ] Señales comerciales claras Sorprendentemente fácil de operar Colores y tamaños personalizable
This is the famous Sunflower indicator for Metatrader5. This indicator marks possible tops and bottoms on price charts. The indicator identifies tops and bottoms in the asset's price history, keep in mind that the current sunflower of the last candle repaints, as it is not possible to identify a top until the market reverses and it is also not possible to identify a bottom without the market stop falling and start rising. If you are looking for a professional programmer for Metatrader5, please
ZigZag de Suavizador
Cesar Juan Flores Navarro
Teniendo una entrada de precios suavizados, los cuales son procesador por un ZigZag en tiempo real, dando como resultado un suavizador ajustado a un ZigZag. Con valores de entrada (periodo) mayores se vuelve un poco lenta en M1,, Ideal para H1, H4, D1 Trabaja bien con otros suavizadores, ya que su intersección es ideal Al iniciar empiza con mayor precisión desde el momento de activación, siendo el historial (anterior) de referencia ----------------------------------------------------------------
Otros productos de este autor
MetaBands M5
Vahidreza Heidar Gholami
4.67 (3)
MetaBands utiliza algoritmos potentes y únicos para dibujar canales y detectar tendencias para que pueda proporcionar a los traders puntos potenciales para entrar y salir de operaciones. Es un indicador de canal junto con un potente indicador de tendencia. Incluye diferentes tipos de canales que se pueden fusionar para crear nuevos canales simplemente utilizando los parámetros de entrada. MetaBands utiliza todos los tipos de alertas para notificar a los usuarios sobre eventos del mercado. Caract
Royal Scalping Indicator M5
Vahidreza Heidar Gholami
5 (8)
My products are currently 50% off. Explore them and build your own strategy. Royal Scalping Indicator is an advanced price adaptive indicator designed to generate high-quality trading signals. Built-in multi-timeframe and multi-currency capabilities make it even more powerful to have configurations based on different symbols and timeframes. This indicator is perfect for scalp trades as well as swing trades. Royal Scalping is not just an indicator, but a trading strategy itself. Features Price A
Royal Wave Pro M4
Vahidreza Heidar Gholami
5 (3)
Royal Wave is a Trend-Power oscillator which has been programmed to locate and signal low-risk entry and exit zones. Its core algorithm statistically analyzes the market and generates trading signals for overbought, oversold and low volatile areas. By using a well-designed alerting system, this indicator makes it easier to make proper decisions regarding where to enter and where to exit trades. Features Trend-Power Algorithm Low risk Entry Zones and Exit Zones Predictions for Overbought and Over
MetaBands M4
Vahidreza Heidar Gholami
5 (2)
MetaBands utiliza algoritmos potentes y únicos para dibujar canales y detectar tendencias para que pueda proporcionar a los traders puntos potenciales para entrar y salir de operaciones. Es un indicador de canal junto con un potente indicador de tendencia. Incluye diferentes tipos de canales que se pueden fusionar para crear nuevos canales simplemente utilizando los parámetros de entrada. MetaBands utiliza todos los tipos de alertas para notificar a los usuarios sobre eventos del mercado. Caract
Smart Channel M5
Vahidreza Heidar Gholami
5 (1)
The trend in the market can be predicted using trend lines but the problem is you don’t know where exactly the price is going to touch the trend line where you can put your pending orders on. Smart Channel Expert Advisor makes it possible to put an advanced channel around the price data, which can be configured to handle placing orders, opening and closing positions, managing risk per trade, spread, slippage, and trailing stop-loss and take-profit automatically. Features Money Management (Calcul
Royal Wave Pro M5
Vahidreza Heidar Gholami
3.5 (4)
Royal Wave is a Trend-Power oscillator which has been programmed to locate and signal low-risk entry and exit zones. Its core algorithm statistically analyzes the market and generates trading signals for overbought, oversold and low volatile areas. By using a well-designed alerting system, this indicator makes it easier to make proper decisions regarding where to enter and where to exit trades. Features Trend-Power Algorithm Low risk Entry Zones and Exit Zones Predictions for Overbought and Over
MetaTrend M5
Vahidreza Heidar Gholami
5 (2)
Meta Trend Indicator is an efficient way to forecast and detect the trend in any market. It reveals the trend, support and resistance levels, volatility and the maximum potential target, all in one indicator. To adapt to the price and to decrease consecutive trend failures, the internal trend detector algorithm studies the market and dynamically chooses the right values for the internal parameters. This indicator is a perfect trend filter for any strategy or expert advisor. Features Super Adapti
Smart Channel M4
Vahidreza Heidar Gholami
The trend in the market can be predicted using trend lines but the problem is you don’t know where exactly the price is going to touch the trend line where you can put your pending orders on. Smart Channel Expert Advisor makes it possible to put an advanced channel around the price data, which can be configured to handle placing orders, opening and closing positions, managing risk per trade, spread, slippage, and trailing stop-loss and take-profit automatically. Features Money Management (Calcul
MetaForecast M4
Vahidreza Heidar Gholami
5 (1)
MetaForecast predice y visualiza el futuro de cualquier mercado basándose en las armonías de los datos de precios. Aunque el mercado no siempre es predecible, si existe un patrón en el precio, MetaForecast puede predecir el futuro con la mayor precisión posible. En comparación con otros productos similares, MetaForecast puede generar resultados más precisos al analizar las tendencias del mercado. Parámetros de entrada Past size (Tamaño del pasado) Especifica el número de barras que MetaForecas
Royal Scalping Indicator M4
Vahidreza Heidar Gholami
4.17 (6)
Royal Scalping Indicator is an advanced price adaptive indicator designed to generate high-quality trading signals. Built-in multi-timeframe and multi-currency capabilities make it even more powerful to have configurations based on different symbols and timeframes. This indicator is perfect for scalp trades as well as swing trades. Royal Scalping is not just an indicator, but a trading strategy itself. Features Price Adaptive Trend Detector Algorithm Multi-Timeframe and Multi-Currency Trend Low
MetaTrend M4
Vahidreza Heidar Gholami
5 (1)
Meta Trend Indicator is an efficient way to forecast and detect the trend in any market. It reveals the trend, support and resistance levels, volatility and the maximum potential target, all in one indicator. To adapt to the price and to decrease consecutive trend failures, the internal trend detector algorithm studies the market and dynamically chooses the right values for the internal parameters. This indicator is a perfect trend filter for any strategy or expert advisor. Features Super Adapti
Filtro:
Leon Hans Morten Voige
419
Leon Hans Morten Voige 2023.08.09 18:14 
 

I absolutely love it. You don't need to waste your time searching out all the support and resistance levels. For me it is very very lucrative trading the 1 hr timeframe with this indicator. Especially on pairs that are more trendy. Even BTC trading is easily possible with this indicator. Absolutely great!

Vahidreza Heidar Gholami
3699
Respuesta del desarrollador Vahidreza Heidar Gholami 2023.08.09 22:12
I'm glad you've shared your thoughts and experiences. Thank you.
Yahia Ismail Ibrahim El Mughrabi
917
Yahia Ismail Ibrahim El Mughrabi 2023.05.20 21:19 
 

Great work much appreciated, it very good tool to confirm strategy

Vahidreza Heidar Gholami
3699
Respuesta del desarrollador Vahidreza Heidar Gholami 2023.05.21 10:05
I appreciate you taking the time to share your experience. Such feedback is truly invaluable to me, and it motivates me to improve the product with each new version. Thank you!
31416
282
31416 2023.04.10 11:18 
 

So far it looks intuitive. I will try to update while gaining confidence and expertise with it. Thanks.

Update after a month using it: confirmed. Very useful.

Vahidreza Heidar Gholami
3699
Respuesta del desarrollador Vahidreza Heidar Gholami 2023.04.11 01:47
Great! Thank you for your interest in my products.
Respuesta al comentario
Versión 2.2 2024.04.19
Functionalities for saving and loading trained models have been added.
Versión 2.1 2024.04.18
Minor bug fixes
Versión 2.0 2024.04.17
1. A new forecasting method based on neural networks has been added
2. Minor bug fixes
Versión 1.6 2023.09.21
Minor updates and improvements.
Versión 1.5 2023.05.03
New capabilities have been added, along with bug fixes.