AC Pivot Panel
- Indicadores
- Atefe Shoopani
- Versión: 1.3
- Actualizado: 18 febrero 2023
- Activaciones: 5
AC Pivot Panel
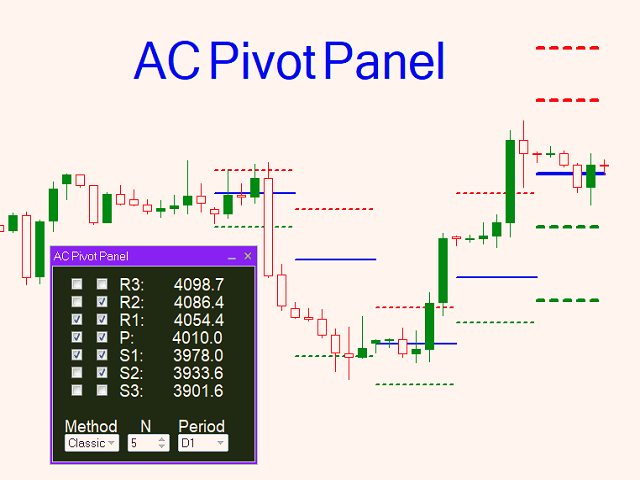
AC Pivot Panel is a pivot point indicator including favorite selection panel accessible in the chart. For pivot traders, It is well convenient to easily and quickly can adjust their pivots setting in the chart. To reaching this goal, a panel has been considered to user can easily switch to each pivot levels by different method and time period.
In the current version:
- All pivots including supports and resistance can be selected to display or disappear in the chart just by checking or unchecking their name in the panel.
- The indicator supports three methods for pivot points calculation: Classic, Woodie and Camarilla.
- The time period for pivot calculation can be selected: H1, H2, H3, H4, H8, H12, D1 and MN1, that they can easily be selected from selection panel.
- Moreover, the line colors and styles, can be set in the indicator setting.
A free version is available here:https://www.mql5.com/en/market/product/93098?source=Site+Profile+Seller
- MT4 version is published here: https://www.mql5.com/en/market/product/93473?source=Site+Profile+Seller
Your feedback and rating would be greatly appreciated.
Every suggestion for improving the indicator greatly would be appreciated.

very useful product. things are predictive enough with the panel. thanks to developer.