Desafortunadamente "AC Chart Indicator Demo" no está disponible.
Usted puede ver los demás productos Bohdan Kasyanenko:

The indicator displays signals according to the strategy of Bill Williams on the chart. Demo version of the indicator has the same features as the paid, except that it can work only on a demo account .
Signal "First Wise Man" is formed when there is a divergent bar with angulation. Bullish divergent bar - with lower minimum and closing price in the upper half. Bearish divergent bar - higher maximum and the closing price at the bottom half. Angulation is formed when all three lines of Alligat
FREE

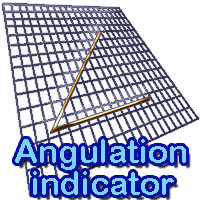
El indicador se basa en las líneas del gráfico de angulación, que le ayudará a decidirse a entrar en el mercado o quedarse fuera de ella. Se utiliza para filtrar la señal de "First Wise Man" que se describe en la estrategia de Bill Williams.
Este indicador dispalys angulación para cualquier barra que se forma después de cruzar la boca del cocodrilo (no sólo para los B/D/B).
Ajustes:
◾ Show angulation lines - Dibujar líneas de angulación.
◾ Show info - mostrar información adicional (gr
FREE

The indicator displays signals according to the strategy of Bill Williams on a chart:
1. Signal "First Wise Man" is formed when there is a divergent bar with angulation. A bullish divergent bar has a lower minimum and the closing price in its upper half. A bearish divergent bar has a higher maximum and the closing price at the bottom half. Angulation is formed when all three lines of Alligator are intertwined, and the price has gone up significantly(or downwards). A valid bullish/bearish div

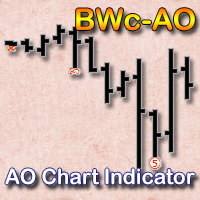
Indicator displays signals of the Awesome Oscillator on the chart according to the strategy of Bill Williams:
Signal "Saucer" - is the only signal to buy (sell), which is formed when the Awesome Oscillator histogram is above (below) the zero line. A "Saucer" is formed when the histogram changes its direction from descending to ascending (buy signal) or from ascending to descending (sell signal). In this case all the columns AO histogram should be above the zero line (for a buy signal) or bel

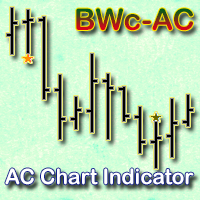
El indicador muestra en las señales de gráficos de Acelerador oscilador (AC) de acuerdo con las estrategias de Bill Williams.
Gráfico de barras de AC es la diferencia entre el valor de 5/34, de la conducción de la fuerza gráfica de barras y el promedio móvil simple de 5 periodos, tomada a partir de ese gráfico de barras.
Interpretación de la Acelerador de oscilador (AC) se basa en las siguientes reglas - Si de CA es mayor que la línea de cero, se considera que la aceleración continuará el

Trading volume and volatility change for different currency pairs, depending on the movement of the clock hands. You will be able to trade more efficiently if you know which currency pairs are at the center of attention at one time or another. Timing plays a very big role when trading currencies. The indicator shows the trading sessions of the largest exchanges in the world. The operating time is displayed in the form of a countdown before the opening time and the closing time according to UTC (

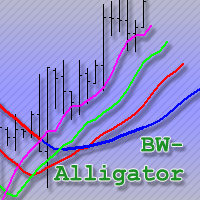
An improved version of the classic Alligator indicator by Bill Williams.
Description The Alligator technical indicator is a combination of moving averages (balance lines). Blue line (Alligator Jaw) is a 13-period smoothed moving average, shifted by 8 bars into the future; Red line (Alligator Teeth) is an 8-period smoothed moving average, shifted by 5 bars into the future; Green line (Alligator Lips) is a 5-period smoothed moving average, shifted by 3 bars into the future; Purple line (Fast Gat