• Información general
  • Comentarios
  • Discusión

Dual RSI

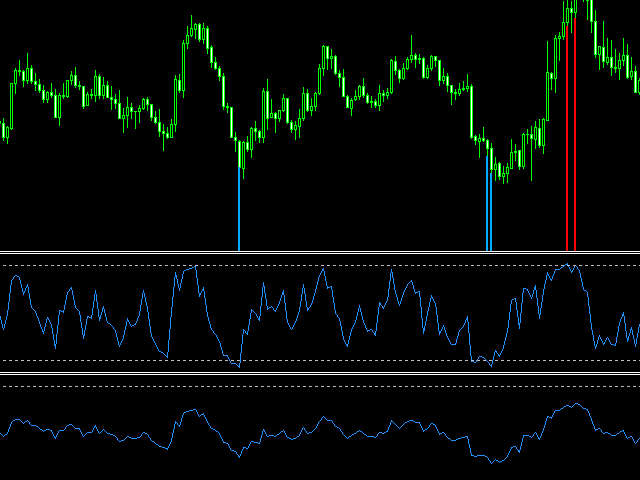
Indicator alerts for Dual Relative strength index rsi.

  • Large rsi preset at 14 is below 30
  • small rsi preset at 4 is below 10

for buy bullish signals .


  • Large rsi preset are 14 is above 70
  • small rsi preset at 4 is above 90

for sell bearish signals .

  • Includes mobile and terminal alerts.

draws lines when alerts.


This indicator can help identify extremes and then the tops or bottoms of those extremes .

Productos recomendados
Follow The Line MT5
Oliver Gideon Amofa Appiah
4.4 (30)
This indicator obeys the popular maxim that: "THE TREND IS YOUR FRIEND" It paints a GREEN line for BUY and also paints a RED line for SELL. (you can change the colors). It gives alarms and alerts of all kinds. IT DOES NOT REPAINT and can be used for all currency pairs and timeframes. Yes, as easy and simple as that. Even a newbie can use it to make great and reliable trades. NB: For best results, get my other premium indicators for more powerful and reliable signals. Get them here: https://www.m
FREE
LT Donchian Channel
Thiago Duarte
4.75 (4)
Donchian Channel is an indicator created by Richard Donchian. It is formed by taking the highest high and the lowest low of the last specified period in candles. The area between high and low is the channel for the chosen period. Its configuration is simple. It is possible to have the average between the upper and lower lines, plus you have alerts when price hits one side. If you have any questions or find any bugs, please contact me. Enjoy!
FREE
Important Lines
Terence Gronowski
4.88 (26)
Indicador de líneas importantes (M1 - M15) Este indicador muestra Líneas pivote, Día anterior alta y baja, Cierre día anterior y el mínimo y máximo de la hora anterior. Simplemente tiene que arrastrar ese único indicador al diagrama para tener todas esas líneas importantes. Puede evitar cargar muchos indicadores individuales. ¿Por qué ciertas líneas son tan importantes cuando se comercia? El día a día, alto y bajo: estos son observados por los comerciantes que comercian en un gráfico dia
FREE
What is this indicator? This indicator is the MACD (Moving Average Convergence/Divergence) supporting Virtual Trading mode of  Knots Compositor . When the mode is turned on, the indicator will be recalculated based on the displayed candlesticks. When the mode is turned off, the indicator will be recalculated based on the original chart candlesticks. Types of the applied price - Close - Open - High - Low - Median Price (HL/2) - Typical Price (HLC/3) - Weighted Price (HLCC/4) KC-Indicators
FREE
Mitimom
Danil Poletavkin
The indicator is based on Robert Miner's methodology described in his book "High probability trading strategies" and displays signals along with momentum of 2 timeframes. A Stochastic oscillator is used as a momentum indicator. The settings speak for themselves period_1 is the current timeframe, 'current' period_2 is indicated - the senior timeframe is 4 or 5 times larger than the current one. For example, if the current one is 5 minutes, then the older one will be 20 minutes The rest of the
FREE
Free automatic Fibonacci is an indicator that automatically plots a Fibonacci retracement based on the number of bars you select on the BarsToScan setting in the indicator. The Fibonacci is automatically updated in real time as new highest and lowest values appears amongst the selected bars. You can select which level values to be displayed in the indicator settings. You can also select the color of the levels thus enabling the trader to be able to attach the indicator several times with differe
FREE
Are you tired of drawing trendlines every time you're analyzing charts? Or perhaps you would like more consistency in your technical analysis. Then this is for you. This indicator will draw trend lines automatically when dropped on a chart. How it works Works similar to standard deviation channel found on mt4 and mt5. It has 2 parameters: 1. Starting Bar 2. Number of bars for calculation The   starting bar   is the bar which drawing of the trend lines will begin, while the   number of bars for c
FREE
PZ Penta O MT5
PZ TRADING SLU
4 (6)
The Penta-O is a 6-point retracement harmonacci pattern which usually precedes big market movements. Penta-O patterns can expand and repaint quite a bit. To make things easier this indicator implements a twist: it waits for a donchian breakout in the right direction before signaling the trade. The end result is an otherwise repainting indicator with a very reliable trading signal. The donchian breakout period is entered as an input. [ Installation Guide | Update Guide | Troubleshooting | FAQ | A
FREE
La esencia del sistema consiste en la identificación del momento de formación de la vela compuesta "de vuelta" con características determinadas (tamaño de la vela en puntos, estructura de sombras).En el análisis de las velas japonesas el análogo de estas velas de vuelta son "Martillo" (Hammer) y "Hombre colgado" (Hanging Man), pero en este sistema el cuerpo de la vela no tiene que ser obligatoriamente pequeño, y la vela resultante se construye de varias velas. Parámetros de entrada del sistema:
FREE
This indicator is a zero-lag indicator and displays  strength of trend change . True Trend  Oscillator Pro works best in combination with True Trend Moving Average Pro that displays exact trend as is. Oscillator value is exact price change in given direction of the trend. True Trend Moving Average Pro: https://www.mql5.com/en/market/product/103586 If you set PERIOD input parameter to 1 this indicator becomes a sharpshooter for binary options. Developers can use True Trend Oscillator in E
FREE
Rainbow MT5
Jamal El Alama
4.33 (3)
Description : Rainbow MT5 is a technical indicator based on Moving Average with period 34 and very easy to use. When price crosses above MA and MA changes color to green, then this is a signal to buy. When price crosses below MA and MA changes color to red, then this is a signal to sell. The Expert advisor ( Rainbow EA MT5 ) based on Rainbow MT5 indicator is now available here . MT4 version is available here .
FREE
This is a free version of the indicator, the period between the vertical lines is always 30 bars. In the paid version the period can be set by user, so a configuration with many ThreePointsChannel indicators with different periods is possible. The principle of construction - on top of any number of bars set by the user, a channel is constructed with maximum and minimum lines so that the bars touch the maximum and minimum of the channel at exactly three points. The name of the indicator follows
FREE
A professional tool for trading - the divergence indicator between the  Stochastic and the price, which allows you to receive a signal about a trend reversal in a timely manner or catch price pullback movements (depending on the settings). The indicator settings allow you to adjust the strength of the divergence due to the angle of the  Stochastic peaks and the percentage change in price, which makes it possible to fine-tune the signal strength. The indicator code is optimized and is tested ver
FREE
Donchian Pro
Paulo Henrique Faquineli Garcia
5 (2)
The Donchian Channel Channels are among the most popular tools of technical analysis, as they visually convey to the analyst the limits within which most price movement tends to occur. Channel users know that valuable information can be obtained at any time, whether prices are in the central region of a band or close to one of the border lines. One of the best known techniques to explore these concepts is Bollinger Bands. However, John Bollinger was not the only one to research the applicatio
FREE
Cumulative Delta MT5
Evgeny Shevtsov
4.47 (57)
The indicator analyzes the volume scale and splits it into two components - seller volumes and buyer volumes, and also calculates the delta and cumulative delta. The indicator does not flicker or redraw, its calculation and plotting are performed fairly quickly, while using the data from the smaller (relative to the current) periods. The indicator operation modes can be switched using the Mode input variable: Buy - display only the buyer volumes. Sell - display only the seller volumes. BuySell -
FREE
High Low Open Close
Alexandre Borela
4.97 (35)
Si te gusta este proyecto, deja una revisión de 5 estrellas. Seguir en instagram: borelatech Este indicador dibuja los precios abiertos, altos, bajos y finales para los especificados período y se puede ajustar para una zona horaria específica. Estos son niveles importantes considerados por muchos institucionales y profesionales comerciantes y puede ser útil para que usted sepa los lugares donde podrían ser más activo. Los períodos disponibles son: Día previo. Semana anterior. Mes anteri
FREE
El indicador identifica cuando ocurre una divergencia entre el precio y un indicador u oscilador. Identifica divergencias tanto regulares como ocultas. Combinado con sus propias reglas y técnicas, este indicador le permitirá crear (o mejorar) su propio sistema poderoso. Características Puede detectar divergencias para los siguientes osciladores / indicadores:       MACD, OsMA, estocásticos, RSI, CCI, RVI, Awesome, ADX, ATR, OBV, índice compuesto, MFI y Momentum. Solo se puede seleccionar un os
FREE
This indicator is especially for the binary trading. Time frame is 1 minutes and exp time 5 or 3 minutes only. You must be use martingale 3 step. So you must put lots size is 10 % at most. You should use Mt2 trading platform to connect with my indicator to get more signal without human working. This indicator wining rate is over 80% but you may get 100% of profit by using martingale 3 step. You should use MT2 Trading Platform to connect meta trader platform and binary platform . You can get mt2
FREE
Tabajara V5
Flavio Javier Jarabeck
4.87 (38)
Metatrader 5 version of the famous Andre Machado's Tabajara indicator. If you don't know Andre Machado's Technical Analysis work you don't need this indicator... For those who need it and for those several friend traders who asked this porting from other platforms, here it is... FEATURES 8-period Moving Average 20-period Moving Average 50-period Moving Average 200-period Moving Average Colored candles according to the inflexion of the 20-period MA SETTINGS You can change the Period of all M
FREE
This is a buyer and seller aggression indicator that analyzes the shape of each candle and project this data in a histogram form. There are 4 histograms in one. On the front we have two: Upper - Buyer force. Lower - Seller force. At the background we also have two histogram, both with same color. They measure the combined strenght of buyers and sellers. This histograms can be turned off in Input Parameters. It is also possible to have the real or tick volume to help on this force measurement. IN
FREE
What is this indicator? This indicator is the RSI (Relative Strength Index) supporting Virtual Trading mode of  Knots Compositor . When the mode is turned on, the indicator will be recalculated based on the displayed candlesticks. When the mode is turned off, the indicator will be recalculated based on the original chart candlesticks. Types of the applied price - Close - Open - High - Low - Median Price (HL/2) - Typical Price (HLC/3) - Weighted Price (HLCC/4) KC-Indicators -   KC-MA   (M
FREE
Bar Color Trend
Germano Chagas
4.5 (10)
Combining the best of Price Action , Directional Movement , and Divergence/Convergence analysis, Candle Color Trend is a easy and reliable way to identify trend direction. The indicator automatically paints the candles according to the assumption that an uptrend is defined by prices that form a series of higher highs and higher lows. In contrast, a downtrend is defined by prices that form a series of lower highs and lower lows. Additionally, ADX Wilder indicator is used to measure trend weakness
FREE
HMA Color with Alerts MT5
Pavel Zamoshnikov
4.72 (50)
Hull Moving Average (HMA) is well-deservedly popular among traders because of the effective averaging of market noise and a relatively small delay. The current MetaTrader 5 version changes its color when the movement direction changes. Sound and text signals are available. It also supports sending email and push messages. It is possible to trigger a signal on the current incomplete bar, although such a signal may be canceled before completion if conditions are no longer appropriate. One of the p
FREE
Weis Waves
Flavio Javier Jarabeck
3.15 (26)
The original author is David Weis, an expert in the Wyckoff Method. The Weis Wave is a modern adaptation of the 1930's Wyckoff Method, another expert in Tape Reading techniques and Chart Analysis. Weis Waves takes market volume and stacks it into waves according to price conditions giving the trader valuable insights about the market conditions. If you want to learn more about this subject you can find tons of videos in YouTube. Just look for "The Wickoff Method", "Weis Wave" and "Volume Spread
FREE
Value Chart Candlesticks
Flavio Javier Jarabeck
4.75 (8)
The idea of a Value Chart indicator was presented in the very good book I read back in 2020 , " Dynamic Trading Indicators: Winning with Value Charts and Price Action Profile ", from the authors Mark Helweg and David Stendahl. The idea is simple and the result is pure genius: Present candlestick Price analysis in a detrended way! HOW TO READ THIS INDICATOR Look for Overbought and Oversold levels. Of course, you will need to test the settings a lot to find the "correct" one for your approach.
FREE
This indicator sums up the difference between the sells aggression and the buys aggression that occurred in each Candle, graphically plotting the waves of accumulation of the aggression volumes.   Through these waves an exponential average is calculated that indicates the direction of the business flow. Note: This indicator DOES NOT WORK for Brokers and/or Markets WITHOUT the type of aggression (BUY or SELL).   Be sure to try our Professional version with configurable features and alerts:  Agr
FREE
PZ Pivot Points MT5
PZ TRADING SLU
4.95 (22)
This indicator displays pivot points in the chart, including historical vales, and supports many calculation modes for Pivot Points and S/R levels. [ Installation Guide | Update Guide | Troubleshooting | FAQ | All Products ] It plots historical levels for backtesting purposes It allows you to select the reference timeframe It implements different Pivot Point calculation modes It implements different SR calculation modes It implements customizable colors and sizes Calculation Modes The indi
FREE
SuperTrend for MT5
Ulises Calderon Bautista
5 (1)
El popular indicador "SuperTrend" es una herramienta de análisis técnico que ayuda a identificar la dirección de una tendencia y posibles puntos de entrada o salida en los mercados financieros. El indicador se basa en el Average True Range (ATR), que mide la volatilidad del mercado en función de los rangos de precios. !Es gratuito en otras plataformas y aquí no tiene por que ser la excepción! Se utiliza comúnmente de tres maneras: Para identificar la Tendencia Actual: Cuando el precio está por e
FREE
Donchian Channel DC is the indicator of Donchian Channels, that plots maximum and minimum values of a specific period, besides mean value line. It´s possible to configure simple period for analysis and the indicator will plot all three values. You can trade with this indicator as trend or reversal, according to each strategy. Do not let to test others indicators as soon as others expert advisors.
BoxInside MT5
Evgeny Shevtsov
5 (4)
This indicator calculates the volume profile and places labels that correspond to the VAH, VAL and POC levels, for each candle individually. Indicator operation features The indicator works on the timeframes from M3 to MN, but it uses the history data of smaller periods: M1 - for periods from M3 to H1, M5 - for periods from H2 to H12, M30 - for the D1 period, H4 - for the W1 period, D1 - for the MN period. The color and location of the VAL, VAH and POC labels on the current candle are consider
FREE
Los compradores de este producto también adquieren
Atomic Analyst MT5
Issam Kassas
4.22 (9)
En primer lugar, vale la pena enfatizar que este Indicador de Trading no repinta, no redibuja y no se retrasa, lo que lo hace ideal tanto para el trading manual como para el automatizado. El Analista Atómico es un Indicador de Acción del Precio PA que utiliza la fuerza y el impulso del precio para encontrar una mejor ventaja en el mercado. Equipado con filtros avanzados que ayudan a eliminar ruidos y señales falsas, y aumentan el potencial de trading. Utilizando múltiples capas de indicadores
Primero que todo, vale la pena enfatizar que este Sistema de Trading es un Indicador No Repintado, No Redibujado y No Retrasado, lo que lo hace ideal tanto para el trading manual como para el automatizado. El "Sistema de Trading Inteligente MT5" es una solución completa de trading diseñada para traders nuevos y experimentados. Combina más de 10 indicadores premium y presenta más de 7 estrategias de trading robustas, lo que lo convierte en una opción versátil para diversas condiciones del merca
Quantum Trend Sniper
Bogdan Ion Puscasu
5 (36)
Introduciendo       Indicador Quantum Trend Sniper   , el innovador indicador MQL5 que está transformando la forma en que identificas y negocias los cambios de tendencia. Desarrollado por un equipo de comerciantes experimentados con experiencia comercial de más de 13 años,       Indicador de francotirador de tendencia cuántica       está diseñado para impulsar su viaje comercial a nuevas alturas con su forma innovadora de identificar cambios de tendencia con una precisión extremadamente alta.
Trend Screener Pro MT5
STE S.S.COMPANY
4.89 (61)
Desbloquee el poder del comercio de tendencias con el indicador Trend Screener: ¡su solución definitiva para el comercio de tendencias impulsada por lógica difusa y un sistema multidivisa!Mejore su comercio de tendencias con Trend Screener, el revolucionario indicador de tendencias impulsado por lógica difusa. Es un poderoso indicador de seguimiento de tendencias que combina más de 13 herramientas y funciones premium y 3 estrategias comerciales, lo que lo convierte en una opción versátil para co
Gold Stuff mt5
Vasiliy Strukov
4.88 (162)
Gold Stuff mt5: un indicador de tendencia diseñado específicamente para el oro, también se puede usar en cualquier instrumento financiero. El indicador no se vuelve a dibujar ni se retrasa. El marco de tiempo recomendado es H1. IMPORTANTE! Póngase en contacto conmigo inmediatamente después de la compra para obtener instrucciones y bonificación! PARÁMETROS Draw Arrow-incl.desactivado. dibujar flechas en el gráfico. Alerts-incl.desactivado.alertas de sonido. E-mail notification-incl.desacti
FX Power MT5 NG
Daniel Stein
5 (4)
Obtenga su actualización diaria del mercado con detalles y capturas de pantalla a través de nuestro Morning Briefing aquí en mql5 y en Telegram ! FX Power MT5 NG es la nueva generación de nuestro popular medidor de fuerza de divisas, FX Power. ¿Y qué ofrece este medidor de fuerza de nueva generación? Todo lo que le encantaba del FX Power original PLUS Análisis de fuerza de ORO/XAU Resultados de cálculo aún más precisos Períodos de análisis configurables individualmente Límite de cálculo persona
Advanced Supply Demand MT5
Bernhard Schweigert
4.53 (15)
¡Actualmente con 33% de descuento! ¡La mejor solución para cualquier tráder principiante o experto! Este indicador es una herramienta comercial única, de alta calidad y asequible, porque incorpora una serie de características patentadas y una nueva fórmula. Con esta actualización, podrá mostrar zonas de doble marco temporal. No solo podrá mostrar un marco temporal más alto, sino también mostrar ambos, el marco temporal del gráfico MÁS el marco temporal más alto: MOSTRANDO ZONAS ANIDADAS. A todos
RelicusRoad Pro MT5
Relicus LLC
4.81 (21)
Ahora $ 147 (aumentando a $ 499 después de algunas actualizaciones) - Cuentas ilimitadas (PC o Mac) Manual de usuario de RelicusRoad + Videos de capacitación + Acceso al grupo privado de Discord + Estado VIP UNA NUEVA MANERA DE VER EL MERCADO RelicusRoad es el indicador comercial más poderoso del mundo para divisas, futuros, criptomonedas, acciones e índices, y brinda a los comerciantes toda la información y las herramientas que necesitan para mantenerse rentables. Brindamos análisis téc
Ante todo, vale la pena enfatizar que esta Herramienta de Trading es un Indicador No Repintado, No Redibujado y No Retrasado, lo que la hace ideal para el trading profesional. El Indicador de Conceptos de Acción del Precio Inteligente es una herramienta muy potente tanto para traders nuevos como experimentados. Combina más de 20 indicadores útiles en uno solo, combinando ideas avanzadas de trading como el Análisis del Trader del Círculo Interior y Estrategias de Trading de Conceptos de Dinero
Este es un genial indicador para MT5 que ofrece señales precisas para entrar en una transacción sin redibujar. Se puede aplicar a cualquier activo financiero: fórex, criptomonedas, metales, acciones, índices. Nos dará valoraciones bastante precisas y nos dirá cuándo es mejor abrir y cerra una transacción. Eche un vistazo  al vídeo  (6:22), ¡contiene un ejemplo de procesamiento de una sola señal que ha amortizado el indicador! La mayoría de los tráders mejoran sus resultados comerciales durante l
AW Trend Predictor MT5
AW Trading Software Limited
4.76 (54)
La combinación de niveles de tendencia y ruptura en un sistema. Un algoritmo de indicador avanzado filtra el ruido del mercado, determina la tendencia, los puntos de entrada y los posibles niveles de salida. Las señales indicadoras se registran en un módulo estadístico, que le permite seleccionar las herramientas más adecuadas, mostrando la efectividad del historial de señales. El indicador calcula las marcas Take Profit y Stop Loss. Manual e instrucciones ->   AQUÍ   / Versión MT4 ->   AQUÍ Có
FX Volume MT5
Daniel Stein
4.94 (17)
Obtenga su actualización diaria del mercado con detalles y capturas de pantalla a través de nuestro Morning Briefing aquí en mql5 y en Telegram ! FX Volume es el PRIMER y ÚNICO indicador de volumen que proporciona una visión REAL del sentimiento del mercado desde el punto de vista de un bróker. Proporciona una visión impresionante de cómo los participantes institucionales del mercado, como los brokers, están posicionados en el mercado Forex, mucho más rápido que los informes COT. Ver esta info
The Volume by Price Indicator for MetaTrader 5 features Volume Profile and Market Profile TPO (Time Price Opportunity). Get valuable insights out of currencies, equities and commodities data. Gain an edge trading financial markets. Volume and TPO histogram bar and line charts. Volume Footprint charts. TPO letter and block marker charts including split structures. Versatile segmentation and compositing methods. Static, dynamic and flexible ranges with relative and/or absolute visualizations. Lay
Introduciendo       Quantum Breakout PRO   , el innovador indicador MQL5 que está transformando la forma en que comercia con Breakout Zones. Desarrollado por un equipo de comerciantes experimentados con experiencia comercial de más de 13 años,       Desglose cuántico PRO       está diseñado para impulsar su viaje comercial a nuevas alturas con su innovadora y dinámica estrategia de zona de ruptura. El indicador de ruptura cuántica le dará flechas de señal en las zonas de ruptura con 5 zonas
ICT, SMC, SMART MONEY CONCEPTS, SMART MONEY, Smart Money Concept, Support and Resistance, Trend Analysis, Price Action, Market Structure, Order Blocks, BOS/CHoCH,   Breaker Blocks ,  Momentum Shift,   Supply&Demand Zone/Order Blocks , Strong Imbalance,   HH/LL/HL/LH,    Fair Value Gap, FVG,  Premium  &   Discount   Zones, Fibonacci Retracement, OTE, Buy Side Liquidity, Sell Side Liquidity, BSL/SSL Taken, Equal Highs & Lows, MTF Dashboard, Multiple Time Frame, BigBar, HTF OB, HTF Market Structure
Auto Order Block with break of structure based on ICT and Smart Money Concepts Futures Break of Structure ( BoS )             Order block ( OB )            Higher time frame Order block / Point of Interest ( POI )    shown on current chart           Fair value Gap ( FVG ) / Imbalance   ,  MTF      ( Multi Time Frame )    Volume Imbalance     ,  MTF          vIMB Gap’s Equal High / Low’s     ,  MTF             EQH / EQL Liquidity               Current Day High / Low           HOD /
TPSpro TRENDPRO  - is a trend indicator that automatically analyzes the market and provides information about the trend and each of its changes, as well as giving signals for entering trades without redrawing! The indicator uses each candle, analyzing them separately. referring to different impulses - up or down impulse. Exact entry points into transactions for currencies, crypto, metals, stocks, indices!  -  Version MT4                  DETAILED DESCRIPTION        /       TRADING SETUPS       
TrendMaestro5
Stefano Frisetti
note: this indicator is for METATRADER4, if you want the version for METATRADER5 this is the link:  https://www.mql5.com/it/market/product/108106 TRENDMAESTRO recognizes a new TREND in the bud, he never makes mistakes. The certainty of identifying a new TREND is priceless. DESCRIPTION TRENDMAESTRO identifies a new TREND in the bud, this indicator examines the volatility, volumes and momentum to identify the moment in which there is an explosion of one or more of these data and therefore the mome
IX Power MT5
Daniel Stein
5 (1)
IX Power   lleva por fin la insuperable precisión de FX Power a los símbolos que no son de Forex. Determina con exactitud la intensidad de las tendencias a corto, medio y largo plazo de tus índices, acciones, materias primas, ETF e incluso criptodivisas favoritas. Puede   analizar todo lo   que su terminal le ofrece. Pruébalo y experimenta cómo   tu timing mejora significativamente   a la hora de operar. Características principales de IX Power Resultados de cálculo 100% precisos y sin rep
Conviértase en un Breaker Trader y obtenga beneficios de los cambios en la estructura del mercado a medida que se invierte el precio. El indicador de ruptura de bloque de órdenes identifica cuándo una tendencia o movimiento de precio se acerca al agotamiento y está listo para revertirse. Le alerta sobre cambios en la estructura del mercado que generalmente ocurren cuando una reversión o un retroceso importante están a punto de suceder. El indicador utiliza un cálculo patentado que identific
Quantum Heiken Ashi PRO MT5
Bogdan Ion Puscasu
4.5 (8)
Presentamos el   Quantum Heiken Ashi PRO Diseñadas para brindar información clara sobre las tendencias del mercado, las velas Heiken Ashi son reconocidas por su capacidad para filtrar el ruido y eliminar las señales falsas. Diga adiós a las confusas fluctuaciones de precios y dé la bienvenida a una representación gráfica más fluida y confiable. Lo que hace que Quantum Heiken Ashi PRO sea realmente único es su fórmula innovadora, que transforma los datos de velas tradicionales en barras de colore
TrendLine PRO MT5
Evgenii Aksenov
4.78 (49)
El indicador Trend Line PRO es una estrategia comercial independiente. Muestra el cambio de tendencia, el punto de entrada a la transacción, así como calcula automáticamente tres niveles de Take Profit y la protección contra la pérdida de Stop Loss Trend Line PRO es perfecto para todos los símbolos de Meta Trader: monedas, metales, criptomonedas, acciones e índices Ventajas de Trend Line PRO: Nunca vuelve a dibujar sus señales Posibilidad de utilizar como estrategia independiente Tiene tres niv
TrendDecoder Premium MT5
Christophe, Pa Trouillas
5 (1)
Identifique los rangos y los próximos movimientos probables  |  Obtenga las señales más tempranas y la fuerza de las Tendencias   |  Obtener salidas claras antes de reversión   |  Detecte los niveles de Fibo que el precio pondrá a prueba   |  Indicador no repintado y no retardado - ideal para la trading manual y automatizada - adecuado para todos los activos y todas las unidades temporales 69$   para el lanzamiento - luego de nuevo a >>   $ 149 Después de la compra,   póngase en contacto con mi
A key element in trading is zones or levels from which decisions to buy or sell a trading instrument are made. Despite attempts by major players to conceal their presence in the market, they inevitably leave traces. Our task was to learn how to identify these traces and interpret them correctly. Reversal First Impulse levels (RFI)   -  Version MT4                  INSTRUCTIONS                 RUS                 ENG                         R ecommended to use with an indicator   -  TREND PRO  
Was: $249  Now: $99   Market Profile defines a number of day types that can help the trader to determine market behaviour. A key feature is the Value Area, representing the range of price action where 70% of trading took place. Understanding the Value Area can give traders valuable insight into market direction and establish the higher odds trade. It is an excellent addition to any system you may be using. Inspired by Jim Dalton’s book “Mind Over Markets”, this indicator is designed to suit the
Dark Power MT5
Marco Solito
4.84 (56)
Dark Power  is an Indicator for intraday trading. This Indicator is based on   Trend Following  strategy, also adopting the use of an histogram to determine the right power . We can enter in good price with this Indicator, in order to follow the   strong trend   on the current instrument. The histogram is calculated based on the size of the bars and two moving averages calculated on the histogram determine the direction of the signal Key benefits Easily visible take profit/stop loss lines Int
PZ Swing Trading MT5
PZ TRADING SLU
5 (4)
Swing Trading es el primer indicador diseñado para detectar oscilaciones en la dirección de la tendencia y posibles oscilaciones de reversión. Utiliza el enfoque de intercambio de línea de base, ampliamente descrito en la literatura comercial. El indicador estudia varios vectores de precios y tiempos para rastrear la dirección de la tendencia agregada y detecta situaciones en las que el mercado está sobrevendido o sobrecomprado y listo para corregir. [ Guía de instalación | Guía de actualización
Owl Smart Levels MT5
Sergey Ermolov
4.47 (36)
Versión MT4  |  FAQ El Indicador Owl Smart Levels es un sistema comercial completo dentro de un indicador que incluye herramientas de análisis de mercado tan populares como los fractales avanzados de Bill Williams , Valable ZigZag que construye la estructura de onda correcta del mercado y los niveles de Fibonacci que marcan los niveles exactos de entrada. en el mercado y lugares para tomar ganancias. Descripción detallada de la estrategia Instrucciones para trabajar con el indicador Asesor de c
Blahtech Supply Demand MT5
Blahtech Limited
4.57 (14)
Was: $299  Now: $99   Supply Demand uses previous price action to identify potential imbalances between buyers and sellers. The key is to identify the better odds zones, not just the untouched ones. Blahtech Supply Demand indicator delivers functionality previously unavailable on any trading platform. This 4-in-1 indicator not only highlights the higher probability zones using a multi-criteria strength engine, but also combines it with multi-timeframe trend analysis, previously confirmed swings
Sweet VWAP Anchored MT5
Francisco Gomes Da Silva
5 (3)
Economiza tiempo y toma decisiones más certeras con las VWAPs ancladas Si deseas probar el poder de esta herramienta, puedes descargar el indicador gratuito de VWAPs ancladas para MT5 . Además de trabajar de forma independiente, este indicador también es una extensión para la versión gratuita Sweet VWAP. Esto se debe a que, al hacer clic en la versión gratuita, la VWAP que ves en el puntero del ratón se fijará. Y para una mejor comprensión, lo que estará fijado allí es este indicador, con todas
Otros productos de este autor
Expert Advisor designed for trading Engulfing Candle Patterns within a manually input price range the D point of harmonic patterns , gartley , bat cypher butterfly ect. How Does It Work Step 1 Identify a price range around the end point D of your harmonic pattern. Input two prices into the EA settings   Inp9 Upper Level- type the highest price where an engulfing candle pattern can occur. Inp9 Lower Level - type the lowest price where an engulfing candle pattern can occur. Step 2  inp11_block
FREE
V1 Stochastic Alert
Paul Conrad Carlson
5 (1)
Stochastic indicator alerts  when  EA Available in comments , must have indicator installed buys stochastic main line is above  signal line stochastic is below 30 rsi 5 is below 20 sell stochastic main line is below signal line stochastic is above 70 rsi 5 is above 80 ADD to chart  Stochastic k 30 - d 9 - slowing 3, levels 30/70 rsi 5 lelels 20.80 Full alerts  push, mobile , email ect All input settings variable  feel free to contact for more information or alert sugestions
FREE
This Mt5 Indicator Signals when there is two opposite direction bars engulfed by current bar.  has a recent Exponential Moving Average Cross and past bar was oversold/bought Expert Advisor Available in Comments  Free Version Here : https://www.mql5.com/en/market/product/110114?source=Site&nbsp ; Full Alerts for mt5 terminal , phone , email, print to file, print to journal  Buy Signal ( blue line ) Past ema cross ( set at 30 bars back ) Past bar rsi is oversold ( level 40  ) Engulfing bar closes
FREE
Expert Advisor designed for trading Engulfing Candle Patterns within a manually input price range the D point of harmonic patterns , gartley , bat cypher butterfly ect.  This is the  full version , word test in the title is an error How Does It Work Step 1 Identify a price range around the end point D of your harmonic pattern. Input two prices into the EA settings   Inp9 Upper Level- type the highest price where an engulfing candle pattern can occur. Inp9 Lower Level - type the lowest price wh
FREE
Ema Cross Alert V1
Paul Conrad Carlson
Alert Indicator for exponential moving average cross blue arrow for buy alert , fast ema 14 crosses above 50 pink arrow for sell alert , fast ema 14 crosses below 50 Default 14 ema fast & 50 ema slow add these indicators to chart Full Alerts , push, email, phone  inputs for moving average lengths and alarm on off settings Please contact for help of an indicator alert suggestion 
FREE
This Expert advisor Trades Trending conditions, best use on EURUSD 1hr chart Strategy uses Bollinger band , Rsi and a momentum indicator to identify the best trading conditions  Includes news filter and account protection settings , also entry protection for high spread . Optimized code for quicker optimization in mt5 Download demo and test out Bollinger Band Lion .
FREE
https://www.youtube.com/watch?v=0T8Mge39Xsk&t=9s Youtube These EAs trade macd divergence only if there is a parabolic sar change at the same time. Sell bearish macd divergence & parabolic sar crosses above price Macd settings  Threshhold is how far above / below zero divergence must occur. Timeframe used Parabolic sar settings Only one trade in that direction can be opened at once. Trades on open bar Alerts , mt5 and mobile Stop loss and target points Stop loss is set to a % percentage of
FREE
This is a simple EA Can only open ONE trade EVER then MUST be reattached to the chart everytime you want to use it. Designed to help manual traders Has lot sizes and stops / targets in pips. For a buy trade the engulfing bar must close above the previous red bars high Includes Alarm and Phone notifications Basically if you find a price zone you like and will take a trade if there is an engulfing bar . use this.
FREE
This is a simple EA Can only open ONE trade EVER then MUST be reattached to the chart everytime you want to use it. Designed to help manual traders Has lot sizes and stops / targets in pips. For a sell trade the engulfing bar must close below the previous green bars low  Includes Alarm and Phone notifications Basically if you find a price zone you like and will take a trade if there is an engulfing bar . use this.
FREE
Script for Metatrader 5. One click to Delete the background grid and object, all objects on the chart such as Trend lines you have drawn or created by another program arrows text Fibonacci lines removes the background grid making a clearer clean chart horizontal and vertical lines Easy for clearing a chart or when opening new charts. Please leave a review on how its working.
FREE
Indicator and Expert Adviser  EA Available in the comments section of this product. Download with Indicator must have indicator installed for EA to work. Mt5 indicator alerts for bollinger band and envelope extremes occurring at the same time. Buy signal alerts occur when A bullish candle has formed below both the lower bollinger band and the lower envelope  Bar must open and close below both these indicators. Sell signal occur when A bear bar is formed above the upper bollinger band and upp
Lion macd
Paul Conrad Carlson
This Expert trades macd crosses , using ADX and AC. Designed for 4hr EURUSD trading but able to trade major pairs. Code is designed for speedy metatrader optimisation using open price testing as ea uses open prices on indicators used. EA identifies trends  with specific momentum and exits using the ADX or stop loss. Please optimise using out of sample data.  preset at 0.1 lots best to start with 0.01 lots.
https://www.youtube.com/watch?v=0T8Mge39Xsk&t=9s Youtube Sell only EA here. These EAs trade macd divergence only if there is a parabolic sar change at the same time. Buy bullish macd divergence & parabolic sar crosses below price Macd settings  Threshhold is how far above / below zero divergence must occur. Timeframe used Parabolic sar settings Only one trade in that direction can be opened at once. Trades on open bar Alerts , mt5 and mobile Stop loss and target points Stop loss is set
The EMA Engulfing Cross indicator is an indicator for the MetaTrader 5 platform that signals potential buy and sell opportunities based on an engulfing candle pattern after a recent exponential moving average cross. You can adjust how recently the trend change must have occurred using the PASTemaCROSS input. The RSI oversold/overbought function is used to confirm the signals generated by the moving averages. It takes into account the previous bar before the engulfing bar, and it is best used wi
Filtro:
No hay comentarios
Respuesta al comentario