Best SAR MT5
- Indicadores
- Ashkan Hazegh Nikrou
- Versión: 1.0
Descripción :
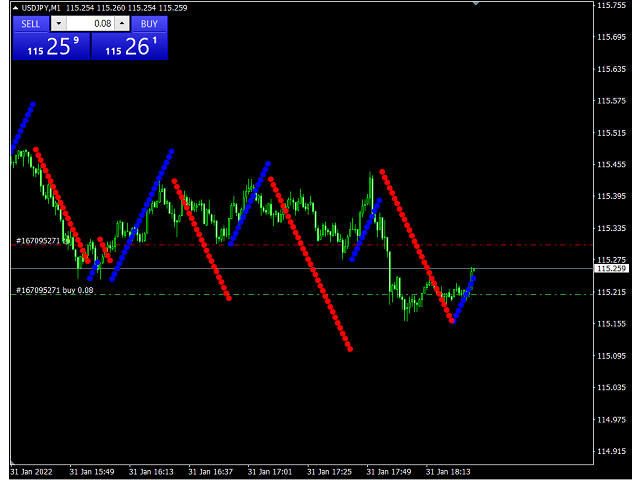
nos complace presentar nuestro nuevo indicador gratuito basado en uno de los indicadores profesionales y populares en el mercado de divisas (PSAR). Este indicador es una nueva modificación del indicador Parabolic SAR original. En el indicador pro SAR puede ver el cruce entre puntos y el gráfico de precios. el cruce no es una señal, pero habla sobre el final del potencial de movimiento, puede comenzar a comprar con un nuevo punto azul y colocar un límite de pérdidas un atr antes del primer punto azul, y finalmente puede salir tan pronto como los puntos crucen el gráfico de precios.
¿Cómo abrir señales de compra o venta?
Abrir operación de compra con el primer punto azul y abrir operación de venta con el primer punto rojo
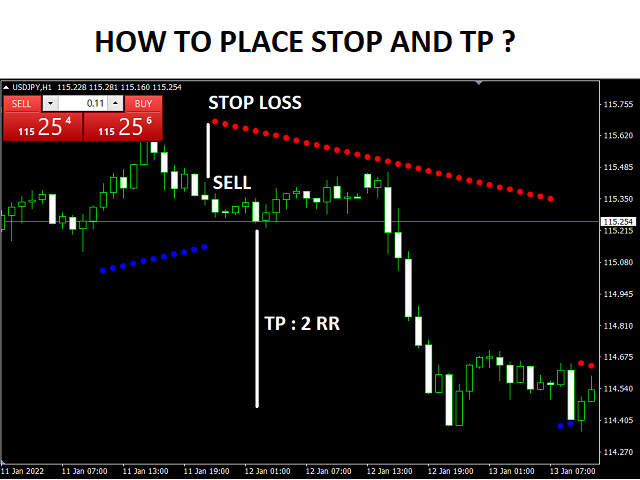
¿Dónde está el stop loss correcto?
El stop loss seguro puede estar en el primer punto (en caso de compra en el primer punto azul y en caso de venta en el primer punto rojo)
¿Dónde está el Take Profit correcto?
Take Profit puede ajustarse en función de la distancia de Stop Loss y RR, por lo que mi sugerencia es 2 RR, 2 veces mayor que Stop Loss.
¿Dónde está el punto de salida si tenemos ganancias pero aún no logramos tp?
La primera alerta de salida se puede cruzar entre puntos y gráfico de precios.
¿Cuándo este indicador emite alerta?
tan pronto como aparezca un nuevo punto en una nueva dirección, el indicador emitirá una alerta
¿Cómo podemos construir EA basados en este indicador y cuánto cuesta?
Estamos listos para construir un indicador basado en este indicador gratuito con algunas características potentes y completas, como el tope final basado en puntos y la administración de dinero basada en el % del capital, puede solicitarlo completando el formulario a continuación
Y el precio será de 40$

Я протестировал сотни индикаторов, этот лучший из всех. Он не творит волшебные чудеса, но гарантированно эффективен в целом. Низкий поклон и благодарность автору индикатора.