• Información general
  • Comentarios (3)
  • Discusión (4)
  • Novedades

Abiroid Halftrend Scanner

5

Read detailed description and Get Free Demo and extra indicators:

https://abiroid.com/product/abiroid-halftrend-scanner


Features:

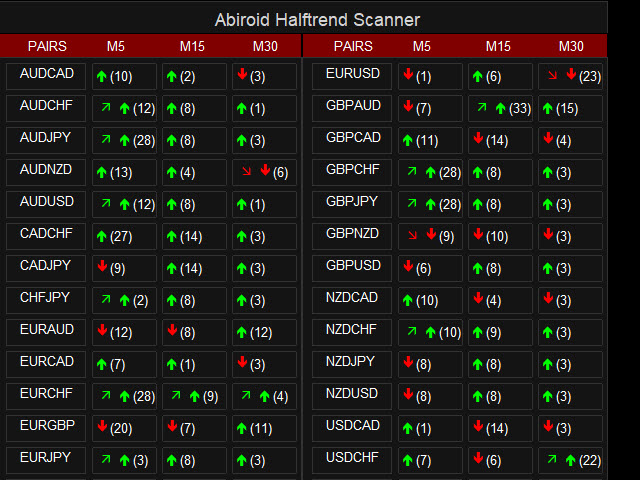
- Halftrend Arrow Scan: Scan Max Past Bars for Halftrend arrows. Show how many bars back the arrow occurred in a bracket

- Past Bars Back Alerts: Num of bars back for which scanner will send alerts

- Halftrend HTF Align: Scan Higher timeframes for Trend Direction of Halftrend Indicator and if trends align show a slanting Green/Red Arrow for Up/Down trend

- Semafor 3 Check: Few bars before Halftrend arrow to validate reversal


Simplistic and easy to use Halftrend scanner.


Please note, that this is not a full trading system. It will help you get initial Halftrend signals. And higher timeframe trend alignment.

And it’s to be used with your existing Halftrend strategies.


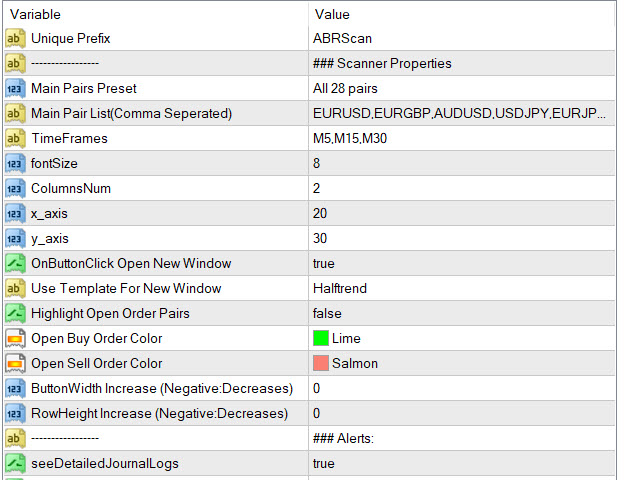
Check HTF Align: Keep true, if you want to check Higher timeframe’s Halftrend direction

Num HTF: Number of Higher timeframes to check for trend alignment with current timeframe.

Suppose current TF is M15 and “Num HTF” is 2. And current Halftrend direction is Bullish. It will check M30 and H1 for Bullish Trend as well. And show a slanting Up Green Arrow if Bullish.

Slanting Down Red arrow is for Bearish Alignment.


Comentarios 3
danmar
1344
danmar 2023.07.30 06:24 
 

Hi, a very very good , accurate, clear, tool witch make a so good job : well done but there is more : 1) all tools come with explanation of a rare quality, explain all parameters one by one, video clear 2) i ask some questions and have quick response = excellent user support, products and documentation, all that show the respect of customers i regret to not be able to put 10 stars because here there are so many reasons for 10 stars thank you for the quality of your work warmly

2023 08 14 === i have to say that the capability to hear customers needs and to make update to help is simply huge

i have a great respect for professionalism of Abir and the capacity to deliver a temporary version to help me

i have 2 products and , they are very well done and for an very very affordable price

Abir is in first place of 3 persons making a real great job and taking care of customers

Thank you so much, five stars is not enought for you work

very very very well done

2023 09 18 i ask Abir for a specific feature and she do it quickly and deliver a demo version to have time to test it because it was not so simple

what to say ? very very good development, quick response, a lot of quality which show a really game changer in the way to take care of clients

most of my asking was taken (the most importants for me ) some not and i understand why to keep the product easy to use and not too heavy

but always discuss and explain why

a real kind and professionnal exchange, nice to meet such a person

again Thanks a lot, Very Well Done, you are great, Warmly

Heiko
303
Heiko 2023.03.17 14:43 
 

Very good dashboard, it works perfectly!

jsmerchants
53
jsmerchants 2022.05.05 05:34 
 

I have always been a fan of the Halftrend and this scanner is super great! A1 Abiroid the seller has been very helpful whenever I have an enquiry.

Productos recomendados
Market Profile 3
Hussien Abdeltwab Hussien Ryad
4 (4)
Market Profile 3 MetaTrader 4 indicator  — is a classic Market Profile implementation that can show the price density over time, outlining the most important price levels, value area, and control value of a given trading session. This indicator can be attached to timeframes between M1 and D1 and will show the Market Profile for daily, weekly, monthly, or even intraday sessions. Lower timeframes offer higher precision. Higher timeframes are recommended for better visibility. It is also possible t
FREE
BoxInside MT4
Evgeny Shevtsov
4.56 (9)
This indicator calculates the volume profile and places labels that correspond to the VAH, VAL and POC levels, for each candle individually. Indicator operation features The indicator works on the timeframes from M5 to MN, but it uses the history data of smaller periods: M1 - for periods from M5 to H1, M5 - for the H4 period, M30 - for the D1 period, H4 - for the W1 period, D1 - for the MN period. The color and location of the VAL, VAH and POC labels on the current candle are considered to be
FREE
The indicator allows you to trade binary options. The recommended time frame is М1 and the expiration time is 1,2,3 minutes. The indicator suitable for auto and manual trading. A possible signal is specified as a arrows above/under a candle. You should wait until the candle closes! Arrows are not re-painted Trade sessions: TOKYO section (Half-end) Currency pairs: USD/JPY Working time frame: M1 Expiration time: 1,2,3 minutes. The indicator also shows good results when using the martingale strateg
FREE
Cumulative Delta MT4
Evgeny Shevtsov
4.69 (35)
The indicator analyzes the volume scale and splits it into two components - seller volumes and buyer volumes, and also calculates the delta and cumulative delta. The indicator does not flicker or redraw, its calculation and plotting are performed fairly quickly, while using the data from the smaller (relative to the current) periods. The indicator operation modes can be switched using the Mode input variable: Buy - display only the buyer volumes. Sell - display only the seller volumes. BuySell -
FREE
MarketProfile EForex
Veridiana Adorno Kendrick
Market Profile Muestra dónde ha pasado más tiempo el precio, destacando los niveles importantes que se pueden utilizar en la negociación. Es una poderosa herramienta que está diseñada para tomar los componentes fundamentales que componen cada mercado; precio / volumen / tiempo, y mostrar visualmente su relación en tiempo real a medida que el mercado se desarrolla durante un período de tiempo predeterminado. ¡Herramienta muy poderosa!
El indicador construye cotizaciones actuales, que se pueden comparar con las históricas y, sobre esta base, hacer un pronóstico de movimiento de precios. El indicador tiene un campo de texto para una navegación rápida a la fecha deseada. Opciones: Símbolo - selección del símbolo que mostrará el indicador; SymbolPeriod - selección del período del cual el indicador tomará datos; IndicatorColor - color del indicador; HorisontalShift: cambio de cotizaciones dibujadas por el indicador
TrendPlus
Sivakumar Subbaiya
4.38 (13)
Trend Plus   Trendplus  Indicator   Time Frame: Suitable for any time frame.  Purpose: Trend Prediction. Blue and red candle indicate the buy and sell call respectively. Buy: When the blue candle is formed buy call is initiated. close the buy trades when the next red candle will formed.   Sell: When the Red candle is formed Sell call is initiated. close the Sell trades when the next blue candle will formed.   Happy trade!!
FREE
Perfil del mercado Forex (FMP para abreviar) Si prefiere ver esto en un gráfico en vivo en lugar de leer la descripción, puede descargar instantáneamente una demostración gratuita aquí. Que esto no es: FMP no es la pantalla clásica de TPO codificada por letras, no muestra el cálculo general del perfil de datos del gráfico y no segmenta el gráfico en períodos ni los calcula. Que hace : Lo más importante es que el indicador FMP procesará los datos que residen entre el borde izquierdo del
FREE
Rainbow MT4
Jamal El Alama
Rainbow MT4 is a technical indicator based on Moving average with period 34 and very easy to use. When price crosses above MA and MA changes color to green, it’s a signal to buy. When price crosses below MA and MA changes color to red, it’s a signal to sell. The Expert advisor ( Rainbow EA MT4) based on Rainbow MT4 indicator, as you can see in the short video below is now available here .
FREE
Blahtech Market Profile
Blahtech Limited
4.61 (18)
Was: $249  Now: $99   Market Profile defines a number of day types that can help the trader to determine market behaviour. A key feature is the Value Area, representing the range of price action where 70% of trading took place. Understanding the Value Area can give traders valuable insight into market direction and establish the higher odds trade. It is an excellent addition to any system you may be using. Blahtech Limited presents their Market Profile indicator for the MetaTrader community. Ins
Dollar mint indicator is a special workmanship with years of experience in forex.   Dollar mint ea is a fully non repaint indicator optimised with price action data such that once it gives you a signal t . The indicator   can be used to trade anything on the mt4 with much ease. Benefits ; Fully non repaint Use in any timeframe Use in all the available tradable assets on mt4 Best to use on h4. It generates fully analysed buy and sell signals based on trend and also filters out retracement
Un indicador técnico que calcula sus lecturas sobre los volúmenes de negociación. En forma de histograma, muestra la acumulación de la fuerza del movimiento del instrumento comercial. Dispone de sistemas de cálculo independientes para direcciones alcistas y bajistas. Funciona en cualquier instrumento comercial y marco de tiempo. Puede complementar cualquier sistema comercial. El indicador no vuelve a dibujar sus valores, las señales aparecen en la vela actual. Es fácil de usar y no carga el gr
Traditional MACD MT4
Daniel Lewis
4.59 (69)
El indicador MACD en MetaTrader 4/5 se diferencia de los semejantes indicadores en otros programas. Eso se debe al hecho de que en la versión MetaTrader 4/5 la línea MACD se muestra en forma del histograma, mientras que habitualmente se muestra en forma de la línea. Además, en la versión MetaTrader 4/5 la línea de señal se construye con el uso de SMA, mientras que por definición tiene que construirse usando EMA. En la versión MetaTrader 4/5 también se diferencia el histograma (la diferencia entr
FREE
Blahtech Supply Demand
Blahtech Limited
4.63 (35)
Was: $299  Now: $99   Supply Demand uses previous price action to identify potential imbalances between buyers and sellers. The key is to identify the better odds zones, not just the untouched ones. Blahtech Supply Demand indicator delivers functionality previously unavailable on any trading platform. This 4-in-1 indicator not only highlights the higher probability zones using a multi-criteria strength engine, but also combines it with multi-timeframe trend analysis, previously confirmed swings
Extremum Reverse Bar
Yurij Izyumov
3.55 (11)
This indicator has been created for finding the probable reversal points of the symbol price. A small candlestick reversal pattern is used it its operation in conjunction with a filter of extremums. The indicator is not redrawn! If the extremum filter is disabled, the indicator shows all points that have a pattern. If the extremum filter is enabled, the condition works – if the history Previous bars 1 candles back contains higher candles and they are farther than the Previous bars 2 candle, such
FREE
Highlights trading sessions on the chart The demo version only works on the AUDNZD chart!!! The full version of the product is available at: (*** to be added ***) Trading Session Indicator displays the starts and ends of four trading sessions: Pacific, Asian, European and American. the ability to customize the start/end of sessions; the ability to display only selected sessions; works on M1-H2 timeframes; The following parameters can be configured in the indicator: TIME_CORRECTION = Cor
FREE
El Capturador de Tendencias: La Estrategia del Capturador de Tendencias con Indicador de Alerta es una herramienta versátil de análisis técnico que ayuda a los traders a identificar las tendencias del mercado y los posibles puntos de entrada y salida. Presenta una Estrategia dinámica del Capturador de Tendencias, adaptándose a las condiciones del mercado para una clara representación visual de la dirección de la tendencia. Los traders pueden personalizar los parámetros para que se ajusten a s
FREE
This trial scanner works with the other "Smart Market Structure Opportunity Scanner", and is basically an extension of that scanner with added features to find more accurate entry opportunities for day trading or refined swing trading.  The most important added features are:  1) The ADRs ( Average Daily Range ) for the last 5 days would have color and  +/- sign that shows the direction of each days ADR     move.  2) I added RSI values for each of the trading timeframes ( 1min, 5min, 15min, 30min
FREE
Max LotSize
Luis Alberto Atuncar Sanchez
5 (2)
Indicador de Tamaño de Lote Descubre el tamaño adecuado de lote para utilizar en tus operaciones basado en el margen disponible. Este indicador proporciona información valiosa para la gestión del riesgo. Si el indicador muestra un valor de 0, significa que tu saldo o margen disponible es insuficiente para operar. Es importante mantener niveles de margen adecuados para prácticas de trading seguras. Este indicador está diseñado exclusivamente para la plataforma MT4, una plataforma de trading popul
FREE
Check my paid tools they work great and I share Ea's based on them for free please r ate The Dual Timeframe RSI (Relative Strength Index) indicator is a novel trading tool that allows traders to monitor RSI readings from two different timeframes on a single chart. This dual perspective enables traders to identify potential trend confirmations and divergences more effectively. For instance, a trader might use a 1-hour RSI alongside a daily RSI to ensure that short-term trades align with the bro
FREE
The indicator analyzes the change in the minimum and maximum prices of the previous bars fixing the entrance of the big players. If the change (delta) increases, a signal is displayed on the graph in the form of an arrow. At the same time, virtual trade on history is carried out. In the free version, virtual trade is performed without refills in case of a repeat of the signal. The results of virtual trading in the form of losses / losses, profitability, drawdown and transaction lines are display
FREE
Simply The Best Pro
Szymon Palczynski
5 (1)
This indicator displays the histogram and arrows on chart. When Simple The Best Pro are placed on a chart, they identify the trend.  The color of may be blue or red. The blue color stands for upside moves and the red color stands for downside trends. The indicator offers to set Stop Loss (SL) and  Take Profit (TP)  setting. The default value is ATR. Indicator has automatic optimization. The STB is a unique indicator that shows the tendency (button Bars) of a particular signals. The STB tells us
Trade History Drawer
David Leander Tschacher
Trade History Drawer is an indicator for MetaTrader 4. It shows trades on the chart and draws them in customized colors. Furthermore, the indicator shows a trade summary and saves a CSV history file for either one selected pair or all pairs. Inputs General Settings Number Trades : Number of trades to be drawn on the chart, if -1 then all trades Magic Number : Only trades with this magic number, if -1 then ignore Line Style : Line Style Line Thickness : Line Thickness Arrow Size :
The indicator displays price distribution on a horizontal histogram. Horizontal histogram help find out key levels of price so that you can make good decision on setting point of take profit, stop loss... You can improve exist trading strategy or get new trading idea with the histogram of price. Outstanding features Support multiple time frame : you can choose to work with history data in any time frame you want. It does not depend on current display time frame. Support weighting by volume a
FREE
PZ Market Profile
PZ TRADING SLU
4.2 (10)
The market profile indicator provides with an X-Ray vision into market activity, outlining the most important price levels, value area and control value of the daily trading session. [ Installation Guide | Update Guide | Troubleshooting | FAQ | All Products ] Easy to understand and use Understand market dynamics easily Automatic timeframe selection Identify zones of trading value and discard others It is useful in all market conditions Effective for any trading strategy It implements three color
FREE
Adjustable Fractal MT4
Dmitry Timin
4.63 (30)
Adjustable Fractal MT4 is a modification of Bill Williams' Fractals indicator. The fractal consists of a two sets of arrows - up (upper fractals) and down (lower fractals). Each fractal satisfies the following conditions: Upper fractal - maximum (high) of a signal bar exceeds or is equal to maximums of all bars from the range to the left and to the right; Lower fractal - minimum (low) of a signal bar is less or equal to minimums of all bars from the range to the left and to the right. Unlike a s
FREE
MegaTrends
Sivakumar Subbaiya
1 (1)
Megatrends  Indicator   Time Frame: Suitable for any time frame.  Purpose: Trend Prediction. Blue and red color indicate the buy and sell call respectively. Buy: When the blue line is originating it is opened buy call. Sell: When the Red line is origination it is opened sell call Happy trade!! this indicator is suitable for all time frame, but our recommended time frame to use 1hour and 4 hours, suitable for any chart.
FREE
Discover the power of precision and efficiency in your trading with the " Super Auto Fibonacci " MT4 indicator. This cutting-edge tool is meticulously designed to enhance your technical analysis, providing you with invaluable insights to make informed trading decisions. Key Features: Automated Fibonacci Analysis: Say goodbye to the hassle of manual Fibonacci retracement and extension drawing. "Super Auto Fibonacci" instantly identifies and plots Fibonacci levels on your MT4 chart, saving you tim
FREE
BoxChart MT4
Evgeny Shevtsov
4.57 (7)
The market is unfair if only because 10% of participants manage 90% of funds. An ordinary trader has slim changes to stand against these "vultures". This problem can be solved. You just need to be among these 10%, learn to predict their intentions and move with them. Volume is the only preemptive factor that faultlessly works on any timeframe and symbol. First, the volume appears and is accumulated, and only then the price moves. The price moves from one volume to another. Areas of volume accumu
VolumeProfile
Robert Hess
3.8 (5)
Descption: The Volume Profile displays detailed informations of historical trading activities at certain price levels (Market Profile). So you can locate the areas with the best prices in the market and get an advantage about other market participants. Support: Please do not hesitate to contact me via the MQL5 Platform. I am very grateful about any Bug report, so that i can constantly improve the indicator. I also appreciate any public review for this product.  Features: Customizable Volume
Los compradores de este producto también adquieren
Gann Made Easy
Oleg Rodin
4.96 (45)
Gann Made Easy es un sistema de comercio de Forex profesional y fácil de usar que se basa en los mejores principios de comercio utilizando la teoría del Sr. W. D. Gann. El indicador proporciona señales precisas de COMPRA y VENTA, incluidos los niveles de Stop Loss y Take Profit. Puede comerciar incluso sobre la marcha utilizando notificaciones PUSH. ¡Por favor, póngase en contacto conmigo después de la compra! ¡Compartiré mis consejos comerciales con usted y excelentes indicadores de bonificació
Atomic Analyst
Issam Kassas
5 (1)
En primer lugar, vale la pena enfatizar que este Indicador de Trading no repinta, no redibuja y no se retrasa, lo que lo hace ideal tanto para el trading manual como para el automatizado. El Analista Atómico es un Indicador de Acción del Precio PA que utiliza la fuerza y el impulso del precio para encontrar una mejor ventaja en el mercado. Equipado con filtros avanzados que ayudan a eliminar ruidos y señales falsas, y aumentan el potencial de trading. Utilizando múltiples capas de indicadores
Scalper Vault
Oleg Rodin
5 (27)
Scalper Vault es un sistema profesional de reventa que le brinda todo lo que necesita para una reventa exitosa. Este indicador es un sistema comercial completo que puede ser utilizado por operadores de divisas y opciones binarias. El marco de tiempo recomendado es M5. El sistema le proporciona señales de flecha precisas en la dirección de la tendencia. También le proporciona señales superiores e inferiores y niveles de mercado de Gann. Los indicadores proporcionan todo tipo de alertas, incluidas
TPSproTREND PrO
Roman Podpora
5 (15)
TPSpro TRENDPRO  - is a trend indicator that automatically analyzes the market and provides information about the trend and each of its changes, as well as giving signals for entering trades without redrawing! The indicator uses each candle, analyzing them separately. referring to different impulses - up or down impulse. Exact entry points into transactions for currencies, crypto, metals, stocks, indices!  -  Version MT5               DETAILED DESCRIPTION        /       TRADING SETUPS           
Trend Screener
STE S.S.COMPANY
4.83 (86)
Indicador de tendencia, solución única e innovadora para el comercio y filtrado de tendencias con todas las funciones de tendencias importantes integradas en una sola herramienta. Es un indicador 100% sin repintar de marcos temporales y monedas múltiples que se puede usar en todos los símbolos/instrumentos: divisas, materias primas, criptomonedas, índices y acciones. Trend Screener es un indicador de seguimiento de tendencia eficiente que proporciona señales de tendencia de flecha con puntos en
Introduciendo       Indicador Quantum Trend Sniper   , el innovador indicador MQL5 que está transformando la forma en que identificas y negocias los cambios de tendencia. Desarrollado por un equipo de comerciantes experimentados con experiencia comercial de más de 13 años,       Indicador de francotirador de tendencia cuántica       está diseñado para impulsar su viaje comercial a nuevas alturas con su forma innovadora de identificar cambios de tendencia con una precisión extremadamente alta.
Ante todo, vale la pena enfatizar que esta Herramienta de Trading es un Indicador No Repintado, No Redibujado y No Retrasado, lo que la hace ideal para el trading profesional. El Indicador de Conceptos de Acción del Precio Inteligente es una herramienta muy potente tanto para traders nuevos como experimentados. Combina más de 20 indicadores útiles en uno solo, combinando ideas avanzadas de trading como el Análisis del Trader del Círculo Interior y Estrategias de Trading de Conceptos de Dinero
ACTUALMENTE 26% DE DESCUENTO ¡La mejor solución para cualquier operador novato o experto! Este indicador es una herramienta única, de alta calidad y asequible porque hemos incorporado una serie de características propias y una nueva fórmula. ¡Con sólo UN gráfico puede leer la Fuerza de la Divisa para 28 pares de Divisas! Imagínese cómo mejorará su operativa porque podrá señalar el punto exacto de activación de una nueva tendencia o de una oportunidad de scalping. Manual del usuario: haga
TPSpro RFI Levels
Roman Podpora
5 (13)
A key element in trading is zones or levels from which decisions to buy or sell a trading instrument are made. Despite attempts by major players to conceal their presence in the market, they inevitably leave traces. Our task was to learn how to identify these traces and interpret them correctly. Reversal First Impulse levels (RFI)   -  Version MT5                INSTRUCTIONS                 RUS                 ENG                                       R ecommended to use with an indicator   -  
Advanced Supply Demand
Bernhard Schweigert
4.92 (310)
¡Actualmente con 33% de descuento! ¡La mejor solución para cualquier tráder principiante o experto! Este indicador es una herramienta comercial única, de alta calidad y asequible, porque incorpora una serie de características patentadas y una nueva fórmula. Con esta actualización, podrá mostrar zonas de doble marco temporal. No solo podrá mostrar un marco temporal más alto, sino también mostrar ambos, el marco temporal del gráfico MÁS el marco temporal más alto: MOSTRANDO ZONAS ANIDADAS. A todos
Entry Points Pro
Yury Orlov
4.7 (224)
Este es un genial indicador para MT4 que ofrece señales precisas para entrar en una transacción sin redibujar. Se puede aplicar a cualquier activo financiero: fórex, criptomonedas, metales, acciones, índices. Nos dará valoraciones bastante precisas y nos dirá cuándo es mejor abrir y cerra una transacción. Eche un vistazo  al vídeo  (6:22), ¡contiene un ejemplo de procesamiento de una sola señal que ha amortizado el indicador! La mayoría de los tráders mejoran sus resultados comerciales durante l
Scalper Inside PRO
Alexey Minkov
4.75 (55)
SALE NOW! Limited Time Offer! An exclusive indicator that utilizes an innovative algorithm to swiftly and accurately determine the market trend. The indicator automatically calculates opening, closing, and profit levels, providing detailed trading statistics. With these features, you can choose the most appropriate trading instrument for the current market conditions. Additionally, you can easily integrate your own arrow indicators into Scalper Inside Pro to quickly evaluate their statistics and
¡Descubra el secreto para el comercio de Forex exitoso con nuestro indicador MT4 personalizado! ¿Alguna vez se ha preguntado cómo lograr el éxito en el mercado de Forex, obteniendo ganancias constantemente al tiempo que minimiza el riesgo? ¡Aquí está la respuesta que ha estado buscando! Permítanos presentar nuestro indicador MT4 patentado que revolucionará su enfoque para el comercio. Versatilidad única Nuestro indicador está especialmente diseñado para usuarios que prefieren las formacio
TrendMaestro
Stefano Frisetti
5 (2)
note: this indicator is for METATRADER4, if you want the version for METATRADER5 this is the link: TRENDMAESTRO recognizes a new TREND in the bud, he never makes mistakes. The certainty of identifying a new TREND is priceless. DESCRIPTION TRENDMAESTRO identifies a new TREND in the bud, this indicator examines the volatility, volumes and momentum to identify the moment in which there is an explosion of one or more of these data and therefore the moment in which prices have strong probability of f
¡Actualmente 20% OFF ! ¡La mejor solución para cualquier novato o trader experto! Este software funciona con 28 pares de divisas. Se basa en 2 de nuestros principales indicadores (Advanced Currency Strength 28 y Advanced Currency Impulse). Proporciona una gran visión general de todo el mercado de divisas. Muestra los valores de Advanced Currency Strength, la velocidad de movimiento de las divisas y las señales para 28 pares de divisas en todos los (9) marcos temporales. Imagine cómo mejorar
Presentamos el Indicador Milagroso de Forex: Desata el Poder del Trading Preciso ¿Estás cansado de buscar el mejor indicador de Forex que realmente ofrezca resultados excepcionales en todos los marcos temporales? ¡No busques más! Ha llegado el Indicador Milagroso de Forex para revolucionar tu experiencia de trading y llevar tus ganancias a nuevas alturas. Construido sobre una base de tecnología de vanguardia y años de desarrollo meticuloso, el Indicador Milagroso de Forex se erige como el pinácu
Conviértase en un Breaker Trader y obtenga beneficios de los cambios en la estructura del mercado a medida que se invierte el precio. El indicador de ruptura de bloque de órdenes identifica cuándo una tendencia o movimiento de precio se acerca al agotamiento y está listo para revertirse. Le alerta sobre cambios en la estructura del mercado que generalmente ocurren cuando una reversión o un retroceso importante están a punto de suceder. El indicador utiliza un cálculo patentado que identific
FX Power MT4 NG
Daniel Stein
5 (8)
Obtenga su actualización diaria del mercado con detalles y capturas de pantalla a través de nuestro Morning Briefing aquí en mql5 y en Telegram ! FX Power MT4 NG es la nueva generación de nuestro popular medidor de fuerza de divisas, FX Power. ¿Y qué ofrece este medidor de fuerza de nueva generación? Todo lo que le encantaba del FX Power original PLUS Análisis de fuerza de ORO/XAU Resultados de cálculo aún más precisos Períodos de análisis configurables individualmente Límite de cálculo persona
ALERTA DE COMPRA Y VENTA MULTIDIVISA y MULTITIMEFRAME. ¡STOP DE TRAILING AUTOMÁTICO Y TOMA DE BENEFICIOS DE RECOMPENSA DE RIESGO! ¡EL INDICADOR ESCANEA Y ANALIZA EL MERCADO PARA QUE NO TENGAS NADA QUE HACER! ¡COMERCIA TODAS TUS MONEDAS EN 1 GRÁFICO!   Después de la compra, deje un comentario, contácteme y le enviaré el asistente comercial EA. El indicador utiliza varios osciladores y filtros adjuntos para encontrar los mejores puntos de entrada CONFIRMADOS, ¡así que no necesita preocupars
Quantum Breakout Indicator PRO
Bogdan Ion Puscasu
4.96 (26)
Introduciendo       Quantum Breakout PRO   , el innovador indicador MQL5 que está transformando la forma en que comercia con Breakout Zones. Desarrollado por un equipo de operadores experimentados con experiencia comercial de más de 13 años,   Quantum Breakout PRO   está diseñado para impulsar su viaje comercial a nuevas alturas con su innovadora y dinámica estrategia de zona de ruptura. El indicador de ruptura cuántica le dará flechas de señal en las zonas de ruptura con 5 zonas objetivo de
El sistema PRO Renko es un sistema de trading de alta precisión especialmente diseñado para operar gráficos RENKO. Se trata de un sistema universal que se puede aplicar a diversos instrumentos de negociación. El sistema neutraliza eficazmente el llamado ruido de mercado, lo que le brinda acceso a señales de reversión precisas. El indicador es muy fácil de usar y solo tiene un parámetro responsable de la generación de señales. Puede adaptar fácilmente la herramienta a cualquier instrumento com
TrendDecoder Premium
Christophe, Pa Trouillas
5 (3)
Identifique los rangos y los próximos movimientos probables   |  Obtenga las señales más tempranas y la fuerza de las Tendencias   |  Obtener salidas claras antes de reversión   |  Detecte los niveles de Fibo que el precio pondrá a prueba Indicador no repintado y no retardado - ideal para la trading manual y automatizada - adecuado para todos los activos y todas las unidades temporales Oferta por tiempo limitado >>   50% OFF Después de la compra, póngase en contacto con mi canal  para conocer lo
Currency Strength Wizard es un indicador muy poderoso que le proporciona una solución todo en uno para operar con éxito. El indicador calcula el poder de este o aquel par de divisas utilizando los datos de todas las monedas en múltiples marcos de tiempo. Estos datos se representan en forma de índice de moneda fácil de usar y líneas eléctricas de moneda que puede usar para ver el poder de esta o aquella moneda. Todo lo que necesita es adjuntar el indicador al gráfico que desea operar y el indicad
Trend Forecasting
Mohamed Hassan
5 (15)
This indicator is unstoppable when combined with our other indicator called Katana. After purchase, send us a message and you could get Katana for FREE as a BONUS After purchase, send us a private message for your instructions.  MT5 version: click here There are limited copies available at $55. Next price is $105. Don't miss this great deal!  The Trend Forecasting indicator is a very unique & easy tool that is able to make prediction about future price movement based on the signal
ACTUALMENTE 31% DE DESCUENTO Este indicador es una herramienta de transacción única, de alta calidad y asequible porque hemos incorporado una serie de características propias y una fórmula secreta. Con solo un gráfico, da Alertas para los 28 pares de divisas. ¡Imagina cómo mejorarás porque puedes identificar el punto de activación exacto de una nueva tendencia u oportunidad de crecimiento! Basado en nuevos algoritmos subyacentes , hace que sea aún más fácil identificar y confirmar operaciones po
FX Volume
Daniel Stein
4.6 (35)
Obtenga su actualización diaria del mercado con detalles y capturas de pantalla a través de nuestro Morning Briefing aquí en mql5 y en Telegram ! FX Volume es el PRIMER y ÚNICO indicador de volumen que proporciona una visión REAL del sentimiento del mercado desde el punto de vista de un bróker. Proporciona una visión impresionante de cómo los participantes institucionales del mercado, como los brokers, están posicionados en el mercado Forex, mucho más rápido que los informes COT. Ver esta info
Shepherd Harmonic Pattern
Abdullah Alrai
4.68 (59)
Este indicador detectará patrones armónicos que se dibujen en el gráfico mediante métodos manuales y automáticos. Puede consultar el manual del usuario en el siguiente enlace: Agregue su opinión y contáctenos para obtenerlo Existe una versión gratuita para probar este producto en mt4. Puede utilizarlo para detectar patrones de Gartley y Nenstar: https://www.mql5.com/en/market/product/30181 Puede comprar la versión completa de MT4 en: https://www.mql5.com/en/market/product/15212 Notas El indicad
TakePropips Donchian Trend Pro
Eric John Pajarillaga Aldana
4.82 (17)
¡TakePropips Donchian Trend Pro   (MT4) es una herramienta poderosa y efectiva que detecta automáticamente la dirección de la tendencia utilizando el Canal Donchian y le proporciona señales comerciales de entrada y salida! Este indicador multifunción incluye un escáner de tendencias, señales comerciales, panel estadístico, filtro, sesiones comerciales y panel de historial de alertas. ¡Está diseñado para proporcionarle señales comerciales y ahorrarle horas analizando los gráficos! Puede descargar
How to use Pair Trading Station Pair Trading Station is recommended for H1 time frame and you can use it for any currency pairs. To generate buy and sell signal, follow few steps below to apply Pair Trading Station to your MetaTrader terminal. When you load Pair Trading Station on your chart, Pair Trading station will assess available historical data in your MetaTrader platforms for each currency pair. On your chart, the amount of historical data available will be displayed for each currency pai
Market Structure Patterns MT4
Samuel Manoel De Souza
5 (15)
Market Structure Patterns   is an indicator based on   smart money concepts   that displays almost all of the   SMC/ICT   elements needed to take your trading decisions to the next level. Take advantage of the   alerts ,   push notifications   and   email messages   to keep informed from when an element is formed on the chart, the price crosses a level and/or enters in a box/zone. Developers can access the values of the elements of the indicator using the   global variables  what allows the aut
Otros productos de este autor
TDI Multi Timeframe Scanner: This Dashboard indicator uses the TDI (Trader's Dynamic Index) Indicator to find best trades. Extra indicators and detailed description is here: https://abiroid.com/product/tdi-scanner-dashboard Checks for: - SharkFin Pattern Free indicator for SharkFin: https://www.mql5.com/en/market/product/42405/ - TDI Trend: Strong/Weak Trend Up/Down - TDI Signal: Strong/Medium/Weak Signal for Buy/Sell - Consolidation - Overbought/Oversold - Volatility Bands - Previous Day/Week
This Indicator uses Center of Gravity (COG) Indicator to find you the best trades. It is a reversal based Swing Indicator which contains an  Arrows Indicator. That you can buy here from Metatrader Market. And a scanner Indicator. Free Download here: https://abiroid.com/product/abiroid-sway-cog Scanner needs arrows indicator to run. Copy scanner ex4 in same folder as your Arrows Indicator: MQL4/Indicators/Market/ All extra indicators and templates also available in above link. Base Strategy:
All Indicator extras and template: https://abiroid.com/extras/best-heiken-ashi-vqzz-system-extras The Best Heiken Ashi System is a simple trading system for trading based only two indicators for generate signals: Heiken ashi smoothed and Vqzz indicator multi-timeframe. The system was created for scalping and day trading but can also be configured for higher time frames. As mentioned, the trading system is simple, you get into position when the two indicators agree. Get Scanner dashboard her
FREE
Dashboard uses Ichimoku Strategy to find best trades. Get extra Indicators/Template: And read more about detailed Product Description and usage here: https://www.mql5.com/en/blogs/post/747457 Please note: I won’t be able to add new settings. It already has 72 settings     Some people are using it with their EAs. And iCustom function can only take Max 64 settings. So, I cannot let it grow any further. I’ll definitely be maintaining the code and solving issues. Don’t worry     Please check all
About Scanner: Detailed blog post is here: https://www.mql5.com/en/blogs/post/749119 BB Squeeze Scanner uses   bbsqueeze.ex4   in background to calculate when BB Squeeze (Bollinger Bands Squeeze) happens and when BBands expand. It is attached with the above blog post. What is Bollinger Bands Squeeze: The Bollinger bands squeeze is a special pattern when the volatility of a market decreases after trending periods. It is generally observed the price is ranging during this period until a
About: A Fibonacci indicator is best used with other indicators like Pivots, Support/Resistance etc. Price tends to use Fibo levels as Support or Resistance lines. So, this indicator is very useful to know when price might reverse or if a level is crossed, price might continue the trend. Also, to find the best Take Profit and StopLoss lines. Don't use Fibo Indicator alone for trading as it might not always be accurate. Use it to make your strategies better as a supporting indicator. Settings:
FREE
Note: This is an Arrows Only Indicator. Get paid scanner or free TDI extra indicators here: https://abiroid.com/product/tdi-sharkfin-arrows-and-scanner/ About: This is a TDI Arrow Indicator for finding the Shark Fin Pattern. It will show an arrow in the current bar if RSI sharkfin is finished forming in previous bar. What is Shark Fin TDI Pattern? Upper Shark Fin: In TDI Indicator when Green RSI breaks above a certain level and also breaks upper Volatility band and then breaks below that
FREE
This indicator is based on Guppy's GMMA Strategy. And shows arrows when GMMA lines cross up or down. To have this indicator and get alerts for Multiple Timeframes and multiple Pairs you can check out the demo of this GMMA Trend Scanner indicator: https://www.mql5.com/en/market/product/38747 About GMMA In Brief: GMMA attempts to identify trends by combining two groups of moving averages with differing time periods: The long-term EMAs (30, 35, 40, 45, 50, and 60) the behaviors of investors tha
FREE
3 Level ZZ Semafor Scanner: This is a Dashboard indicator which uses 3LZZ Indicator in the background to find semafors. It will give priority to the semafors3 because they specify a strong signal. So, even if there is a sem1 or 2 on current bar, and if Sem3 was within "Check Previous Bars for Sem 3". Then it will show Sem3 instead. You can go through this video tutorial to see how it works: https://youtu.be/Z4v4h8U6RiM Get all extra Indicators/Template from here: https://abiroid.com/product/
Features: Find these engulfing patterns: Simple Engulf Stick Sandwich Engulf Three Line Strike Rising Three Morning Star Doji Scanner is useful to make your strategy better. Don't always go by Win/Loss percentage. Because this tool is not based on past results. Basic Settings: For All Patterns You can set: First:Last Candle Ratio This will make sure that the earlier opposite candle is at least this given ratio in height as compared to the engulfing candle. This is not checked for Three Line Stri
FREE
EMA Multi meter
Abir Pathak
4.92 (13)
How the Indicator Works: This is a Multi-timeframe MA multimeter indicator which studies if price is above or below a particular EMA range and shows Red/Green/Yellow signals. Red: Price Below EMA range Green: Price above range Yellow: Price within range Indicator Properties: EMA Settings: - Default Period is 200. You can change all MA Settings like Period, MA Method (SMA, EMA, etc) or MA Applied Price (Close, Open, etc). - EMA Range list is a comma separated value list for different timefr
FREE
This Scanner Dashboard uses the Extreme TMA System Arrows Indicator to show good BUY/SELL signals. This Product contains dashboard only. It does not contain the Abiroid_Arrow_Extreme_TMA.ex4 indicator. Arrows indicator is not necessary for dashboard to work.  To see arrows, you can buy the arrows indicator separately if you like: https://www.mql5.com/en/market/product/44822 Dash shows Slopes for current and Higher Timeframes. - 1st diamond is current TF. Next diamonds are higher TFs (Please N
Scanner Dashboard for Best Heiken Ashi VQZZ Arrows Indicator here: https://www.mql5.com/en/market/product/45900 Updated description and all extra indicators/templates are here: https://abiroid.com/extras/best-heiken-ashi-vqzz-system-extras Please note that if you are using too many pairs/timeframes, then VQZZ calculations might slow down the dashboard. So be careful not to use too many VQZZ Higher timeframes if you are using too many pairs. Dashboard Symbols: Please refer to Screenshots f
This is a Dashboard Scanner for finding good trades using the GMMA method as base and TDI method for trend verification. All buttons for all Pairs and Timeframes are clickable and will change the chart for you to that Symbol/TimeFrame. Green "G-Buy" button means good Buy Trend and Red "G-Sell" button means good Sell Trend. Gray "G" means just a cross has happened but trend is not strong enough yet. Read scanner common settings: https://www.mql5.com/en/blogs/post/747456 How Scanner finds th
Abiroid Slope MA
Abir Pathak
4.5 (2)
Features: - Moving Average Slope for Max Past Bars - Slope Period - Slope Thresholds - Multiple Slope Type options - See slope visually as a histogram - Info Panel Show/Hide Slope Calculations and Types: The slope value is calculated using the Slope Period. Suppose Period is 5, it will check the MA value for bar (x) and bar (x+5). And find the slope angle between them. Read detailed description about Slope Types and Settings here: https://www.mql5.com/en/blogs/post/747651
FREE
Description This scanner uses 3LZZ TRO ex4 and scans for Semafors at given “Shift” bar. Scanner Detailed Settings: https://www.mql5.com/en/blogs/post/747456 Other Settings: Set Periods for Semafor 1,2,3 Set alerts on/off for Semafor 1,2,3 Shift bar (Bar on which semafor is scanned) Refresh After Ticks (Number of ticks when dash is refreshed) This scanner is pretty simplistic version. And a more detailed version with a different strategy is available here: https://www.mql5.com/en/market/produ
FREE
Abiroid Multi Slope indicator allows you to calculate a Slope Histogram for any line of any indicator . Histogram is for 1 slope line only, but slope values can be calculated for 3 lines total. To have multiple histograms, add as many Slope indicators for custom indicators as you like on chart. You just need to provide the Indicator name, buffer value, slope's period and max number of bars back. By default it has slope calculation for TDI_v4.ex4 indicator. There is no way to specify parameters f
FREE
Abiroid MA Stack
Abir Pathak
4.33 (3)
Moving Average Rainbow Stack: Free: Single Currency & Single Timeframe MA Stack Very useful for finding current and higher timeframe trends. Best suited for long term trend based trading. Use fewer MAs for quick scalping. And not suitable during low volatility. Only use during high volatility and steady trending markets. Use this to enhance your existing Trend based strategies to find best trends. Read detailed description https://abiroid.com/product/abiroid-ma-stack Available MTF and Scanner
FREE
Extreme TMA System with Arrows Indicator And Buy/Sell Boxes with Take Profit & Stop Loss This is a Non-Repainting Arrows Indicator based on the Extreme TMA System. It shows TMA cross signals and the best BUY/SELL signals. Along with the most predicted TakeProfit. And StopLoss based on TakeProfit ratio. Please note: This is an Arrows only Indicator. Dashboard is sold separately here: https://www.mql5.com/en/market/product/44825 About Indicator: This indicator shows BUY/SELL Signal Arrows a
Abiroid Profit Percent Series 1: Arrows Indicator Stochastic Ichimoku with ATR Get the Scanner for free. For getting Profit Percentages for Multiple Timeframes and Multiple Pairs. And read detailed description about this indicator and all the settings here. And get extra Indicators, Templates and settings for download: https://abiroid.com/product/profit-percent-stoch-ichimoku-with-atr Watch the tutorial video here: https://youtu.be/C45-9kWPE2Q About The Strategy: This strategy has 3 main
Profit Percent Series 2 The scanner dashboard available here (for  Free) : https://abiroid.com/product/profitpercent-arrows-ma-confluence Read detailed information about MA Confluence here: https://www.mql5.com/en/blogs/post/747474 Here's a post about Common Settings for all Profit Percent Series Indicators: https://www.mql5.com/en/blogs/post/747456 Strategy: Main Signal Indicators (Any One): MA Cross (In-built) or Hull, OBV Cross, Heiken Ashi Cross Validation Indicators (Preferably l
This strategy is best used for Trend based trading. While market is trending, price still makes smaller ranges. Darvas boxes show breakouts from these small ranges, while still following the original market trend. Detailed Description: https://www.mql5.com/en/blogs/post/747919 Features: - Check Darvas Box Breakout - Check Price Above/Below MA or Darvas Box has crossed MA - Min, Max Box Height - Max Distance Between Entry Price and Darvas Box - NRTR Trend Check - Heiken Trend Check - MA Slo
Free scanner available here: https://abiroid.com/product/abiroid-ema-scalper Basic Strategy: 1: MA Crossover Up/Down Arrow (Mandatory Check) Optional Checks: 2: If NRTR Check On (Optional): For BUY: Check if NRTR blue and For SELL: NRTR Red If NRTR Shadow Distance On (Optional): Check price for 'x' bars back: at Shadow distance (ATR Multiplier distance) from NRTR line. 3: If High Volume bar On: Check if High Volume or if Medium (if on) Volume bar 'x' bars back 4: If HTF Trend Align On (Option
This is a Multi-currency multi-timeframe Support/Resistance Scanner Dashboard for Metatrader 4 (MT4) platform. Get all extras and download free demo here: https://abiroid.com/product/abiroid-support-resistance-scanner Read detailed description in post above. Features: Scan Support/Resistance zones (also called Supply/Demand zones) Show alert when price is inside these zones and highlights the pair/timeframe Show or hide SR zones price nearest to current price (Price_Close) Show or hide cur
This strategy is useful for small timeframe scalping and binary options. Best timeframes: M5,M15,M30 M1 timeframe is too unpredictable. So be careful with that. Read Detailed Description and Get All: - Free Demo - Free Scanner - Extra Indicators ex4 files from https://abiroid.com/product/abiroid-donchian-scanner-and-arrows Arrows Demo only works in strategy tester. So, Arrows Demo won't work with the free scanner. Scanner needs "Abiroid Donchian Arrow.ex4" to work. So make sure both arrows a
Read detailed description and   Get Free Demo   and extra indicators: https://abiroid.com/product/abiroid-supertrend-scanner This is a very simplistic Supertrend scanner dashboard. Features: - Select one of In-Built Supertrend Indicators: xSupertrend or Supertrend_CCI (based on CCI). - Or select your own Custom Supertrend indicator. And specify the UpTrend and DownTrend Buffer numbers - Supertrend Trend Direction Change Scan: Scan Max Past Bars for Supertrend Change. Show how many bars bac
Get Free Scanner and example Strategies And understand detailed description here: https://abiroid.com/product/abiroid-customizer-arrows-and-scanner And get example wrapper here: https://abiroid.com/indicators/customizer-sample-wrappers You can make your own wrappers if your indicators have complex conditions or for In-Built MT4 indicators. Features: - Specify your own Custom Indicator - Specify Buffer values and create Variables - Use those Variables to create your own Buy/Sell Conditions
This is a multi-timeframe multi-currency Fibo (Fibonacci levels) and Pivots scanner which also shows Missed Pivot count and Fibo Golden Ratio Zones. Select separate Pivot Timeframes for each Dashboard Timeframe Check when price is near a Pivot point Check for Price Crossing Pivot Point Use Mid Pivots (Optional) Show Missed Pivots (Optional) Show High Volume Bar Use Fibo (Optional) Use Fibo Golden Ratio (Optional) Set your preferred Timeframe for Fibo or Pivots Check out   Common Scanner Settin
This strategy is best used for Scalping and Binary Options. Strategy: There are 3 EMAs: Faster, Medium and Slower. When Price is Trending, wait for Price to bounce an EMA and scalp at each bounce. Features: - Check if 3 MAs are Stacked - Check Price Bounce Off MAs (Faster, Medium, Slower) - Min Distance Between Faster and Medium MA Filter - Max Distance Between Entry Price and Faster MA Filter - High Volume Check - Heiken Trend Check - Volatility Check - Higher/Lower Timeframes MA Stacked check
Bollinger Bands Breakout Strategy has an Arrows and Scanner Dashboard indicator set. It is for MT4 (Metatrader 4) platform. When price breaks out of a Bollinger Outer Band in a powerful way, it becomes a great position for scalping. Because the next few bars will most likely keep going in the same direction. Especially if Middle band is also sloping towards that breakout. It's also great for Binary options when using 2-3 next few bars. Strategy: BUY  Bollinger Bands: - Price breaks out of
Filtro:
danmar
1344
danmar 2023.07.30 06:24 
 

Hi, a very very good , accurate, clear, tool witch make a so good job : well done but there is more : 1) all tools come with explanation of a rare quality, explain all parameters one by one, video clear 2) i ask some questions and have quick response = excellent user support, products and documentation, all that show the respect of customers i regret to not be able to put 10 stars because here there are so many reasons for 10 stars thank you for the quality of your work warmly

2023 08 14 === i have to say that the capability to hear customers needs and to make update to help is simply huge

i have a great respect for professionalism of Abir and the capacity to deliver a temporary version to help me

i have 2 products and , they are very well done and for an very very affordable price

Abir is in first place of 3 persons making a real great job and taking care of customers

Thank you so much, five stars is not enought for you work

very very very well done

2023 09 18 i ask Abir for a specific feature and she do it quickly and deliver a demo version to have time to test it because it was not so simple

what to say ? very very good development, quick response, a lot of quality which show a really game changer in the way to take care of clients

most of my asking was taken (the most importants for me ) some not and i understand why to keep the product easy to use and not too heavy

but always discuss and explain why

a real kind and professionnal exchange, nice to meet such a person

again Thanks a lot, Very Well Done, you are great, Warmly

Abir Pathak
41331
Respuesta del desarrollador Abir Pathak 2023.12.29 00:29
Thank you for your awesome review :)
Heiko
303
Heiko 2023.03.17 14:43 
 

Very good dashboard, it works perfectly!

Abir Pathak
41331
Respuesta del desarrollador Abir Pathak 2023.03.17 18:44
Thank you :)
jsmerchants
53
jsmerchants 2022.05.05 05:34 
 

I have always been a fan of the Halftrend and this scanner is super great! A1 Abiroid the seller has been very helpful whenever I have an enquiry.

Abir Pathak
41331
Respuesta del desarrollador Abir Pathak 2023.03.17 18:44
Thank you :)
Respuesta al comentario
Versión 1.5 2023.09.17
v1.5 Added feature to find when price crossed halftrend line. And how many bars back the cross happened. Also a point distance between price and halftrend line.
If price is above line it's green and if below then points text is red.
Versión 1.4 2023.01.10
v1.4 Added option to Highlight only if HTF Align
And added Refresh After Ticks option to refresh more often
Versión 1.3 2021.12.13
Halftrend Scanner v1.3: Added option to Alert only if HTF Align

If true it will show Halftrend Arrows alerts only if selected number of HTF are all aligned in same direction.
Earlier this check was mandatory. Now it is optional.