Real NonRePaint MultiTimeFrame Stohastic
- Indicadores
- Aleksandr Martynov
- Versión: 1.0
- Activaciones: 10
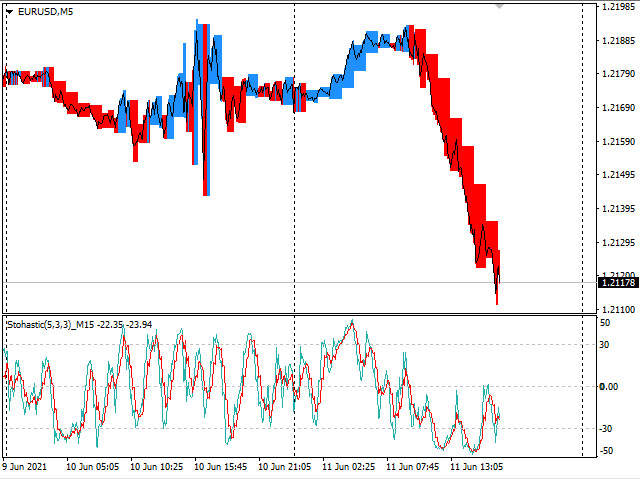
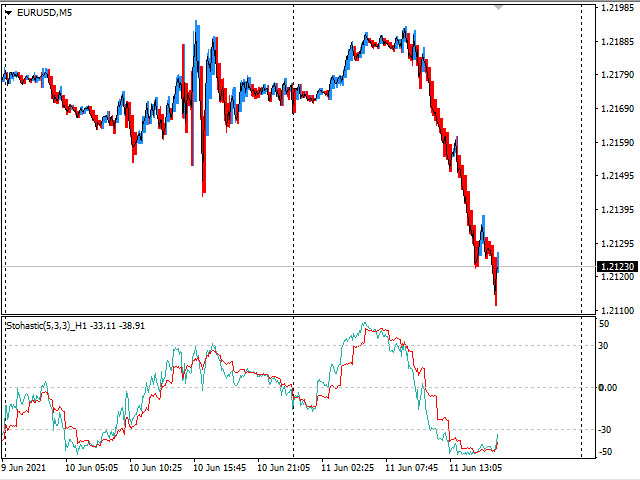
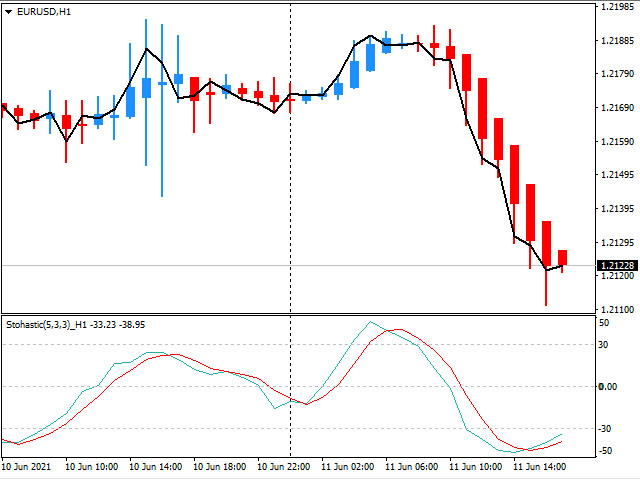
Indicator from the Real Non RePaint MultiTimeFrame (Real NRP MTF) series.
Specially designed to display the standard Stohastic indicator from the senior timeframe (TF) to the junior.
The indicator differs from the standard scale - symmetrical relative to 0. Add 50.0 to the readings to get the standard values.
Does not look into the future for history at the senior TF.
DOES NOT DIFFER from the real-time standard indicator (offset-based), but shows the actual indicator counts on the history for the older TF.
It can display the readings of the current TF.
Starting with the current Timeframe Parametr does not make sense - you can use the standard indicator.
Parametrs:
Timeframe - working timeframe (must be equal to or greater than the current or otherwise initialization error)
Price Type - price type for calculation High/Low or Close/Close
K Period - K Period
Slowing - deceleration period
Av Period - Signal Line Period
Av Metod - signal line calculation method
level - significant levels (symmetrically relative to 0)