Candle Bias Full Version
- Indicadores
- Dario Pedruzzi
- Versión: 1.42
- Activaciones: 5
---> Check all the other products <---
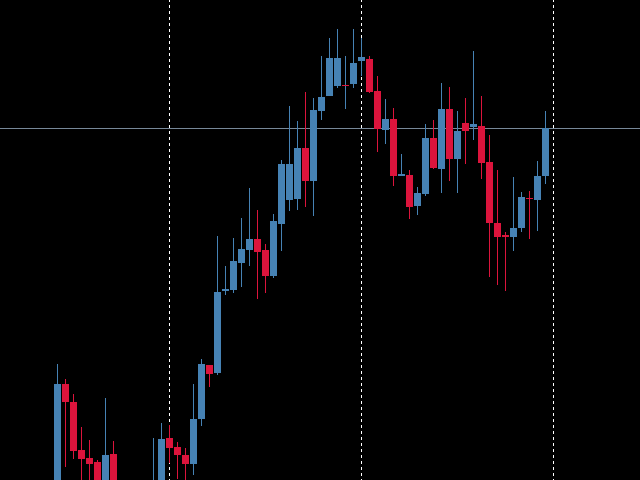
The Candle Bias is a coloring indicator that doesn't take account of the close price of the bars.
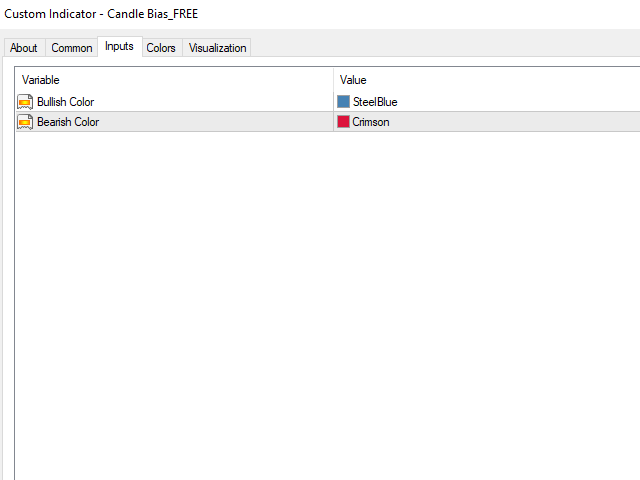
It will color the candle in the bearish color (of your choice) if the downard range is greater than the upward range.
Conversely, it will color the candle in the bullish color of your choice if the upward range is greater than the downward range.
This is a major helper for Multi Time Frame analysis, it works on every security and every Time Frame. You can easily spot the daily direction by taking in account the daily up and dow ranges.
Use it wisely.
Full version, if you want to try the free version, chek the link --> https://www.mql5.com/en/market/product/59515/
---> Have a look to all the other products <---
Produly developed by www.automazionetrading.com