Box Weis Wave
- Indicadores
- Thalles Nascimento De Carvalho
- Versión: 2.0
- Activaciones: 5
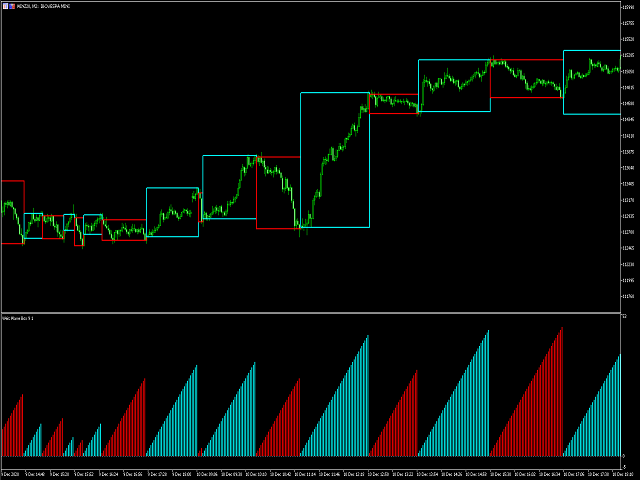
Si eres un trader activo y estás buscando una forma efectiva de interpretar los movimientos del mercado financiero, te encantará conocer Weis Wave Box. Este increíble indicador ha sido diseñado para ofrecer un análisis visual claro y preciso de las ondas de volumen, junto con la representación de los puntos de giro correspondientes. Con sus cinco formas de giro personalizables y otras características únicas, Weis Wave Box destaca como una herramienta indispensable tanto para traders experimentados como para principiantes.
Una característica notable de Weis Wave Box es su capacidad para crear ondas de volumen en intervalos personalizados. Esto te permite adaptarte a tus preferencias de trading y obtener resultados precisos y relevantes para tus estrategias. Además, el indicador tiene un límite de historial ajustable, lo que te permite centrarte en los períodos de tiempo deseados y analizar tendencias específicas.
Una de las grandes ventajas de Weis Wave Box es su capacidad para proporcionar información sobre el volumen en intervalos y el volumen real. Comprender la diferencia entre estos dos tipos de volumen es fundamental para un análisis preciso del mercado. El indicador presenta esta información de manera clara y directa, lo que te permite tomar decisiones informadas y estratégicas.
Otro aspecto destacado de Weis Wave Box es su flexibilidad en cuanto a las formas de giro. Con cinco opciones diferentes, que incluyen totalVol, length, width, barDVol y lengthDVol, puedes personalizar tu análisis según tus preferencias y objetivos específicos. Esta versatilidad es una característica significativa que distingue a Weis Wave Box de otras herramientas de análisis técnico.
Adquiere ahora mismo Weis Wave Box y da un paso adelante en el mercado financiero. Con su interfaz amigable y sus potentes funcionalidades, este indicador te ayudará a identificar tendencias, puntos de reversión y oportunidades de trading rentables. Aprovecha la oportunidad de mejorar tus estrategias y elevar tus resultados a un nuevo nivel.
* Puedes adquirir el indicador Swing Point Volume en el siguiente enlace:
https://www.mql5.com/es/market/product/59094
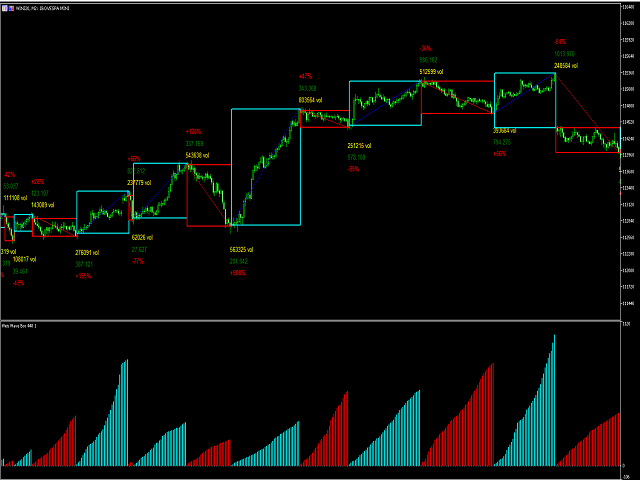


A Very good product.The Box format is very nice.The developer has said there are 5 options to print text near the boxes.The description pictures also show the Wave Distance printed next to the Boxes.However,I am not able to see any text printed near the boxes and I have tried all the options.Maybe something was missed in the update.I have sent a note to the developer and I am hoping that he would fix it soon to restore the full functionality as described.