Currency Strength 28 PAIRS
- Indicadores
- Stephen Fabrico
- Versión: 3.0
- Activaciones: 5
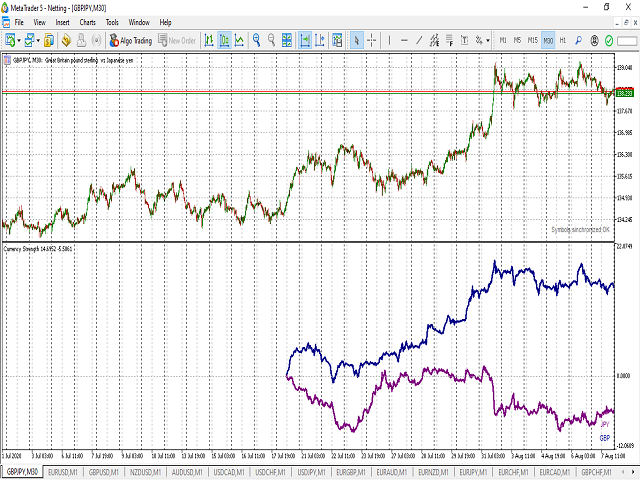
Description:
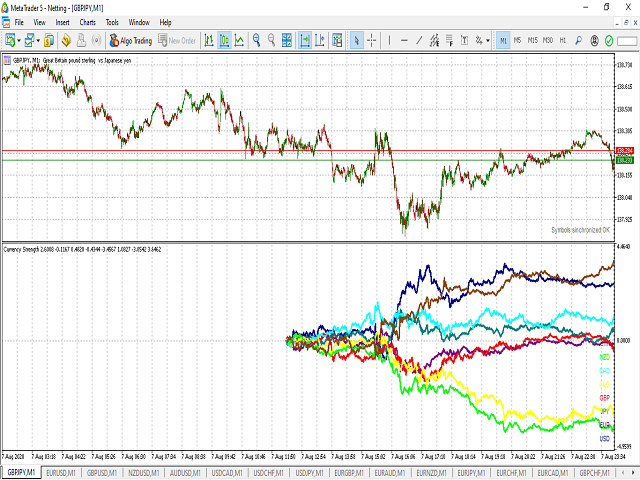
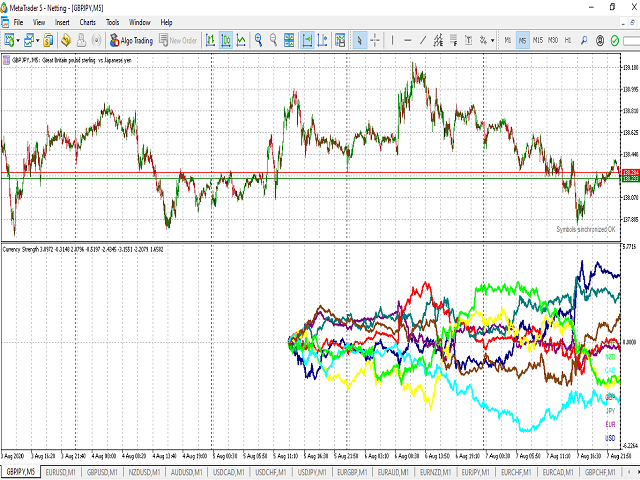
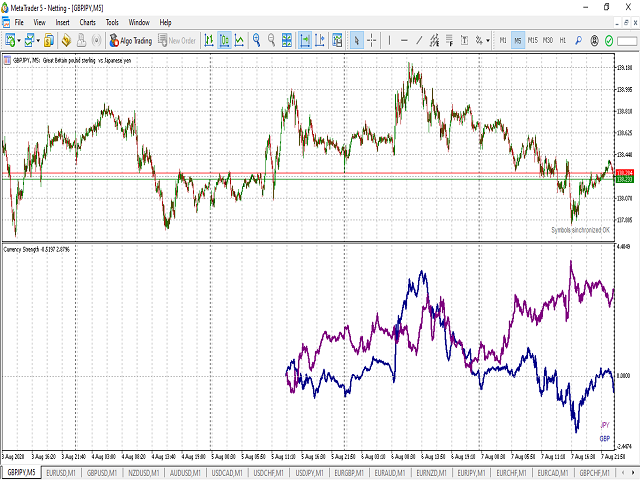
Never guess again which currency pairs are trending and which ones are not! This indicator shows exactly which currencies are gaining strength and which currencies are losing strength. The indicator can be used to very quickly determine which currency pairs are trending and which currency pairs are in a sideways motion. When one currency is gaining strength and another is losing strength, the corresponding currency pair is trending. Its as easy as that! For instance, if EUR is showing a positive trend and USD is showing a negative trend, EURUSD price action will show positive price move, and you can go long (BUY) EURUSD. Likewise, if EUR is showing a negative trend and USD is showing a positive trend, EURUSD price action will show a negative price move, and you can short (SELL) EURUSD. This method can be used for all 28 major currency pairs.
Which currency pairs can I use this indicator for?
This indicator shows the strength of 8 major currencies, including EUR, USD, GBP, CHF, CAD, JPY, NZD, and AUD. This means that this indicator can effectively be used to determine trends for 28 currency pairs. These currency pairs include EURUSD, GBPUSD,USDCHF, USDJPY, GBPJPY, NZDUSD, AUDUSD, USDCAD, EURGBP, EURAUD, EURNZD, EURJPY, EURCHF, EURCAD, GBPCHF, GBPNZD, AUDCAD, AUDCHF, AUDJPY, AUDNZD, NZDCHF, NZDCAD, NZDJPY, CHFJPY, CADCHF, CADJPY, GBPCAD, and GBPAUD.
What timeframes does this indicator work on?
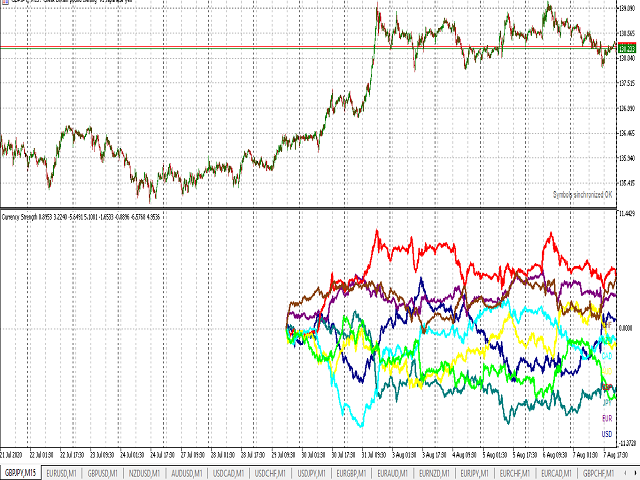
Currency Strength indicator works on all timeframes and correctly calculates percent change no matter what timeframe you decide to use.
How does this indicator work?
The Currency Strength indicator calculates the average percent change for all currency pairs from a user specified barshift away. All the user needs to do is be sure that all 28 currency pairs (see above) are listed in the Market Watch window.