TrendBar
- Indicadores
- Koji Kobayashi
- Versión: 2.5
- Actualizado: 7 agosto 2020
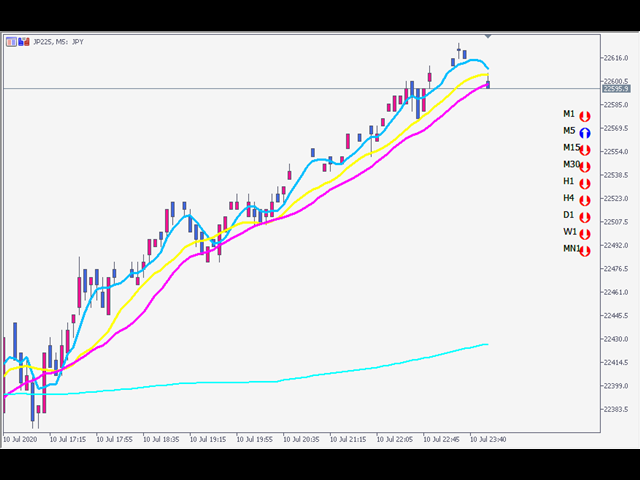
パラボリックのデータをもとにトレンドの方向性を1分足から月足まで表示します。
1分足から 月足 まで表示されているので今どの方向に価格が動いているのかがすぐに分かります。
更新はティク毎ではなくディフォルトでは1秒毎、もちろん変更も可能なのでチャートの表示が遅くなるようなことはありません。
機能:
どの通貨でも表示可能になります。
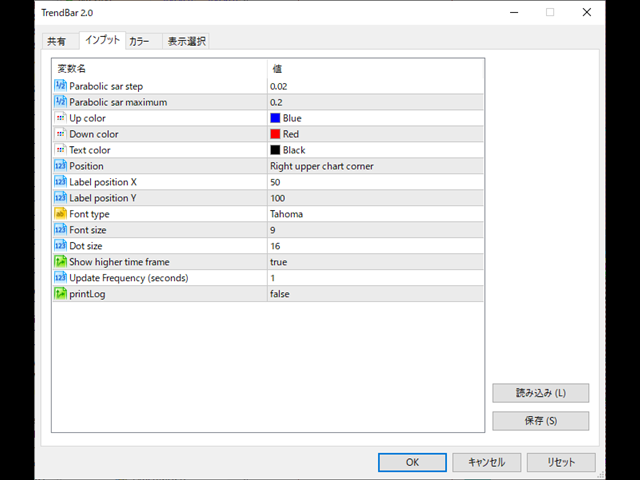
アイコンの色を指定することが可能になります。
表示位置(X軸、Y軸)が変更可能 になります。
表示位置 (左上 、 右上 、 左下 、 右下) が 指定 が可能 になります。
フォント を指定することが可能になります。
フォントサイズ が 変更可能 になります。
アイコンのサイズ が 変更可能 になります。
週足、 月足 の非表示 が 可能 になります。

Very good indicator, thank you