Clever Market Profile LVNs MT5
- Indicadores
- Carlos Forero
- Versión: 2.4
- Actualizado: 29 diciembre 2023
- Activaciones: 5
Descripción
El indicador utiliza la teoría del perfil de mercado para mostrar diariamente las zonas de negociación más relevantes. Las zonas que se muestran son LVN (nodos de bajo volumen) y POC (punto de control).
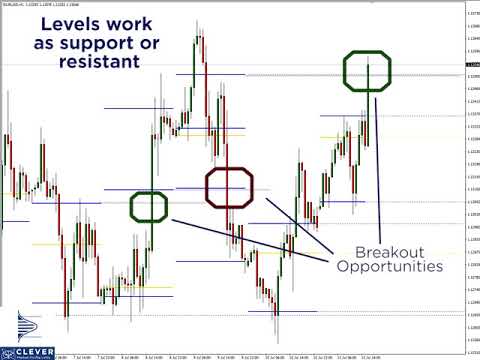
- Una zona LVN es aquella que representa las áreas de precios con menos tiempo o volumen a lo largo del día. Normalmente, estas zonas indican una iniciativa de oferta o demanda y, en el futuro, pueden convertirse en importantes zonas de ruptura o retroceso.
- Una zona POC es aquella que representa las áreas de precios con más tiempo o volumen a lo largo del día.
Soporte: Creamos grandes herramientas para toda la comunidad de traders. La mayoría de ellas son gratuitas.
Si crees en lo que hacemos Apóyanos Aquí.
ENLACES CLAVE: Cómo instalar - Preguntas frecuentes - Todos los productos
¿Para qué sirve este indicador?
- Le permitirá tener una referencia de las zonas de negociación más importantes para el día en curso, así como las anteriores al mismo.
- Le permitirá operar patrones de retroceso o ruptura, cada vez que se produzcan en una zona determinada.
- Podrá utilizar niveles vírgenes de LVN o POC de días anteriores, para identificar posibles niveles de resistencia o soporte. Tenga en cuenta que puede utilizar estos niveles como zonas de toma de beneficios.
- Para más usos investigue la teoría del perfil de mercado.
Componentes
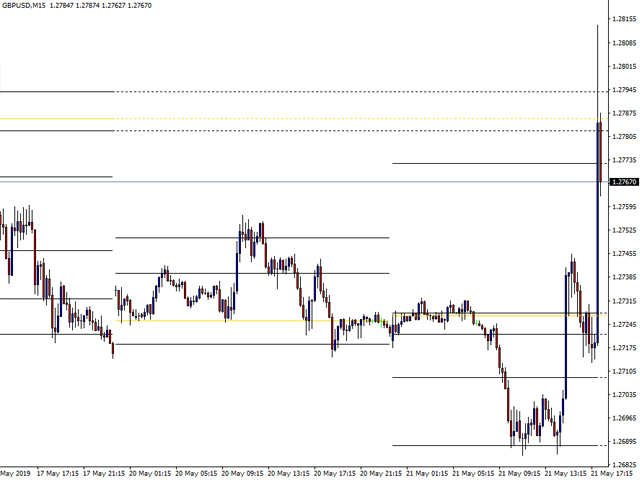
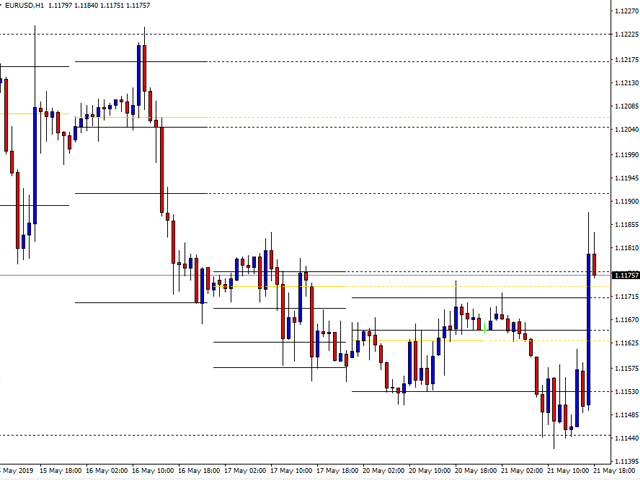
Para cada día, el indicador mostrará dentro de un gráfico de precios dado y bajo cualquier marco temporal, los siguientes componentes:
- Líneas negras horizontales: Representan las zonas LVN.
- Líneas horizontales amarillas: Representan zonas POC.
- Líneas horizontales discontinuas (negras/amarillas): Representan niveles vírgenes. Un nivel virgen es aquel que no se ha llenado en ningún periodo futuro.
Sobre el autor:
Carlos Forero, Miembro de Clever Trading Club, organización privada con el propósito de diseñar soluciones inteligentes para generar beneficios constantes con riesgo adaptado.


Macht einen guten Eindruck, arbeitet sauber. Der Entwickler reagiert schnell auf seine Kunden - Vielen Dank! Eine nützliche Unterstützung im Handelsalltag.