PZ Day Trading MT5
- Indicadores
- PZ TRADING SLU
- Versión: 7.2
- Actualizado: 17 octubre 2023
- Activaciones: 20
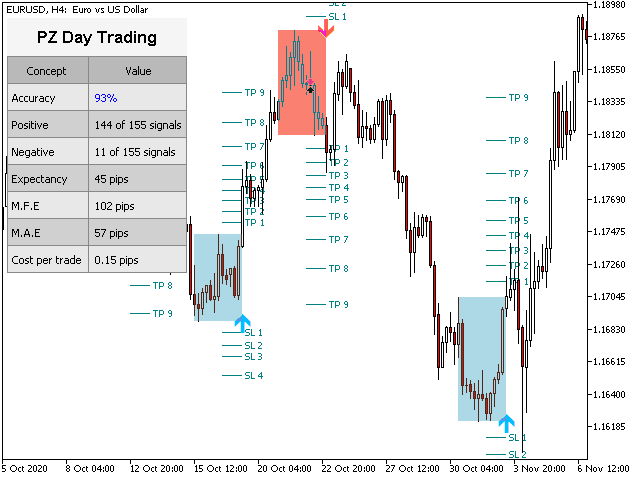
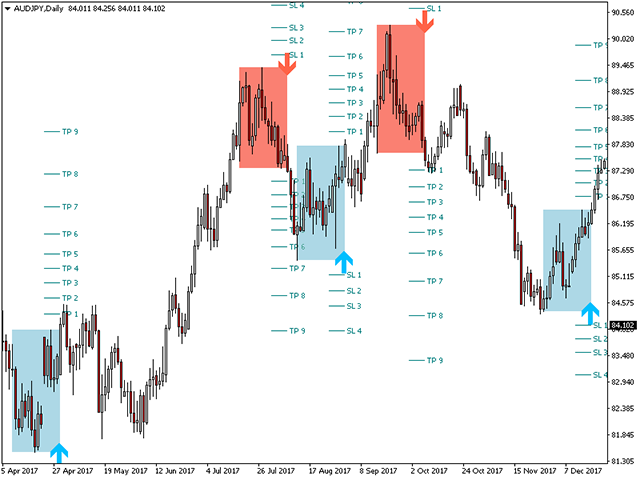
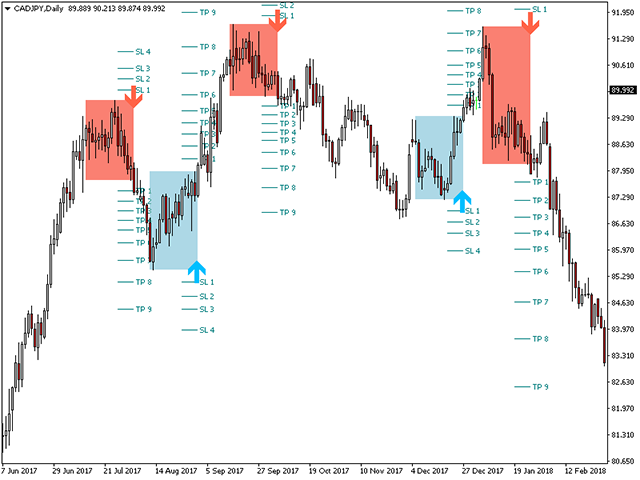
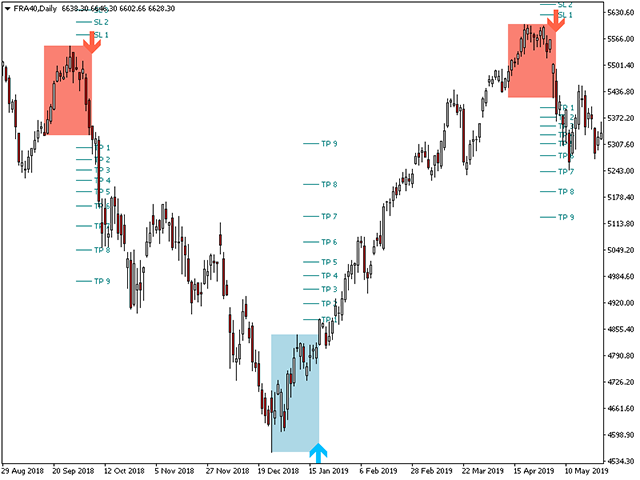
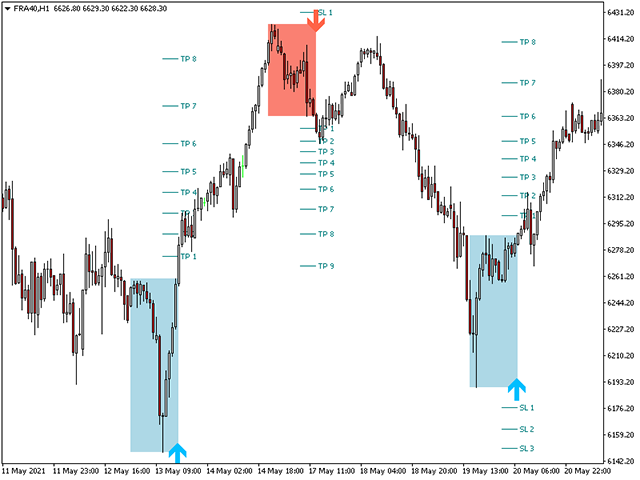
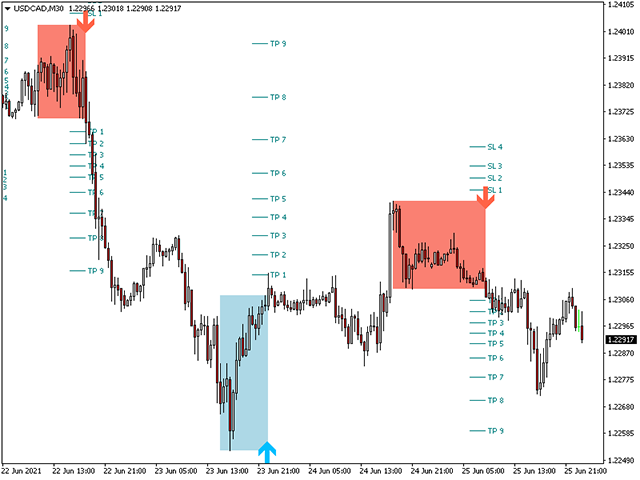
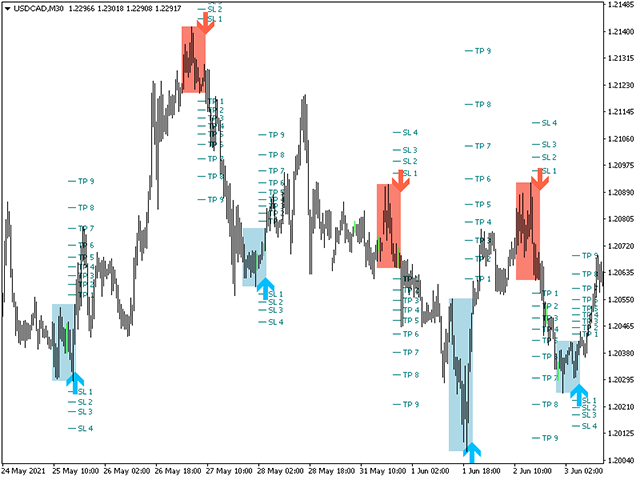
Este indicador detecta reversiones de precios en forma de zig-zag, utilizando solo análisis de acción de precios y un canal donchian. Ha sido diseñado específicamente para el comercio a corto plazo, sin repintar ni pintar en absoluto. Es una herramienta fantástica para comerciantes astutos con el objetivo de aumentar el tiempo de sus operaciones.
[ Guía de instalación | Guía de actualización | Solución de problemas | FAQ | Todos los productos ]
- Increíblemente fácil de comerciar
- Proporciona valor en cada período de tiempo.
- Implementa estadísticas de autoanálisis
- Implementa alertas por correo electrónico / sonido / visuales
Basado en rupturas y zonas de congestión de longitudes variables, el indicador usa solo la acción del precio para elegir operaciones y reacciona a lo que el mercado está haciendo muy rápido.
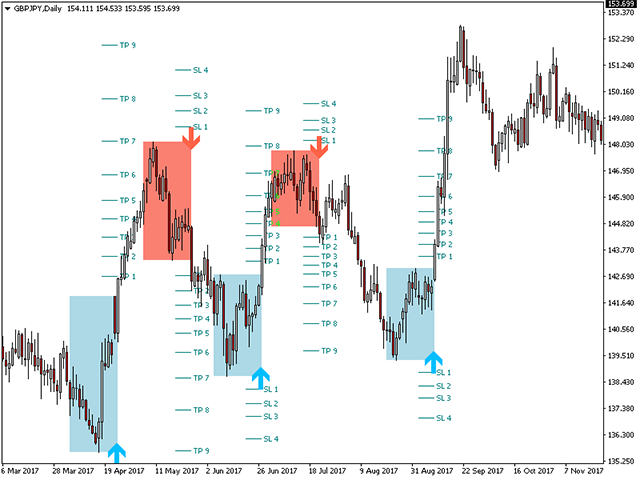
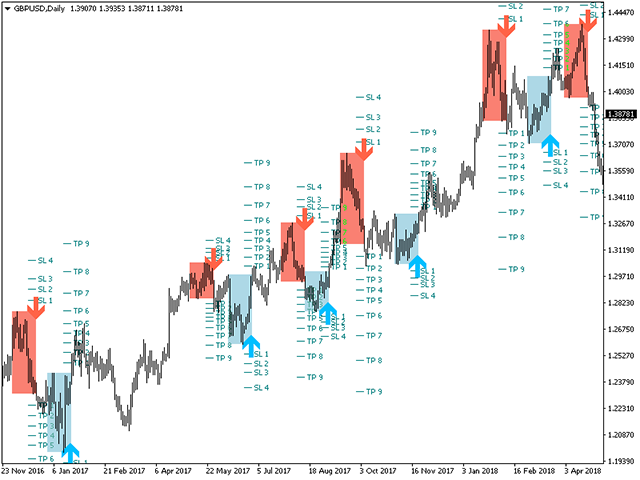
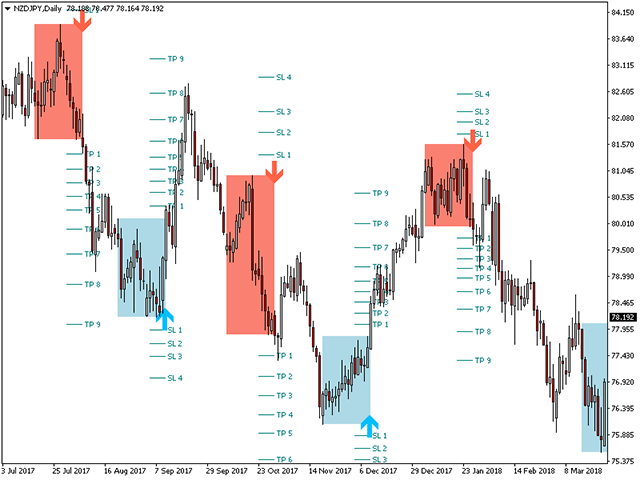
- Se muestra el beneficio potencial de las señales pasadas
- El indicador analiza su propia calidad y rendimiento.
- Los brotes perdidos se resaltan y se contabilizan
- El indicador es sin pintura y sin pintura
Este indicador ayudará a los comerciantes intradiarios a no perderse una sola reversión de precios. Sin embargo, no todas las reversiones de precios son iguales ni tienen la misma calidad procesable. Decidir qué rupturas comerciar y cuáles ignorar depende del buen juicio del comerciante.
Parámetros de entrada
- Rango: El rango es la cantidad mínima de barras rotas para considerar una ruptura válida y dibujar una señal. A medida que avanza en los plazos, debe aumentar este parámetro. Por ejemplo, para intercambiar gráficos mensuales, un rango de cinco es bueno, pero para intercambiar gráficos H1 necesitaría un rango de al menos 20-25 barras.
- Filtro: la función del filtro es separar las señales alternativas entre sí, utilizando un canal donchian y un multiplicador del rango de precios que crea. Un filtro más alto disminuirá la cantidad de señales en la tabla pero, en promedio, aumentará la excursión máxima favorable.
- Max History Bars: la cantidad de barras pasadas para evaluar cuando se carga el indicador. Disminuya este valor para acelerar la carga del indicador.
- Panel de control: habilite o deshabilite el widget de panel de marco de tiempo múltiple.
- Estadísticas: active o desactive el widget de estadísticas. Use las estadísticas para encontrar los mejores parámetros para cada símbolo y período de tiempo. Cambie gradualmente los parámetros de entrada del indicador hasta que encuentre la mayor precisión y expectativa posibles.
- Mostrar cuadros: muestra u oculta los cuadros de colores alrededor del rango de precios de ruptura.
- Cajas de relleno: elija si el interior de la caja de conexiones está lleno de color.
- Análisis comercial: active o desactive el análisis comercial individual en el gráfico.
- Alertas: habilite las alertas de pantalla / correo electrónico / push / sonido para los brotes.
Soporte y preguntas
Utilice el servicio de asistencia para preguntas o asistencia oportuna. Escriba un correo electrónico a: help@pointzero-trading.com
Autor
Arturo López Pérez, inversor privado y especulador, ingeniero de software y fundador de Point Zero Trading Solutions.


Amazing Indicator! With 14 years in this market, i just have to say that is a great product! With a few trades using my risk management just can't believe how awesome this indicator are!