• Información general
  • Comentarios (14)
  • Discusión (30)
  • Novedades

Dual Bermaui Deviation Percent

5

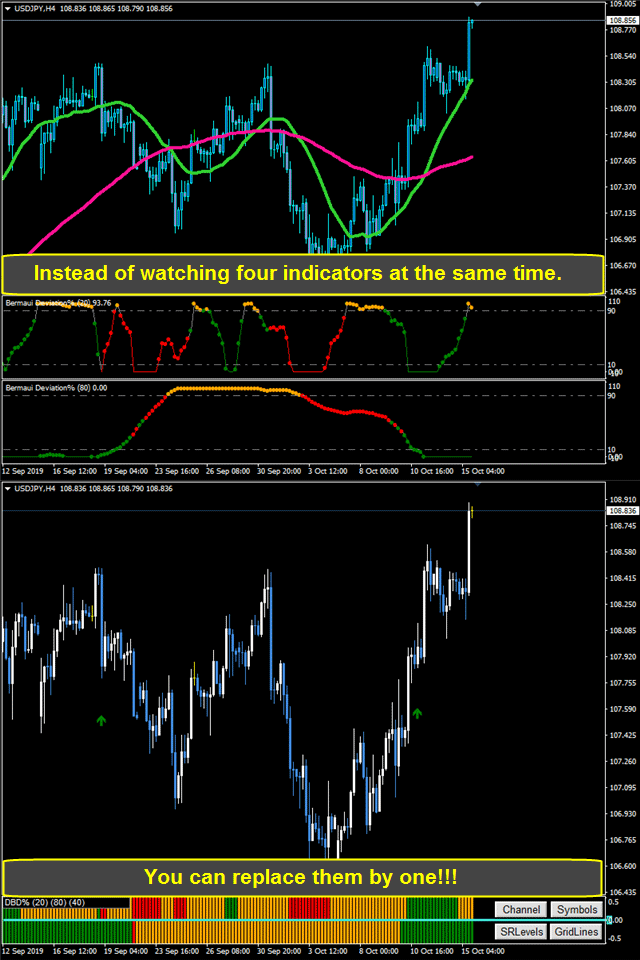
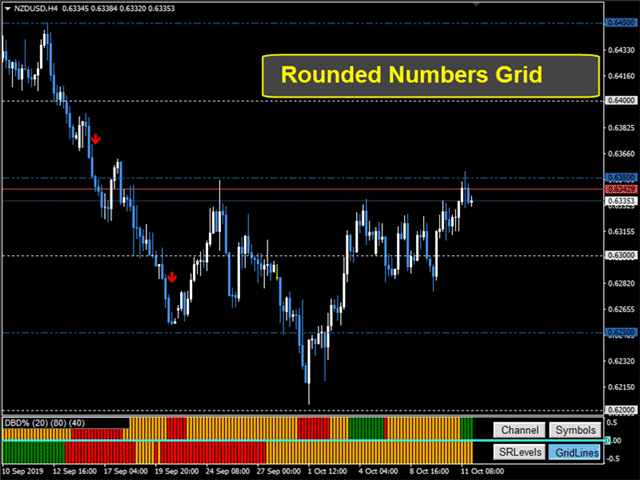
Or DBD%. The indicator consists of colored tape that shows trading signals depending on two Bermaui Deviation Oscillator (BD%) and two moving averages.

Bermaui Deviation Percent is a volatility index that measures volatility in percent rather than points. The idea of BD% is to make an index depending on Classic Standard Deviation (CSD) that moves between 0 and 100 percent.

Important Information

DBD% expert advisor example:  https://www.mql5.com/en/blogs/post/731145

        If you want to know more about BD% then please read the next bog:  https://www.mql5.com/en/blogs/post/718182


        DBD% consists of two signal tapes, one is fast and the other is slow. A buy signal comes when fast and slow are bullish. A sell signal comes when both fast and slow are bearish.

        DBD% Features

               The combination of two BD% with two different periods could help at catching the different market cycles.

               Using BD% as a trend filter is a great advantage because of BD% work as a filter for low volatility movements in the market.

               Signals appear at the first opening after buy/sell conditions are met.

               Well-designed parameters to help the user easily navigate between them.

               DBD% code is revised to make sure that it will not consume the user's PC memory.

               DBD% arrows do not repaint or recalculate its results.

               DBD% sends emails and push notifications to mobile devices.

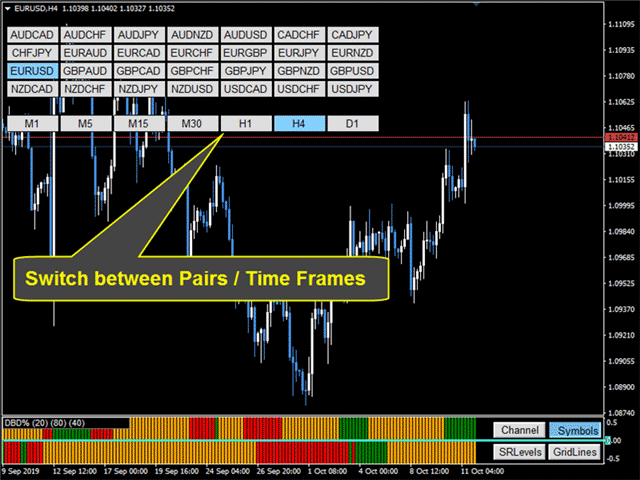
               Easily switch between different symbols or time-frames.

               Plot Standard Deviation or Linear Regression Channels to show Overbought and Oversold areas.

               Plot a grid of rounded numbers, which show the most important psychological levels.

               Plot Support and resistance levels that mirror supply and demand on the chart.

              DBD% Parameters Map

              1) INDICATOR SETTINGS

                    Fast DBD% Candles [Min=2]: Default is 20. Minimum is 2.

                    Slow DBD% Candles [Min=3]: Default is 80. Minimum is 3and slow should be bigger than fast at least by one candle.

                    DBD% Sideway Level: Default 40%

                  2) ALERTS & EMAIL SETTINGS

                        Alert on New Arrow: Default is true.

                        Send Email on New Arrow: Default is false.

                        Send Notification on New Arrow: Default is false.


                      3) ARROWS SETTINGS

                           Show Arrows & Lines: Default is Show Arrows Only.

                           Arrows Size: Default is one.


                          4) UTILITIES SETTINGS

                               Symbols Source From: Get symbols from custom symbol list  or from Market Watch.

                               List of symbols (separated by ";"): If you choose symbols from a custom list then separate between symbols by ";".

                               Button Font Size: Default is 10.

                               Chart on Foreground: Default is false.

                               Channel Length [ > 1 ]: Default is 100.

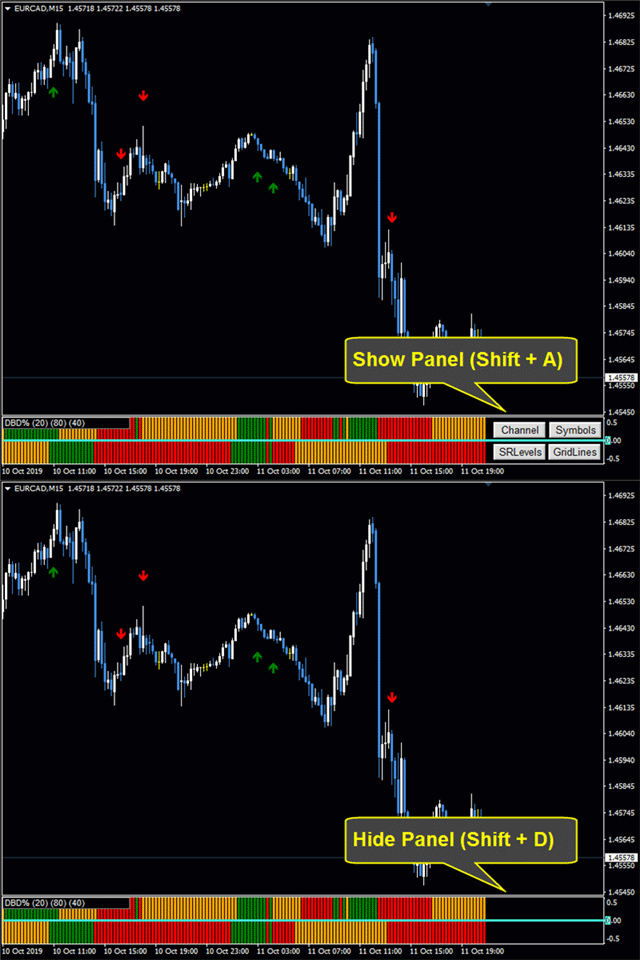
                               Panel Appear [Shift + Letter]: Key to press plus shift if the user wants to hide the panel. Default is " A".

                               Panel Disappear [Shift + Letter]: Key to press plus shift if the user wants to hide the panel. Default is " D".

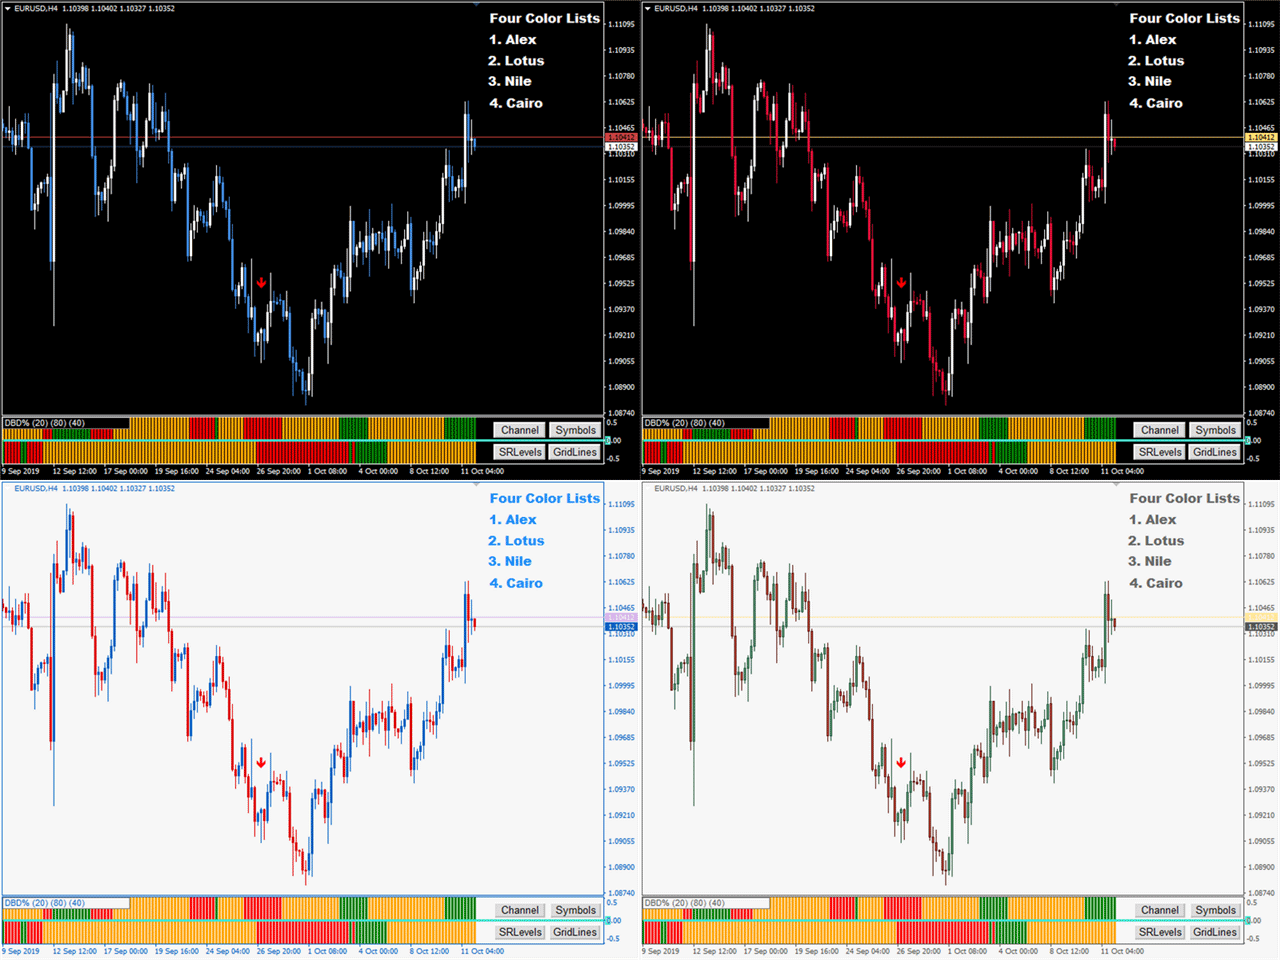
                               Chart Colors List: Four color lists to choose from. If the user wants to use his own colors then he can choose to (Do Nothing).


                              If you have any questions then please, contact me via a private message or, write them in the comment section.
                              Muhammad Al Bermaui, CMT


                              Comentarios 14
                              Hisham Ghoneim
                              301
                              Hisham Ghoneim 2021.09.22 09:39 
                               

                              I already purchase the full set EA + BD% +DBD% as i' satisfied with Elbermawi trading tool and this is not my first time dealing with his great trading tools, it is really helpful for good trading results.

                              Paulina Andrea Madariaga Figueroa
                              4107
                               

                              Very good indicator, I have spent money in another indicators and with Bermaui tools I have everything.

                              digger55
                              237
                              digger55 2020.01.15 18:08 
                               

                              Good and professional tool.

                              Productos recomendados
                              "The Squeeze indicator attempts to identify periods of consolidation in a market. In general the market is either in a period of quiet consolidation or vertical price discovery. By identifying these calm periods, we have a better opportunity of getting into trades with the potential for larger moves. Once a market enters into a "squeeze," we watch the overall market momentum to help forecast the market direction and await a release of market energy." The StdATR Squeeze Channel combines standard
                              This is an intraday indicator that uses conventional formulae for daily and weekly levels of pivot, resistance and support, but updates them dynamically bar by bar. It answers the question how pivot levels would behave if every bar were considered as the last bar of a day. At every point in time, it takes N latest bars into consideration, where N is either the number of bars in a day (round the clock, i.e. in 24h) or the number of bars in a week - for daily and weekly levels correspondingly. So,
                              The indicator is the advanced form of the MetaTrader 4 standard Fibonacci tool. It is unique and very reasonable for serious Fibonacci traders. Key Features Drawing of Fibonacci retracement and expansion levels in a few seconds by using hotkeys. Auto adjusting of retracement levels once the market makes new highs/lows. Ability to edit/remove any retracement & expansion levels on chart. Auto snap to exact high and low of bars while plotting on chart. Getting very clear charts even though many ret
                              COG LR Osc AM
                              Andriy Matviyevs'kyy
                              The presented indicator allows you to determine potential entry points into the market and set protective orders at reasonable levels. This product can be useful for both beginners and experienced traders. The indicator is based on calculation methods proven by time and practicing traders. The indicator is calculated in two stages: At the first stage, linear regression (LR) of the selected price type is determined for a given number of chart periods. At the second stage, the obtained data is p
                              Simple Long Short Bar A very concise and clear indicator, very easy to understand, but it is very useful for tracking trends. The usage of this indicator is very simple: Long signal: If the price shows signs of a long market, then a yellow box will appear. Short signal: If the price shows signs of a short market, then a blue box will appear. Bull strength: If the size of the box is large, it means the bull strength is strong, and vice versa. Short strength: If the size of the box is small, it m
                              The Icarus Auto Dynamic Support and Resistance  Indicator provides a highly advanced, simple to use tool for identifying high-probability areas of price-action automatically - without any manual input whatsoever. .  All traders and investors understand the importance of marking horizontal levels on their charts, identifying areas of supply and demand, or support and resistance. It is time-consuming and cumbersome to manually update all instruments, across all timeframes, and it requires regular
                              Trend formation channel is a set of lines. The two central lines of the indicator represent moving averages of the specified type and period, they also form a small channel. The large channel is formed - the central lines of the indicator plus / minus the standard deviation estimate, multiplied by the coefficient selected by the user. The basic rule for plotting is that about 5% of prices should be outside these lines, and 95% - inside. If the price crosses the upper or lower line too often, th
                              PZ Harmonacci Patterns
                              PZ TRADING SLU
                              3.43 (7)
                              Este es posiblemente el indicador de reconocimiento automático de formación de precios más completo que puede encontrar para la plataforma MetaTrader. Detecta 19 patrones diferentes, toma las proyecciones de Fibonacci tan en serio como usted, muestra la zona de reversión potencial (PRZ) y encuentra niveles adecuados de stop-loss y take-profit. [ Guía de instalación | Guía de actualización | Solución de problemas | FAQ | Todos los productos ] Detecta 19 formaciones de precios armónicos difer
                              Fibonacci retracements can be used to draw support lines, identify resistance levels, place stop-loss orders and set target prices. The Advanced Automatic Fibonacci retracements draws automatically all the levels. You have a lot of options to choose. For exemple you can use the tracements of another time frame (MTF) in the current chart, you can also choose between the closest level or less close to draw the retracements. You can also add 2 levels of your choice. You can add levels extensions o
                              Automatic fibonacci with alerts is an indicator that automatically plots a fibonacci retracement based on the number of bars you select on the BarsToScan setting in the indicator. The fibonacci is automatically updated in real time as new highest and lowest values appear amongst the selected bars. You can select which level values to be displayed in the indicator settings. You can also select the color of the levels thus enabling the trader to be able to attach the indicator several times with d
                              FiboZag
                              Andriy Sydoruk
                              Indicator FiboZag - transfer the indicator to the chart and the Fibonacci levels will be built automatically on the last ZigZag turn. The main advantage lies in the correct construction of Fibonacci levels and markup of price levels. Simple, visual and effective use. The indicator is not redrawn and does not lag. Works on all currency pairs and on all timeframes.
                              TSO Bollinger Bandit Strategy is an indicator based on the Bollinger Bandit Trading Strategy as presented in the book Building Winning Trading Systems with TradeStation by G. Pruitt and J. R. Hill. SCANNER is included . Now with Scanner you can find trading opportunities and setups easily and faster. Features A complete entry and exit strategy for trending markets. Get email / push notifications when an entry signal occurs. The indicator is not repainting. Can easily be used in an EA. (see For
                              Fibonaccitools
                              Aymn Sʿyd Ahmd Hsn Alkwmy
                              Los retrocesos de Fibonacci son herramientas populares que los operadores pueden usar para dibujar líneas de soporte, identificar niveles de resistencia, colocar órdenes de stop-loss y establecer precios objetivo. Un retroceso de Fibonacci se crea tomando dos puntos extremos en un gráfico de acciones y dividiendo la distancia vertical por las razones clave de Fibonacci de 23.6%, 38.2%, 50%, 61.8% y 100%. El indicador de herramientas de Fibonacci dibujará herramientas de Fibonacci, p. Ej. Retroc
                              Crazy Dancing moving RES/SUP Levels Automatic redrawing of moving Supports and resistances levels  to indicate price breaking supports (signal SELL)  or breaking resistance levels (signal BUY) Very simple appearing indicator but very clever and smart too !!!! Main Inputs: # of bars for the support and resistances levels + the initial shift from start + moving average for filter signaling Smaller values for bars /shift inputs when using Higher Time frames (D1-H4) and the reverse higher values for
                              VR Cub
                              Vladimir Pastushak
                              VR Cub es un indicador para obtener puntos de entrada de alta calidad. El indicador fue desarrollado para facilitar los cálculos matemáticos y simplificar la búsqueda de puntos de entrada a una posición. La estrategia comercial para la cual se diseñó el indicador ha demostrado su eficacia durante muchos años. La simplicidad de la estrategia comercial es su gran ventaja, que permite que incluso los operadores novatos negocien con éxito con ella. VR Cub calcula los puntos de apertura de posiciones
                              The indicator displays Renko bars on the chart, uses them to plot the ZigZag - trend lines connecting the local Lows and Highs of the price movement, and highlights them based on the Gartley patterns, showing the potential price reversal points. Renko - specialized display of the price action, in which the graph is displayed not every bar of the time frame, but only under the condition that the price had passed more than the specified number of points. Renko bars are not bound to a time frame, s
                              Bermaui Bands
                              Muhammad Elbermawi
                              4.94 (89)
                              Bermaui Bands (BB) es una herramienta de análisis técnico que ayuda a filtrar entre los movimientos de precios de rango y tendencia. La idea detrás de este indicador se puede explicar en los siguientes pasos: Calcule la desviación estándar como un oscilador que se mueve entre 0 y 100. Lo llamaré porcentaje de desviación de Bermaui (BD%). Si "BD%" está cerca de cero, la volatilidad está en su punto máximo. Además, si "BD%" está cerca de 100, la volatilidad es muy baja. Una alta volatilidad signif
                              The Sextet Scalper Pro  is an MT4 indicator that gives signals when new waves are starting in a trend. The trends are calculated using the original " The Sextet " indicator method. You get a free EA to trade with The Sextet Scalper Pro: Free EA . Default settings were optimized on GBPUSD H1 from 2017. EA could be tested on free demo version of The Sextet Scalper Pro, before purchase. Key Features: Uses The Sextet Trend Detection Method which is already a good strategy in itself for detecting l
                              PABT Pattern Indicator - it's classical system one of the signal patterns. Indicator logic - the Hi & Lo of the bar is fully within the range of the preceding bar, look to trade them as pullback in trend. In the way if indicator found PABT pattern it's drawing two lines and arrow what showing trend way.  - First line - it's entry point and drawing at: 1. On the high of signal bar or on middle of the signal bar (depending from indicator mode) for buy; 2. On the low of signal bar or on middle of t
                              Noize Absorption Index MT4
                              Ekaterina Saltykova
                              5 (1)
                              Noize Absorption Index - is the manual trading system that measures the difference of pressure between bears forces and bulls forces. Green line - is a noize free index that showing curent situation. Zero value of index shows totally choppy/flat market.Values above zero level shows how powerfull bullish wave is and values below zero measures bearish forces.Up arrow appears on bearish market when it's ready to reverse, dn arrow appears on weak bullish market, as a result of reverse expectation. S
                              This is a well-known ZigZag indicator. But it differs by the fact that its plot is based on values of the middle line which is set by a user. It can display Andrews’ Pitchfork and standard or Bobokus Fibo levels. NO REPAINTING. Parameters Period МА — middle line period. Default value is 34. Minimum value is 4. Maximum value is set at your discretion. Used to calculate price - base price to calculate the middle line. The averaging method - method of smoothing the middle line. Turning pitchfork
                              A top-quality implementation of the famous  Zig Zag  indicator, which needs no introduction. It is completely coming from original algorithm.  After you have this indicator, you will no need any more indicator for opposite direction of trend. Trading direction of TREND Very easy to understand and set  It implements a multi-timeframe dashboard Buy and Sell signals on same chart  Working M5-M15-M30-H1-H4 and D1  After the purchase, please contact me for to learn how to use it. 
                              Trendiness Index
                              Libertas LLC
                              5 (3)
                              "The trend is your friend" is one of the best known sayings in investing, because capturing large trendy price movements can be extremely profitable. However, trading with the trend is often easier said than done, because many indicators are based on price reversals not trends. These aren't very effective at identifying trendy periods, or predicting whether trends will continue. We developed the Trendiness Index to help address this problem by indicating the strength and direction of price trend
                              LordTrendSignal
                              Igor Pereira Calil
                              LordTrendSignal is a financial market indicator for Meta Trader that checks signals through trends and candles, works on all TimeFrames (M1, M5, M15, M30, H1, H4, D1). LordTrendSignal checks the signal through trends and candles and informs you via notification, alerts via email and push on the automatic screen. The trend flexibility of LordTrendSignal is high, however, together with other of our indicators LordAutoFibonacci and LordAutoTrendLine you will be able to work very well to obtain
                              The Arrows Forecasters indicator is simple, visual and effective trend detection. The intelligent algorithm of the indicator determines the trend with a good probability. Uses just one parameter for settings. The indicator shows the points of potential market reversal. Ready-made trading system. The indicator does not redraw and does not lag. Works on all currency pairs and on all timeframes. You should remember that using a combination of forecasting tools, it is advisable to choose 2-3 indi
                              Níveis de suporte ou resistência formados quando a ação do preço de um mercado reverte e muda de direção, deixando para trás um pico ou vale (ponto de oscilação) no mercado. Os níveis de suporte e resistência podem criar faixas de negociação. O indicador identifica High e Low com base no Período. Características principais Um conceito chave da análise técnica é que quando um nível de resistência ou suporte é quebrado, seu papel é invertido. Se o preço cair abaixo de um nível de suporte, esse
                              Trend Divergence Finder – индикатор, позволяющий выявлять дивергенции цены и графика выбранного индикатора. С помощью Trend Divergence Finder вы сможете подобрать тот индикатор, который наиболее эффективен для Вас, и использовать его с наглядным отображением на графике. В индикатор включены 9 базовых индикаторов : 1.        RSI 2.        MACD 3.        MOMENTUM 4.        RVI 5.        STOCHASTIC 6.        CCI 7.        Standard Deviation 8.        Derivative 9.        William Blau Присутст
                              This is a new strategy for SUPPLY DEMAND areas It is based on a calculation using the tick volume to detect the big price action in market for both bear /bull actions this smart volume action candles are used to determine the supply and demand areas prices in between main supply and demand lines indicate sideway market  up arrows will be shown when prices moves above the main supply and the secondary supply lines Down arrows will be shown when prices moves below the main demand and the secondary
                              DMS Fibo
                              Diogo Mitsunaga Dos Santos
                              Fibonacci retracements are trend lines drawn between two significant points, usually between absolute lows and absolute highs, plotted on a chart. Intersecting horizontal lines are placed at the Fibonacci levels. Fibonacci retracements are useful tools that help traders identify support and resistance levels. With the information gathered, they can place orders, identify stop-loss levels, and set price targets. Although useful, traders often use other indicators to make more accurate assessments
                              BeST Swing Strategy is a Metatrader indicator based on the corresponding Jim Berg's work about volatility as described in his article "The Truth About Volatility" (TASC 2/2005).The indicator consists of 2 channel lines deriving as (MA +/- times the ATR) and can be used as a standalone trading system.The outlier prices of the Market as of the indicator's values can be used for producing Entry and Exit Signals. Advantages of the indicator == Uses 2 Swing Strategies (Normal and Reverse) == Ne
                              Los compradores de este producto también adquieren
                              Gann Made Easy
                              Oleg Rodin
                              4.95 (44)
                              Gann Made Easy es un sistema de comercio de Forex profesional y fácil de usar que se basa en los mejores principios de comercio utilizando la teoría del Sr. W. D. Gann. El indicador proporciona señales precisas de COMPRA y VENTA, incluidos los niveles de Stop Loss y Take Profit. Puede comerciar incluso sobre la marcha utilizando notificaciones PUSH. ¡Por favor, póngase en contacto conmigo después de la compra! ¡Compartiré mis consejos comerciales con usted y excelentes indicadores de bonificació
                              Presentamos el Indicador Milagroso de Forex: Desata el Poder del Trading Preciso ¿Estás cansado de buscar el mejor indicador de Forex que realmente ofrezca resultados excepcionales en todos los marcos temporales? ¡No busques más! Ha llegado el Indicador Milagroso de Forex para revolucionar tu experiencia de trading y llevar tus ganancias a nuevas alturas. Construido sobre una base de tecnología de vanguardia y años de desarrollo meticuloso, el Indicador Milagroso de Forex se erige como el pinácu
                              ¡Actualmente 20% OFF ! ¡La mejor solución para cualquier novato o trader experto! Este software funciona con 28 pares de divisas. Se basa en 2 de nuestros principales indicadores (Advanced Currency Strength 28 y Advanced Currency Impulse). Proporciona una gran visión general de todo el mercado de divisas. Muestra los valores de Advanced Currency Strength, la velocidad de movimiento de las divisas y las señales para 28 pares de divisas en todos los (9) marcos temporales. Imagine cómo mejorar
                              TPSpro RFI Levels
                              Roman Podpora
                              5 (13)
                              A key element in trading is zones or levels from which decisions to buy or sell a trading instrument are made. Despite attempts by major players to conceal their presence in the market, they inevitably leave traces. Our task was to learn how to identify these traces and interpret them correctly. Reversal First Impulse levels (RFI)   -  Version MT5                INSTRUCTIONS                 RUS                 ENG                                       R ecommended to use with an indicator   -  
                              TPSproTREND PrO
                              Roman Podpora
                              5 (15)
                              TPSpro TRENDPRO  - is a trend indicator that automatically analyzes the market and provides information about the trend and each of its changes, as well as giving signals for entering trades without redrawing! The indicator uses each candle, analyzing them separately. referring to different impulses - up or down impulse. Exact entry points into transactions for currencies, crypto, metals, stocks, indices!  -  Version MT5               DETAILED DESCRIPTION        /       TRADING SETUPS           
                              Atomic Analyst
                              Issam Kassas
                              5 (1)
                              En primer lugar, vale la pena enfatizar que este Indicador de Trading no repinta, no redibuja y no se retrasa, lo que lo hace ideal tanto para el trading manual como para el automatizado. El Analista Atómico es un Indicador de Acción del Precio PA que utiliza la fuerza y el impulso del precio para encontrar una mejor ventaja en el mercado. Equipado con filtros avanzados que ayudan a eliminar ruidos y señales falsas, y aumentan el potencial de trading. Utilizando múltiples capas de indicadores
                              ACTUALMENTE 26% DE DESCUENTO ¡La mejor solución para cualquier operador novato o experto! Este indicador es una herramienta única, de alta calidad y asequible porque hemos incorporado una serie de características propias y una nueva fórmula. ¡Con sólo UN gráfico puede leer la Fuerza de la Divisa para 28 pares de Divisas! Imagínese cómo mejorará su operativa porque podrá señalar el punto exacto de activación de una nueva tendencia o de una oportunidad de scalping. Manual del usuario: haga
                              Scalper Inside PRO
                              Alexey Minkov
                              4.75 (55)
                              An exclusive indicator that utilizes an innovative algorithm to swiftly and accurately determine the market trend. The indicator automatically calculates opening, closing, and profit levels, providing detailed trading statistics. With these features, you can choose the most appropriate trading instrument for the current market conditions. Additionally, you can easily integrate your own arrow indicators into Scalper Inside Pro to quickly evaluate their statistics and profitability. Scalper Inside
                              Trend Screener
                              STE S.S.COMPANY
                              4.83 (86)
                              Indicador de tendencia, solución única e innovadora para el comercio y filtrado de tendencias con todas las funciones de tendencias importantes integradas en una sola herramienta. Es un indicador 100% sin repintar de marcos temporales y monedas múltiples que se puede usar en todos los símbolos/instrumentos: divisas, materias primas, criptomonedas, índices y acciones. Trend Screener es un indicador de seguimiento de tendencia eficiente que proporciona señales de tendencia de flecha con puntos en
                              Introduciendo       Indicador Quantum Trend Sniper   , el innovador indicador MQL5 que está transformando la forma en que identificas y negocias los cambios de tendencia. Desarrollado por un equipo de comerciantes experimentados con experiencia comercial de más de 13 años,       Indicador de francotirador de tendencia cuántica       está diseñado para impulsar su viaje comercial a nuevas alturas con su forma innovadora de identificar cambios de tendencia con una precisión extremadamente alta.
                              TrendMaestro
                              Stefano Frisetti
                              5 (2)
                              note: this indicator is for METATRADER4, if you want the version for METATRADER5 this is the link: TRENDMAESTRO recognizes a new TREND in the bud, he never makes mistakes. The certainty of identifying a new TREND is priceless. DESCRIPTION TRENDMAESTRO identifies a new TREND in the bud, this indicator examines the volatility, volumes and momentum to identify the moment in which there is an explosion of one or more of these data and therefore the moment in which prices have strong probability of f
                              Ante todo, vale la pena enfatizar que esta Herramienta de Trading es un Indicador No Repintado, No Redibujado y No Retrasado, lo que la hace ideal para el trading profesional. El Indicador de Conceptos de Acción del Precio Inteligente es una herramienta muy potente tanto para traders nuevos como experimentados. Combina más de 20 indicadores útiles en uno solo, combinando ideas avanzadas de trading como el Análisis del Trader del Círculo Interior y Estrategias de Trading de Conceptos de Dinero
                              Currency Strength Wizard es un indicador muy poderoso que le proporciona una solución todo en uno para operar con éxito. El indicador calcula el poder de este o aquel par de divisas utilizando los datos de todas las monedas en múltiples marcos de tiempo. Estos datos se representan en forma de índice de moneda fácil de usar y líneas eléctricas de moneda que puede usar para ver el poder de esta o aquella moneda. Todo lo que necesita es adjuntar el indicador al gráfico que desea operar y el indicad
                              XQ Indicator MetaTrader 4
                              Marzena Maria Szmit
                              3 (2)
                              Step into the realm of Forex trading with confidence and precision using XQ, a cutting-edge Forex indicator designed to elevate your trading game to unprecedented heights. Whether you're a seasoned trader or just stepping into the world of currency exchange,   XQ Forex Indicator   empowers you with the insights and signals needed to make informed trading decisions. The signal conditions are a combination of three indicators, and XQ Forex Indicator only display  medium and long-term trends . The
                              ¡Descubra el secreto para el comercio de Forex exitoso con nuestro indicador MT4 personalizado! ¿Alguna vez se ha preguntado cómo lograr el éxito en el mercado de Forex, obteniendo ganancias constantemente al tiempo que minimiza el riesgo? ¡Aquí está la respuesta que ha estado buscando! Permítanos presentar nuestro indicador MT4 patentado que revolucionará su enfoque para el comercio. Versatilidad única Nuestro indicador está especialmente diseñado para usuarios que prefieren las formacio
                              Advanced Supply Demand
                              Bernhard Schweigert
                              4.92 (310)
                              ¡Actualmente con 33% de descuento! ¡La mejor solución para cualquier tráder principiante o experto! Este indicador es una herramienta comercial única, de alta calidad y asequible, porque incorpora una serie de características patentadas y una nueva fórmula. Con esta actualización, podrá mostrar zonas de doble marco temporal. No solo podrá mostrar un marco temporal más alto, sino también mostrar ambos, el marco temporal del gráfico MÁS el marco temporal más alto: MOSTRANDO ZONAS ANIDADAS. A todos
                              Quantum Breakout Indicator PRO
                              Bogdan Ion Puscasu
                              4.96 (26)
                              Introduciendo       Quantum Breakout PRO   , el innovador indicador MQL5 que está transformando la forma en que comercia con Breakout Zones. Desarrollado por un equipo de operadores experimentados con experiencia comercial de más de 13 años,   Quantum Breakout PRO   está diseñado para impulsar su viaje comercial a nuevas alturas con su innovadora y dinámica estrategia de zona de ruptura. El indicador de ruptura cuántica le dará flechas de señal en las zonas de ruptura con 5 zonas objetivo de
                              Scalper Vault
                              Oleg Rodin
                              5 (27)
                              Scalper Vault es un sistema profesional de reventa que le brinda todo lo que necesita para una reventa exitosa. Este indicador es un sistema comercial completo que puede ser utilizado por operadores de divisas y opciones binarias. El marco de tiempo recomendado es M5. El sistema le proporciona señales de flecha precisas en la dirección de la tendencia. También le proporciona señales superiores e inferiores y niveles de mercado de Gann. Los indicadores proporcionan todo tipo de alertas, incluidas
                              FX Power MT4 NG
                              Daniel Stein
                              5 (8)
                              Obtenga su actualización diaria del mercado con detalles y capturas de pantalla a través de nuestro Morning Briefing aquí en mql5 y en Telegram ! FX Power MT4 NG es la nueva generación de nuestro popular medidor de fuerza de divisas, FX Power. ¿Y qué ofrece este medidor de fuerza de nueva generación? Todo lo que le encantaba del FX Power original PLUS Análisis de fuerza de ORO/XAU Resultados de cálculo aún más precisos Períodos de análisis configurables individualmente Límite de cálculo persona
                              Presentamos ON Trade Waves Patterns Harmonic Elliot Wolfe, un indicador avanzado diseñado para detectar diversas formas de patrones en el mercado mediante métodos tanto manuales como automáticos. A continuación, te explicamos cómo funciona: Patrones Armónicos: Este indicador puede identificar patrones armónicos que aparecen en tu gráfico. Estos patrones son esenciales para los traders que practican la teoría del trading armónico, tal como se popularizó en el libro de Scott Carney "Harmonic Tradi
                              El sistema PRO Renko es un sistema de trading de alta precisión especialmente diseñado para operar gráficos RENKO. Se trata de un sistema universal que se puede aplicar a diversos instrumentos de negociación. El sistema neutraliza eficazmente el llamado ruido de mercado, lo que le brinda acceso a señales de reversión precisas. El indicador es muy fácil de usar y solo tiene un parámetro responsable de la generación de señales. Puede adaptar fácilmente la herramienta a cualquier instrumento com
                              Entry Points Pro
                              Yury Orlov
                              4.7 (224)
                              Este es un genial indicador para MT4 que ofrece señales precisas para entrar en una transacción sin redibujar. Se puede aplicar a cualquier activo financiero: fórex, criptomonedas, metales, acciones, índices. Nos dará valoraciones bastante precisas y nos dirá cuándo es mejor abrir y cerra una transacción. Eche un vistazo  al vídeo  (6:22), ¡contiene un ejemplo de procesamiento de una sola señal que ha amortizado el indicador! La mayoría de los tráders mejoran sus resultados comerciales durante l
                              ACTUALMENTE 31% DE DESCUENTO Este indicador es una herramienta de transacción única, de alta calidad y asequible porque hemos incorporado una serie de características propias y una fórmula secreta. Con solo un gráfico, da Alertas para los 28 pares de divisas. ¡Imagina cómo mejorarás porque puedes identificar el punto de activación exacto de una nueva tendencia u oportunidad de crecimiento! Basado en nuevos algoritmos subyacentes , hace que sea aún más fácil identificar y confirmar operaciones po
                              Antes que nada, vale la pena enfatizar que este Sistema de Trading es un Indicador No Repintado, No Redibujado y sin Retardos, lo que lo hace ideal para el trading profesional. El "Sistema de Trading de Soporte y Resistencia Inteligente" es un indicador avanzado diseñado para traders nuevos y experimentados. Empodera a los traders con precisión y confianza en el mercado de divisas. Este sistema integral combina más de 7 estrategias, 10 indicadores y varios enfoques de trading, incluyendo estr
                              TrendDecoder Premium
                              Christophe, Pa Trouillas
                              5 (2)
                              Identifique los rangos y los próximos movimientos probables   |  Obtenga las señales más tempranas y la fuerza de las Tendencias   |  Obtener salidas claras antes de reversión   |  Detecte los niveles de Fibo que el precio pondrá a prueba Indicador no repintado y no retardado - ideal para la trading manual y automatizada - adecuado para todos los activos y todas las unidades temporales Oferta por tiempo limitado >>   50% OFF Después de la compra, póngase en contacto con mi canal  para conocer lo
                              TakePropips Donchian Trend Pro
                              Eric John Pajarillaga Aldana
                              4.82 (17)
                              ¡TakePropips Donchian Trend Pro   (MT4) es una herramienta poderosa y efectiva que detecta automáticamente la dirección de la tendencia utilizando el Canal Donchian y le proporciona señales comerciales de entrada y salida! Este indicador multifunción incluye un escáner de tendencias, señales comerciales, panel estadístico, filtro, sesiones comerciales y panel de historial de alertas. ¡Está diseñado para proporcionarle señales comerciales y ahorrarle horas analizando los gráficos! Puede descargar
                              Presentación del Indicador Zeus: Tu Última Herramienta para Romper con las Ganancias en el Trading. Este indicador simplifica el trading, eliminando la necesidad de un análisis profundo con estrategias de ruptura. Dibuja automáticamente zonas basadas en tus marcos de tiempo preestablecidos, sugiere niveles de Stop Loss (SL), Take Profit (TP) y Trailing Stop. El Indicador Zeus te notificará de inmediato y mostrará flechas de señal cuando el precio se acerque a los puntos de entrada de compra o ve
                              FX Volume
                              Daniel Stein
                              4.6 (35)
                              Obtenga su actualización diaria del mercado con detalles y capturas de pantalla a través de nuestro Morning Briefing aquí en mql5 y en Telegram ! FX Volume es el PRIMER y ÚNICO indicador de volumen que proporciona una visión REAL del sentimiento del mercado desde el punto de vista de un bróker. Proporciona una visión impresionante de cómo los participantes institucionales del mercado, como los brokers, están posicionados en el mercado Forex, mucho más rápido que los informes COT. Ver esta info
                              Quantum Heiken Ashi PRO MT4
                              Bogdan Ion Puscasu
                              4.43 (7)
                              Introduciendo el       Gráficos   Quantum Heiken Ashi PRO Diseñadas para brindar información clara sobre las tendencias del mercado, las velas Heiken Ashi son reconocidas por su capacidad para filtrar el ruido y eliminar las señales falsas. Diga adiós a las confusas fluctuaciones de precios y dé la bienvenida a una representación gráfica más fluida y confiable. Lo que hace que Quantum Heiken Ashi PRO sea realmente único es su fórmula innovadora, que transforma los datos de velas tradicionales en
                              Cycle Sniper
                              Elmira Memish
                              4.41 (34)
                              NEW YEAR SALE PRICE FOR LIMITED TIME!!! Please contact us after your purchase and we will send you the complimentary indicators to complete the system Cycle Sniper is not a holy grail but when you use it in a system which is explained in the videos, you will feel the difference. If you are not willing to focus on the charts designed with Cycle Sniper and other free tools we provide, we recommend not buying this indicator. We recommend watching the videos about the indiactor and system before pu
                              Otros productos de este autor
                              True Direction Oscillator
                              Muhammad Elbermawi
                              4.89 (493)
                              O (TDO), que es un índice que mide la tasa de cambio de precios utilizando el principio de " Pure Momentum ". Cuando el precio de un valor aumenta de 10 a 15, la tasa de cambio del precio es del 150%, pero cuando baja de 15 a 10, la tasa de cambio del precio es solo del 33,3%. Es por eso que los indicadores de análisis técnico como "Tasa de cambio de precio" (ROC) o "Momentum" dan lecturas más altas para los movimientos de precios ascendentes que las dadas para los descendentes. TDO soluciona e
                              Moving Average Cloud
                              Muhammad Elbermawi
                              4.93 (14)
                              O "MAC". Este es un indicador diseñado para ayudarlo a capturar e intercambiar la tendencia. La idea detrás de este indicador se puede explicar en los siguientes pasos: Dibuja una envolvente promedio de rápido movimiento. Dibuja una Envolvente promedio de movimiento lento. La banda superior de MAC es el valor más alto entre el máximo de ambas envolventes. La banda inferior de MAC es el valor más bajo entre el mínimo de ambas envolventes. La nube de histograma MAC llena la distancia entre dos
                              Bermaui Bands
                              Muhammad Elbermawi
                              4.94 (89)
                              Bermaui Bands (BB) es una herramienta de análisis técnico que ayuda a filtrar entre los movimientos de precios de rango y tendencia. La idea detrás de este indicador se puede explicar en los siguientes pasos: Calcule la desviación estándar como un oscilador que se mueve entre 0 y 100. Lo llamaré porcentaje de desviación de Bermaui (BD%). Si "BD%" está cerca de cero, la volatilidad está en su punto máximo. Además, si "BD%" está cerca de 100, la volatilidad es muy baja. Una alta volatilidad signif
                              Bermaui Manual EA
                              Muhammad Elbermawi
                              5 (10)
                              Este es un asesor experto semiautomático que comercia con el sistema de red. La idea es tomar gradualmente diferentes posiciones en el mercado y luego calcular el nivel de equilibrio para ellas. Cuando los precios superan este punto de equilibrio por una distancia predeterminada, todas las órdenes abiertas se cierran. Información importante Aquí está la guía del usuario:   https://www.mql5.com/en/blogs/post/730567 Puede probar este EA con cualquiera de mis otros productos, aquí: https://www.
                              Bermaui Deviation Percent
                              Muhammad Elbermawi
                              4.94 (129)
                              O (BD%), que es un índice de volatilidad que mide la volatilidad en porcentaje en lugar de puntos. La idea de BD% es hacer un índice en función de la Desviación Estándar Clásica (CSD) que se mueva entre 0 y 100 por ciento. Puede utilizar BD% para comparar la volatilidad de la misma seguridad en diferentes períodos de tiempo o diferentes marcos de tiempo. Además, puede usar BD% para comparar la volatilidad entre diferentes valores en diferentes mercados en términos de porcentaje en lugar de pu
                              MASR Bands
                              Muhammad Elbermawi
                              5 (10)
                              O bandas M Oving Un verage S poyo R esistencia. El indicador MASR Bands es un promedio móvil rodeado por dos bandas que funcionan juntas como niveles de soporte y resistencia. Estadísticamente, las bandas MASR contienen velas de precios el 93% del tiempo. Así es como se calcula en pasos: 1. El primer paso es calcular el máximo más alto (HHV) y el mínimo más bajo (LLV) durante un período de tiempo X. 2. El segundo paso es dividir HHV por LLV para obtener el ancho de la distancia entre ello
                              Classic Keltner Channel
                              Muhammad Elbermawi
                              4.9 (40)
                              O CKC. Este indicador funciona según la regla clásica de la media móvil de diez días descrita por Chester W. Keltner (1909-1998). Todos los parámetros están configurados en la versión clásica del sistema Keltner por defecto, mientras que el usuario puede cambiarlos si lo desea. Información importante Lea el manual de CKC: https://www.mql5.com/en/blogs/post/736577 Ejemplo de asesor experto de CKC: https://www.mql5.com/en/blogs/post/734150 Acerca de la fórmula del canal Keltner 1. Calcule la
                              Bermaui Pin Bars
                              Muhammad Elbermawi
                              5 (22)
                              Barras de pasador Bermaui O (BPB) es un indicador que encuentra el patrón de acción del precio de Pin Bars en el gráfico. Pin Bars es un atajo para "Pinocchio Bars", que es un patrón de barra clásico alternativo a los candelabros japoneses con sombras altas o inferiores y cuerpos muy pequeños como Hammer, Inverted-Hammer, Hanging Man, Shooting Star, Dragon Fly Doji o Grave Stone Doji . El indicador Bermaui Pin Bars encuentra este patrón en función de una fórmula que se puede explicar en los
                              BACD Cloud
                              Muhammad Elbermawi
                              4.57 (7)
                              O B ermaui Un verage C onvergence D ivergence la nube, que es un oscilador que muestra la dirección de tendencia y las medidas de su fuerza en porcentaje. El cálculo de BACD Cloud es el siguiente: 1- Calcula dos medias móviles exponenciales. Uno de ellos es más rápido que el otro. Llamaré al primero (Rápido) y al segundo (Lento) 2- Encuentra el centro entre ellos, donde: Centro MA = (Rápido + Lento) / 2 3- Calcule la línea BACD de la siguiente manera: BACD = 100 * (Fast / Center MA) 4-
                              Bermaui Channel
                              Muhammad Elbermawi
                              5 (27)
                              This is a price channel that shows five important price levels on the chart. Those levels are: 1. The Highest High (HH) of the previous x bars. 2. The Highest Low (HL) of the previous x bars. 3. The Center Line. 4. The Lowest High (LH) of the previous x bars. 5. The Lowest Low (LL) of the previous x bars. How does Bermaui Channels Captures Overbought  area Think of the distance between HH and HL levels as an overbought area. When the price candles or bars crosses the HL to the upside this
                              Bermaui RSI Candles
                              Muhammad Elbermawi
                              5 (7)
                              La idea de este indicador es dibujar RSI en forma de velas que se pueden comparar con gráficos de precios para generar señales de compra y venta. El indicador no es invención mía. Lo fundé en Internet hace varios años. Actualicé el código, agregué funciones de alerta, agregué el grupo de herramientas Bermaui Utilities. El indicador calcula el RSI de todos los precios que se utilizan para dibujar velas (RSI de apertura, máximo, mínimo y cierre). Utiliza el más alto de ellos para dibujar la mecha
                              Horus EA
                              Muhammad Elbermawi
                              3.67 (3)
                              Horus EA para MT4 Hace miles de años, los antiguos egipcios inventaron un sistema de conteo que usaban para medir sus tierras y pesar sus mercancías. Este sistema fue conocido como el " Ojo de Horus ". El Ojo de Horus se asoció con el mito del dios Osiris y se convirtió en uno de los símbolos sagrados de los faraones. Usé las ecuaciones matemáticas en el Ojo de Horus con la secuencia de Fibonacci para construir un sistema de administración de dinero de progresión negativa que es un 89% más se
                              Filtro:
                              Hisham Ghoneim
                              301
                              Hisham Ghoneim 2021.09.22 09:39 
                               

                              I already purchase the full set EA + BD% +DBD% as i' satisfied with Elbermawi trading tool and this is not my first time dealing with his great trading tools, it is really helpful for good trading results.

                              Muhammad Elbermawi
                              52239
                              Respuesta del desarrollador Muhammad Elbermawi 2021.09.22 10:32
                              Thanks a lot for the review and stars. I appreciate it . 🙏💚
                              Paulina Andrea Madariaga Figueroa
                              4107
                               

                              Very good indicator, I have spent money in another indicators and with Bermaui tools I have everything.

                              digger55
                              237
                              digger55 2020.01.15 18:08 
                               

                              Good and professional tool.

                              Eng Yoon Lee
                              1294
                              Eng Yoon Lee 2019.12.19 12:23 
                               

                              this is the best indicator. very robust and safe. i LOVE IT

                              aw1977
                              279
                              aw1977 2019.12.11 01:50 
                               

                              Another high quality product from Muhammad....I think there is none similar to this outside. If you never use Muhammad's product before, try this one. There is full function demo which limited to EU/H1.

                              neongreen
                              466
                              neongreen 2019.10.21 14:47 
                               

                              This is my third indicator that I have bought from Muhammad and like his other indicators they are very useful. His support has been fantastic and fast. Two thumbs up!!

                              muna111
                              544
                              muna111 2019.09.17 04:32 
                               

                              Very help ful indicator and a must tool for trading. Thanks a lot Mohammad for such a great indicator .

                              Roberto Cesar Ruarte Pedraza
                              702
                              Roberto Cesar Ruarte Pedraza 2019.08.20 04:45 
                               

                              really good for scalping

                              Evgeniy Vizhevitov
                              219
                              Evgeniy Vizhevitov 2019.08.10 14:44 
                               

                              As an additional filter to Your strategy it is very good!!!

                              Christof Schoneweg
                              124
                              Christof Schoneweg 2019.05.15 19:57 
                               

                              Sehr gute Idee, starker Indikator!

                              Frank Paetsch
                              6872
                              Frank Paetsch 2019.05.14 18:51 
                               

                              Sehr starker Indikator, vielen Dank!

                              keltonactis
                              1052
                              keltonactis 2019.05.13 01:55 
                               

                              Promissing. Good work!

                              IK°L
                              765
                              IK°L 2019.05.04 22:21 
                               

                              This indicator is a very useful tool, the signals are very precise although in periods of low volatility it is necessary to interpret them if you intend to operate exclusively with it. You will also find a lot of value when it is used to confirm a signal to support any operative or system of your own. The author always listens his clients and you can always count with his support.

                              Adil
                              456
                              Adil 2019.04.10 15:48 
                               

                              El usuario no ha dejado ningún comentario para su valoración

                              Respuesta al comentario
                              Versión 4.0 2019.12.08
                              1. Added a Background to the panel at the right corner of the indicator.
                              2. Added a unique prefix/suffix for all objects drawn by the indicator.
                              3. Made a revision for the code to make sure that there is no logical errors.

                              Note:
                              1. I didn't change DBD% calculations. It is the same.
                              2. Parameters are the same.
                              Versión 3.0 2019.10.15
                              1- The indicator main tapes shape are now as histogram rather than the old version that was in dots. This makes it look better.
                              2- The high is restricted, to make it look like a tape.
                              3- I added "Bermaui Utilities Lite", which is four tools that you will help the user to analyze his chart much better, determine his take profits and stop losses.
                              4- Now you can switch easily between pairs or time-frames.
                              5- You can draw standard deviation channels that show overbought and oversold levels clearly.
                              6- You can draw rounded numbers grid to analyze support and resistance psychological levels.
                              7- You can draw supply and demand levels.
                              8- You can show or hide Bermaui Utilities Buttons by clicking on Shift + A / D.
                              9- You can switch between four beautiful and well-designed Color Lists. Or you can use your own color list by choosing the (Do Nothing) choice.
                              10- You can send Mobile Notification or emails and if anything gets wrong you will receive a note in the terminal's journal.
                              11- Indicator objects now change their size depending on screen resolution.
                              Versión 2.1 2019.07.20
                              1. Added and Icon to the interface.
                              2. Added a description for the important buffers to the interface.
                              Versión 2.0 2019.07.18
                              Welcome to Dual Bermaui Deviation Percent version 2.0 (DBD% v2.0)

                              In this version I worked to enhance the built-in function of the indicator by using a moving average as a filter.

                              1// Buy signals will be triggered if Fast BD% is greater than slow BD% and also fast SMA is greater that slow SMA.
                              2// Sell signals will be triggered if Fast BD% is smaller than slow BD% and also fast SMA is smaller that slow SMA.

                              This will reduce the number of false signals to increase the quality.