• Información general
  • Comentarios (3)
  • Discusión (14)
  • Novedades

Sensitive Signal

5

              El indicador, que utiliza los métodos de filtrado desarrollados por el autor, permite, con un alto grado de probabilidad, establecer el comienzo del movimiento de tendencia verdadero. La filtración desarrollada por el autor se realiza en varias iteraciones y revela la verdadera trayectoria del movimiento de precios regular  y lo dibuja. Al mismo tiempo se filtran caminatas al azar del precio. Dicho filtrado es muy efectivo para el comercio en el cambio de moneda, donde la señal es muy ruidosa.

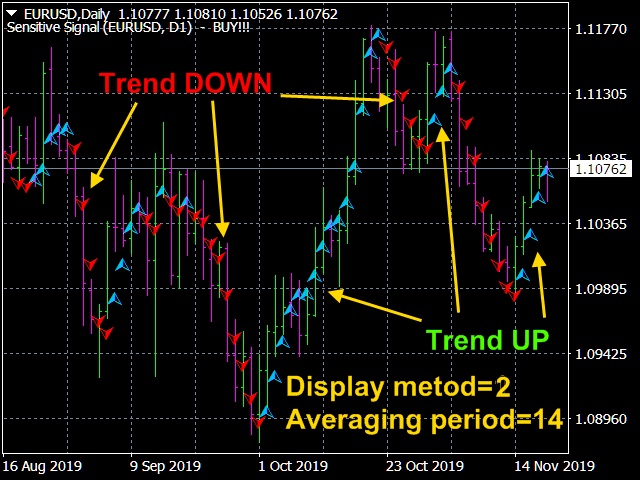
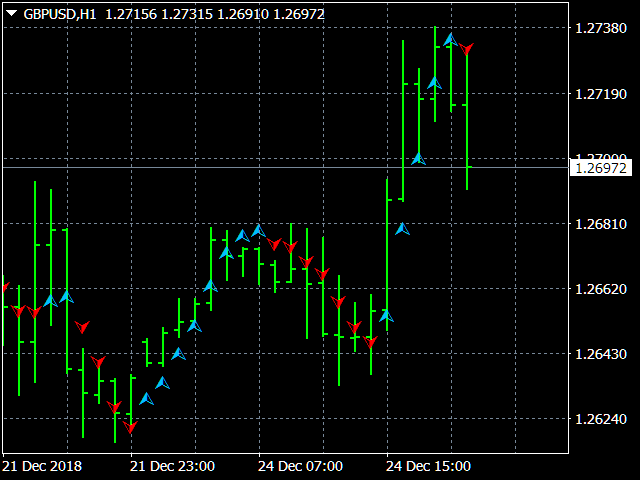
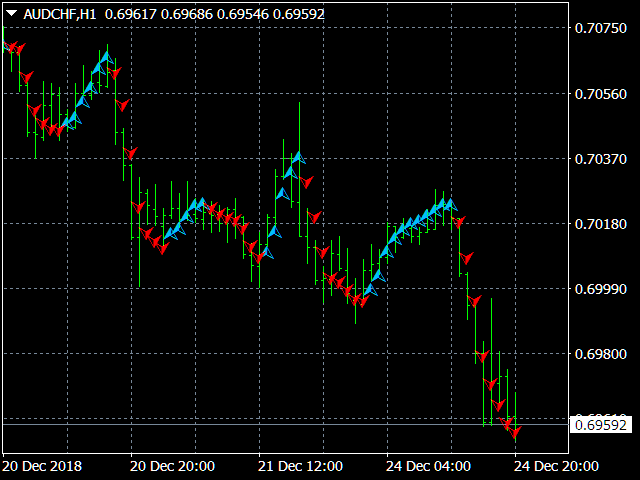
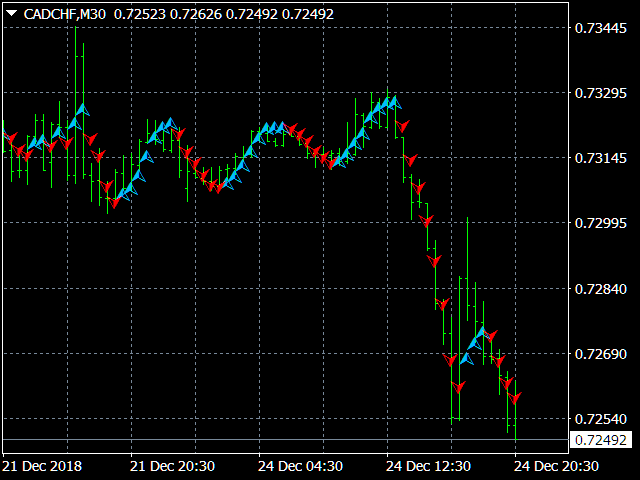
              Las lecturas de los indicadores son visuales, extremadamente simples y no requieren comentarios. Los triángulos azules están ubicados en la tendencia alcista del componente regular del movimiento del precio, los triángulos rojos - en la tendencia descendente. En consecuencia, los puntos de entrada para Comprar en los momentos en que aparecen triángulos azules detrás de los triángulos rojos, y viceversa para Vender. El nivel de sensibilidad del indicador se ajusta ajustando   «Select sensitivity level». Al mismo tiempo, debe comprender que aumentar el nivel de sensibilidad no solo reduce el retraso de la señal, sino que también aumenta la probabilidad de emitir una señal falsa.  

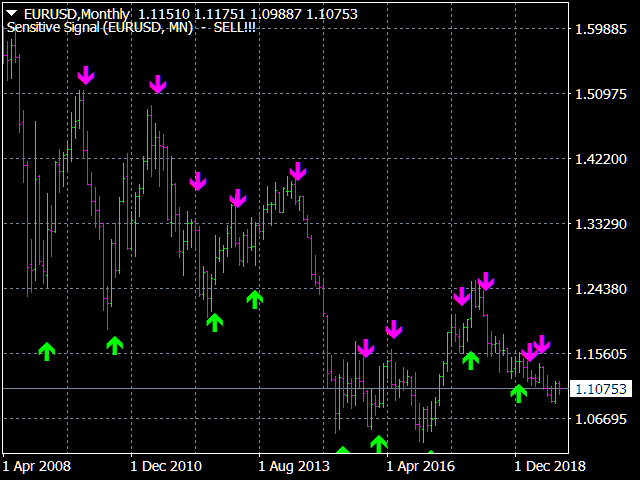
            Los posibles momentos de un cambio en la dirección del movimiento del precio también se indican mediante flechas.          

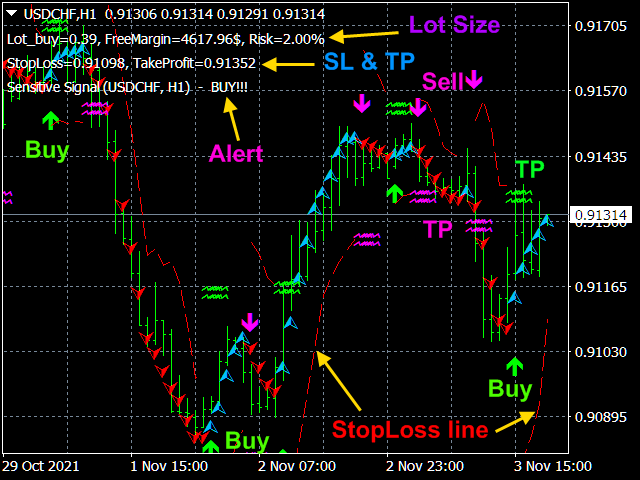
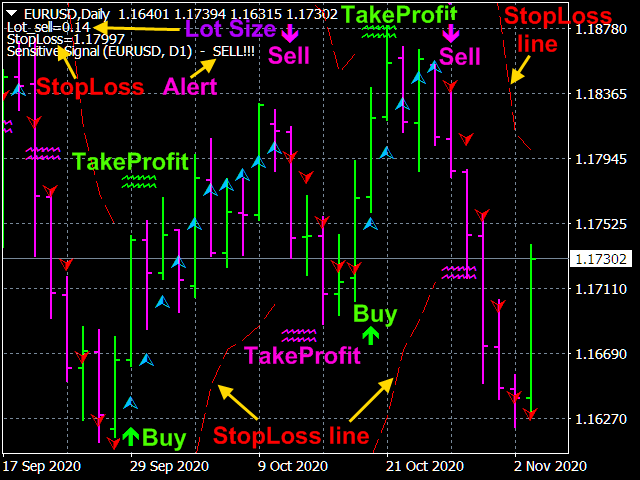
           El indicador calcula y muestra las líneas de posición StopLoss, calculadas en base a las distribuciones actuales de la probabilidad del precio y el nivel seleccionado de probabilidad de cerrar una orden por StopLoss antes de la reversión de la tendencia.

              El indicador también tiene una función de administración de dinero incorporada, en la que puede calcular el tamaño del lote en función del nivel de riesgo aceptado, el tamaño del depósito y la posición StopLoss.

            El indicador tiene todo tipo de alertas. Se han desarrollado tres algoritmos para habilitar alertas. La alerta puede estar incluida: 1) cuando las lecturas del indicador coinciden (con respecto a la dirección de la tendencia) en las últimas dos barras;  2) en una vela cerrada;  3) en la vela cerrada y la barra que la precede.


Ajustes.

  • Price type  - Tipo de precio. Significados: Close price, Open price, High price, Low price, Median price  (por defecto), Typical price ,    Weighted  price. 
  • The averaging method - Método de promediación. Significados : Simple, Exponential (por defecto), Smoothed, Linear weighted.
  • The averaging period    -  Período de promediación. Significados: Cualquier entero (20 por defecto).
  • Select sensitivity level   -  Nivel de sensibilidad del indicador. Significados: Low, Middle (por defecto),   High.
  • Dimensions of markers – Tamaños de marcadores. Significados: Cualquier entero (2 por defecto).
  • The display method -  Método de visualización de información.    Show trend arrows and show change trend arrows  (por defecto), Show only trend arrows, Show only change trend arrows.
  • Show StopLoss lines ?  Mostrar líneas StopLoss true   ( por defecto ), false .
  • Trend UP arrow color= DeepSkyBlue   -  El color de la flecha de tendencia bajista.
  • Trend DOWN arrow color=Red  -  El color de la flecha de tendencia alcista.
  • Down arrow color=Magenta  -  La flecha es el comienzo de una tendencia bajista.
  • Up arrow color =Lime   -   La flecha es el comienzo de una tendencia alcista. 
  • Signal Identification Method  - Métodos de identificación de señal. Significados: By the last two bars Por los dos últimos compases.» – por defecto),  By closed candlePor vela cerrada »),  By closed candle and by the previous for it barSobre la vela cerrada y el bar anterior»).
  • The Signal method -  Tipo de alerta de señal comercial. Significados:  No, Send alert, Print (in expert), Comment (in chart), Sound + Print, Sound + Comment, Sound, Push + Comment, Push,  Mail + Comment, Mail.
  • The probability of triggering StopLoss P_sl – La probabilidad de cerrar una orden por StopLoss antes de la inversión de tendencia. Cualquier número real entre 0 y 1 (0.05 por defecto).
  • Calculate the lot size from the risk, deposit and P_sl? Calcular el tamaño del lote en función del riesgo, el depósito y la probabilidad de cerrar una orden mediante StopLoss? Significados: true, false (por defecto).  
  • Allowable losses in % from Free Margin -Pérdidas admisibles en% del margen libre. (2% por defecto).


Comentarios 3
Alec Markarian
329
Alec Markarian 2019.03.04 22:37 
 

Great indicator to use for confirmation of bias and/or exits, under correct settings and time frame, can be adjusted very well to precisely fit your strategy, in what ever market it is that you trade.

Uladzimir Izerski
14278
Uladzimir Izerski 2019.01.11 17:45 
 

Вижу профессионализм над созданием. Очень хорошо.

Productos recomendados
The Transition Trend indicator shows the points of potential market reversal. The indicator's smart algorithm detects the trend, filters out market noise and generates entry signals and exit levels. Simple, visual and efficient trend detection. Uses just one parameter for settings. The indicator does not redraw and does not lag. You can set up message alerts as sound or email. Works on all currency pairs and all timeframes. Ready-made trading system.
ForexGumpUltra
Andrey Kozak
3.25 (4)
ForexGumpUltra is a new and more advanced indicator of the ForexGump series. This indicator easily determines the price direction on any currency pair and any timeframe. The indicator draws its signals on the zero bar and does not redraw them (see the video). In the 34th second of the video it can be seen that this indicator uses new filters to determine the changes in price movement direction without delay, despite the market noise present at the moment (see the video on the 34th second). Once
Pivot levels Auto V1
Hafis Mohamed Yacine
What Is a Pivot Point? A pivot point is a technical analysis indicator, or calculations, used to determine the overall trend of the market over different time frames. The pivot point itself is simply the average of the intraday high and low, and the closing price from the previous trading day. On the subsequent day, trading above the pivot point is thought to indicate ongoing bullish sentiment, while trading below the pivot point indicates bearish sentimen How to Use Pivot Points The very e
Este indicador de panel de divergencia de múltiples marcos de tiempo y múltiples símbolos envía una alerta cuando se han identificado una o dos divergencias diferentes en varios marcos de tiempo y no en divergencias individuales. Se puede utilizar con todos los marcos de tiempo desde M5 hasta MN. Es posible habilitar la media móvil o el filtro de tendencia RSI para filtrar solo las configuraciones más fuertes. Combinado con sus propias reglas y técnicas, este indicador le permitirá crear (o mejo
This indicator is designed to detect the best of all candlestick reversal patterns: Three Line Strike . According to the bestselling author and candlestick guru Thomas Bullkowski, this pattern has a winning percentage between 65% and 84% . This indicator scans for you up to 30 instruments (forex, indices or commodities) on up to 8 timeframes. You can get alerts via MetaTrader 4 and email if a Three Line Strike pattern occurs. Please note: Higher timeframes bring the most reliable signals. This i
Este indicador de marco de tiempo múltiple y símbolo múltiple identifica formaciones superiores / inferiores dobles o triples o una ruptura del escote siguiente (superior / inferior confirmada). Ofrece filtros RSI, pin bar, envolvente, pinzas, estrella matutina / vespertina, así como opciones de filtro de divergencia MACD, Awesome (AO) o RSI que permiten filtrar solo las configuraciones más fuertes.       El indicador también se puede utilizar en modo de gráfico único. Lea más sobre esta opción
A trading range takes place when a financial instrument (stocks, indices, bonds, commodities, Forex currencies or cryptocurrencies) oscillates between two upwards and downwards boundaries for a period of time. This Indicator tool help us to view range on the chart bar per bars, also set range in percent and get clean posicion.  Range trading works best in the absence of a trend. When the markets lack a clear direction, that’s when these consolidation periods settle in. Alternatively, more exper
Introduction In the fast-paced world of financial market trading, success often hinges on the ability to spot and leverage trends. Among the various strategies available, momentum trading stands out as a powerful tool for traders seeking to capitalize on market movements. In this article, we will delve into the concept of momentum, its significance in trading, and the numerous benefits it offers to traders. What is Momentum? Momentum in trading refers to the tendency of assets to continue movin
Este indicador de múltiples períodos de tiempo y múltiples símbolos busca barras de pines. Combinado con sus propias reglas y técnicas, este indicador le permitirá crear (o mejorar) su propio sistema poderoso. Características Puede monitorear todos los símbolos visibles en su ventana Market Watch al mismo tiempo. Aplique el indicador a un solo gráfico y monitoree instantáneamente todo el mercado. Puede monitorear cada marco de tiempo, desde M1 hasta MN, y le envía una alerta en tiempo real cuan
XFibo Auto Fibonacci
Welinton Dos Reis Goncalves
Use with disciplined risk management. Fibonacci entry system based on the golden zone 38.2 - 61.8 where the entry is confirmed at 23.6 with indications of Take Profit 3:1. Automatically plotted Fibonacci contains retracement and expansion Fibonacci in a single indicator. Up to 77% win rate with this system. FTMO challenge pass with 0.50% risk and 1.50% R:R.
My Point MT4
Claudia Ramona Angerer
4 (1)
Diagnosis of major and minor pivot Trend detection with many signals Can be used in all symbols Can be used in all time frames Settings: Back Show: The number of candles it displays If you need any adjustments, or have any questions or suggestions, message me How to trade: Blue: sell signal Red: buy signal Blue and red at the same time: no signal Exit signal: Opposite signal
ARAH TREND is an indicator to detect the current trend, and predict next trend.  Its very simple way to know trend because   the display so clear. Trend changes are indicated by indicator color change. That's great as an entry point.  The advantages of this indicator : - Beautiful Entry Points - No Need Setting - Suitable for all time frames - Geat for GBPUSD and Gold TF H1 - The display is simple and clear It can also be combined with your mainstay indicator so that the entry point is more acc
The Sentiment Ratio indicator gauges current Market Sentiment between -100% and 100%, where lower than -40% is considered Bearish and higher than 40% is Bullish. The channel between the two is considered Neutral. The indicator has been a very useful filter tool for signals within a trading system. Example call function:  int SentimentIndicator(double triggerLevel)//Return sentiment if trigger level is activated {   double sentimentRatio=iCustom(NULL,0,"Sentiment Ratio",0,0,0);   if(sentimentRa
FREE
After the purchase, the current year free indicator, please contact me for your version As a bonus to the purchase, 3 months access to https://www.mql5.com/en/market/product/78772?source=Unknown%3Ahttps%3A%2F%2Fwww.mql5.com%2Fen%2Fmarket%2Fmy Fibonacci retracement This indicator is based on use of Fibonacci retracement. I use Fibonacci levels for last year for important levels, where market stops and turns. These levels are important Price Action levels and market respect them. I do not us
Description Better version of RSI indicator which offer a complete visual trading strategy and realize an auto-optimization Support:   We create great tools for the entire trading community. Most of them are free. If you believe in what we do  Support Us Here.   KEY LINKS:   How to Install  –  Frequent Questions  -  All Products  How is this indicator useful? NEVER repaints. Detect best parameters of RSI indicator, based on profit factor during the specified period. This indicator can be used as
Contact me after payment to send you the user manual PDF file. Introduction The moving average indicator is the most well-known and one of the most popular indicators among traders. It is very simple to work with, but a basic question has always become a big challenge among traders: What is the most optimal setting of the moving average for each chart-time frame? The answer to this question is very difficult, you have to try different settings of the moving average indicator for different chart
Como comerciante de divisas, comprende el valor de la estrategia comercial   de Fibonacci   en el análisis técnico. Sin embargo, dibujar y ajustar manualmente los niveles de Fibonacci puede llevar mucho tiempo. Ahí es donde entra en juego el indicador   Fibonacci Of Yesterday Ultimate   . Está diseñado específicamente para operadores que utilizan la estrategia Fibonacci basada en la acción del precio del día anterior, ahorrándole tiempo y esfuerzo. Este innovador indicador identifica automáticam
Holy Trend PRO
Bianca Seara
5 (1)
About Holy Trend was developed to identify trend and strength. VIDEO (information and tips) [HERE] Features Identifies trend Identifies strength of trend Identifies lines of support and resistance Easy to analyze Fast signals All timeframes Not repaint (when candle close) No settings required Can be used in Renko charts Can be used with indicator Holy Renko PRO Alerts, email and push notifications Advantages Sensitive identifier of trend able to identify the long, short movements and
The correlation coefficient reflects the relationship between two values. It shows the dependence of changes in one value on changes in another. For example, from changes in the price of EURUSD and EURNZD. The correlation coefficient in trade, currency relations is constantly changing. Special indicators of correlation help to define it, trace changes, draw correct conclusions. One of them is the Hubbles Correlator indicator. The indicator allows you to simultaneously display several other char
The indicator is designed for determining Fibonacci levels. Does not repaint/redraw The blue level shows the zero Fibonacci value (it is also the Pivot level) Red levels show calculated Fibonacci levels (used as a rollback or reversal point) Automatic period detection (periods can be entered manually) Adjustable display calculation method. Settings BarsHistory - the number of bars to be used to display the indicator. Method - method of calculation. AutoPeriod - automated period calculation (true
Este indicador de marco de tiempo múltiple y de símbolo múltiple escanea en busca de formaciones envolventes y de pinzas. Características Puede monitorear todos los símbolos visibles en su ventana Market Watch al mismo tiempo. Aplique el indicador a un solo gráfico y monitoree instantáneamente todo el mercado. Monitorea cada período de tiempo, desde M1 hasta MN, y le envía una alerta en tiempo real cuando se identifica una formación de Pinzas o Engulling. Se admiten todos los tipos de alertas na
PowerXXX
Marco Fornero Monia
PowerXXX measures the power of the current candlestick and displays it in numerical format and colors. The indicator can cover multiple timeframes and can be placed on the main chart or on the charts of the underlying indicators. The number of timeframes is selectable, as well as the color levels according to the power expressed. In the latest version, the power can be expressed as a function of the opening of the candle itself or as a function of the opening of the total candles before. There
Effect
Maryna Shulzhenko
The Effect indicator shows the points of potential market reversal. Simple, visual and efficient trend detection. Ready-made trading system. The intelligent algorithm of the indicator determines the trend with good probability. Uses just one parameter for settings. The indicator does not redraw and does not lag. Works on all currency pairs and all timeframes. You should remember that using a combination of forecasting tools, it is advisable to choose 2-3 indicators for trading. Otherwise, the
TrendSurfer OsMa
Augustine Kamatu
2 (1)
Introducing TrendSurfer OsMa: Elevating Your Forex Trading Experience. TrendSurfer OsMa is a cutting-edge automated trading system meticulously crafted to harness the power of the MetaTrader 4 indicator, Moving Average of Oscillator (OsMa), revolutionizing your approach to forex trading. The Moving Average of Oscillator (OsMa) is a derivative of the MACD (Moving Average Convergence Divergence) indicator. It represents the difference between the MACD line and its signal line. The OsMa provid
American Hunters
Mehmet Ozhan Hastaoglu
This indicator guides you like a hunter. Tacheprofit and StopLoss levels. See the difference in the experiment. Works in all periods. Works at all rates. You can win with this system. The crossing of the mean and the re-test were done according to the rule. You can see the transactions by moving backwards on the strategy test screen. The whole system is automatically calculated.
Fibonacci automatically draws Fibonacci retracement, Because Fibonacci automatically draws Fibonacci retracement, you can know at a glance the price to buy at a push or sell back. Therefore, you can trade in favorable conditions in a trending market. We are live-streaming the actual operation of the system. Please check for yourself if it is usable. Please check it out for yourself. https://www.youtube.com/@ganesha_forex We do not guarantee your investment results. Investments should be mad
Multi-timeframe Parabolic SAR dashboard allows you to add and monitor PSAR trends. The multi-timeframe Parabolic SAR dashboard will save you a lot of time and gives you a single view of the markets using PSAR. In short, you can just view one window and get a snapshot of up to 21 instruments on your MT4 platform. The indicator opens in a sub-window. Below are the features of the PSAR Dashboard Indicator Modify PSAR Settings: The PSAR Dashboard comes with default PSAR settings of 0.02 (Step) and 0
Kill Zones MT4
Diego Arribas Lopez
MT5 Version Kill Zones Kill Zones allows you to insert up to 3 time zones in the chart. The visual representation of the Kill Zones in the chart together with an alert and notification system helps you to ignore fake trading setups occurring outside the Kill Zones or specific trading sessions. Using Kill Zones in your trading will help you filter higher probability trading setups. You should select time ranges where the market usually reacts with high volatility. Based on EST time zone, followi
It could help to calculate Risk-Reward easily before placing a BUY-SELL position. TradeSizeCalculator is a Multi-Tasking Calculator. It will calculate the others when we define the value in one of the columns. Stoploss, risk percentage, risk-money, lot size, take-profit , reward-money, and reward-ratio. Depending on which value is changed. All values in the columns are editable. Also, we can get those calculation results by drag-drop the stop-loss/take-profit line. Parameter: The inputs below ar
Este indicador de marco de tiempo múltiple y símbolo múltiple identifica doble arriba / abajo, cabeza       Y       hombros, banderines / triángulos y patrones de bandera. También es posible configurar alertas solo cuando se ha producido una ruptura del escote / triángulo / asta de bandera (ruptura del escote = señal confirmada para arriba / abajo y cabeza y hombros).   El indicador también se puede utilizar en modo de gráfico único. Lea más sobre esta opción en el producto   blog .       Combin
Los compradores de este producto también adquieren
Gann Made Easy
Oleg Rodin
4.95 (43)
Gann Made Easy es un sistema de comercio de Forex profesional y fácil de usar que se basa en los mejores principios de comercio utilizando la teoría del Sr. W. D. Gann. El indicador proporciona señales precisas de COMPRA y VENTA, incluidos los niveles de Stop Loss y Take Profit. Puede comerciar incluso sobre la marcha utilizando notificaciones PUSH. ¡Por favor, póngase en contacto conmigo después de la compra! ¡Compartiré mis consejos comerciales con usted y excelentes indicadores de bonificació
Presentamos el Indicador Milagroso de Forex: Desata el Poder del Trading Preciso ¿Estás cansado de buscar el mejor indicador de Forex que realmente ofrezca resultados excepcionales en todos los marcos temporales? ¡No busques más! Ha llegado el Indicador Milagroso de Forex para revolucionar tu experiencia de trading y llevar tus ganancias a nuevas alturas. Construido sobre una base de tecnología de vanguardia y años de desarrollo meticuloso, el Indicador Milagroso de Forex se erige como el pinácu
¡Actualmente 20% OFF ! ¡La mejor solución para cualquier novato o trader experto! Este software funciona con 28 pares de divisas. Se basa en 2 de nuestros principales indicadores (Advanced Currency Strength 28 y Advanced Currency Impulse). Proporciona una gran visión general de todo el mercado de divisas. Muestra los valores de Advanced Currency Strength, la velocidad de movimiento de las divisas y las señales para 28 pares de divisas en todos los (9) marcos temporales. Imagine cómo mejorar
Atomic Analyst
Issam Kassas
5 (1)
En primer lugar, vale la pena enfatizar que este Indicador de Trading no repinta, no redibuja y no se retrasa, lo que lo hace ideal tanto para el trading manual como para el automatizado. El Analista Atómico es un Indicador de Acción del Precio PA que utiliza la fuerza y el impulso del precio para encontrar una mejor ventaja en el mercado. Equipado con filtros avanzados que ayudan a eliminar ruidos y señales falsas, y aumentan el potencial de trading. Utilizando múltiples capas de indicadores
ACTUALMENTE 26% DE DESCUENTO ¡La mejor solución para cualquier operador novato o experto! Este indicador es una herramienta única, de alta calidad y asequible porque hemos incorporado una serie de características propias y una nueva fórmula. ¡Con sólo UN gráfico puede leer la Fuerza de la Divisa para 28 pares de Divisas! Imagínese cómo mejorará su operativa porque podrá señalar el punto exacto de activación de una nueva tendencia o de una oportunidad de scalping. Manual del usuario: haga
TPSproTREND PrO
Roman Podpora
5 (15)
TPSpro TRENDPRO  - is a trend indicator that automatically analyzes the market and provides information about the trend and each of its changes, as well as giving signals for entering trades without redrawing! The indicator uses each candle, analyzing them separately. referring to different impulses - up or down impulse. Exact entry points into transactions for currencies, crypto, metals, stocks, indices!  -  Version MT5               DETAILED DESCRIPTION        /       TRADING SETUPS           
TPSpro RFI Levels
Roman Podpora
5 (13)
A key element in trading is zones or levels from which decisions to buy or sell a trading instrument are made. Despite attempts by major players to conceal their presence in the market, they inevitably leave traces. Our task was to learn how to identify these traces and interpret them correctly. Reversal First Impulse levels (RFI)   -  Version MT5                INSTRUCTIONS                 RUS                 ENG                                       R ecommended to use with an indicator   -  
Introduciendo       Indicador Quantum Trend Sniper   , el innovador indicador MQL5 que está transformando la forma en que identificas y negocias los cambios de tendencia. Desarrollado por un equipo de comerciantes experimentados con experiencia comercial de más de 13 años,       Indicador de francotirador de tendencia cuántica       está diseñado para impulsar su viaje comercial a nuevas alturas con su forma innovadora de identificar cambios de tendencia con una precisión extremadamente alta.
Scalper Inside PRO
Alexey Minkov
4.75 (55)
An exclusive indicator that utilizes an innovative algorithm to swiftly and accurately determine the market trend. The indicator automatically calculates opening, closing, and profit levels, providing detailed trading statistics. With these features, you can choose the most appropriate trading instrument for the current market conditions. Additionally, you can easily integrate your own arrow indicators into Scalper Inside Pro to quickly evaluate their statistics and profitability. Scalper Inside
TrendMaestro
Stefano Frisetti
5 (2)
note: this indicator is for METATRADER4, if you want the version for METATRADER5 this is the link: TRENDMAESTRO recognizes a new TREND in the bud, he never makes mistakes. The certainty of identifying a new TREND is priceless. DESCRIPTION TRENDMAESTRO identifies a new TREND in the bud, this indicator examines the volatility, volumes and momentum to identify the moment in which there is an explosion of one or more of these data and therefore the moment in which prices have strong probability of f
Quantum Breakout Indicator PRO
Bogdan Ion Puscasu
4.96 (26)
Introduciendo       Quantum Breakout PRO   , el innovador indicador MQL5 que está transformando la forma en que comercia con Breakout Zones. Desarrollado por un equipo de operadores experimentados con experiencia comercial de más de 13 años,   Quantum Breakout PRO   está diseñado para impulsar su viaje comercial a nuevas alturas con su innovadora y dinámica estrategia de zona de ruptura. El indicador de ruptura cuántica le dará flechas de señal en las zonas de ruptura con 5 zonas objetivo de
Ante todo, vale la pena enfatizar que esta Herramienta de Trading es un Indicador No Repintado, No Redibujado y No Retrasado, lo que la hace ideal para el trading profesional. El Indicador de Conceptos de Acción del Precio Inteligente es una herramienta muy potente tanto para traders nuevos como experimentados. Combina más de 20 indicadores útiles en uno solo, combinando ideas avanzadas de trading como el Análisis del Trader del Círculo Interior y Estrategias de Trading de Conceptos de Dinero
Advanced Supply Demand
Bernhard Schweigert
4.92 (310)
¡Actualmente con 33% de descuento! ¡La mejor solución para cualquier tráder principiante o experto! Este indicador es una herramienta comercial única, de alta calidad y asequible, porque incorpora una serie de características patentadas y una nueva fórmula. Con esta actualización, podrá mostrar zonas de doble marco temporal. No solo podrá mostrar un marco temporal más alto, sino también mostrar ambos, el marco temporal del gráfico MÁS el marco temporal más alto: MOSTRANDO ZONAS ANIDADAS. A todos
Trend Screener
STE S.S.COMPANY
4.83 (86)
Indicador de tendencia, solución única e innovadora para el comercio y filtrado de tendencias con todas las funciones de tendencias importantes integradas en una sola herramienta. Es un indicador 100% sin repintar de marcos temporales y monedas múltiples que se puede usar en todos los símbolos/instrumentos: divisas, materias primas, criptomonedas, índices y acciones. Trend Screener es un indicador de seguimiento de tendencia eficiente que proporciona señales de tendencia de flecha con puntos en
Currency Strength Wizard es un indicador muy poderoso que le proporciona una solución todo en uno para operar con éxito. El indicador calcula el poder de este o aquel par de divisas utilizando los datos de todas las monedas en múltiples marcos de tiempo. Estos datos se representan en forma de índice de moneda fácil de usar y líneas eléctricas de moneda que puede usar para ver el poder de esta o aquella moneda. Todo lo que necesita es adjuntar el indicador al gráfico que desea operar y el indicad
FX Power MT4 NG
Daniel Stein
5 (8)
Obtenga su actualización diaria del mercado con detalles y capturas de pantalla a través de nuestro Morning Briefing aquí en mql5 y en Telegram ! FX Power MT4 NG es la nueva generación de nuestro popular medidor de fuerza de divisas, FX Power. ¿Y qué ofrece este medidor de fuerza de nueva generación? Todo lo que le encantaba del FX Power original PLUS Análisis de fuerza de ORO/XAU Resultados de cálculo aún más precisos Períodos de análisis configurables individualmente Límite de cálculo persona
¡Descubra el secreto para el comercio de Forex exitoso con nuestro indicador MT4 personalizado! ¿Alguna vez se ha preguntado cómo lograr el éxito en el mercado de Forex, obteniendo ganancias constantemente al tiempo que minimiza el riesgo? ¡Aquí está la respuesta que ha estado buscando! Permítanos presentar nuestro indicador MT4 patentado que revolucionará su enfoque para el comercio. Versatilidad única Nuestro indicador está especialmente diseñado para usuarios que prefieren las formacio
ACTUALMENTE 31% DE DESCUENTO Este indicador es una herramienta de transacción única, de alta calidad y asequible porque hemos incorporado una serie de características propias y una fórmula secreta. Con solo un gráfico, da Alertas para los 28 pares de divisas. ¡Imagina cómo mejorarás porque puedes identificar el punto de activación exacto de una nueva tendencia u oportunidad de crecimiento! Basado en nuevos algoritmos subyacentes , hace que sea aún más fácil identificar y confirmar operaciones po
Quantum Heiken Ashi PRO MT4
Bogdan Ion Puscasu
4.43 (7)
Introduciendo el       Gráficos   Quantum Heiken Ashi PRO Diseñadas para brindar información clara sobre las tendencias del mercado, las velas Heiken Ashi son reconocidas por su capacidad para filtrar el ruido y eliminar las señales falsas. Diga adiós a las confusas fluctuaciones de precios y dé la bienvenida a una representación gráfica más fluida y confiable. Lo que hace que Quantum Heiken Ashi PRO sea realmente único es su fórmula innovadora, que transforma los datos de velas tradicionales en
Presentamos ON Trade Waves Patterns Harmonic Elliot Wolfe, un indicador avanzado diseñado para detectar diversas formas de patrones en el mercado mediante métodos tanto manuales como automáticos. A continuación, te explicamos cómo funciona: Patrones Armónicos: Este indicador puede identificar patrones armónicos que aparecen en tu gráfico. Estos patrones son esenciales para los traders que practican la teoría del trading armónico, tal como se popularizó en el libro de Scott Carney "Harmonic Tradi
El sistema PRO Renko es un sistema de trading de alta precisión especialmente diseñado para operar gráficos RENKO. Se trata de un sistema universal que se puede aplicar a diversos instrumentos de negociación. El sistema neutraliza eficazmente el llamado ruido de mercado, lo que le brinda acceso a señales de reversión precisas. El indicador es muy fácil de usar y solo tiene un parámetro responsable de la generación de señales. Puede adaptar fácilmente la herramienta a cualquier instrumento com
Scalper Vault
Oleg Rodin
5 (27)
Scalper Vault es un sistema profesional de reventa que le brinda todo lo que necesita para una reventa exitosa. Este indicador es un sistema comercial completo que puede ser utilizado por operadores de divisas y opciones binarias. El marco de tiempo recomendado es M5. El sistema le proporciona señales de flecha precisas en la dirección de la tendencia. También le proporciona señales superiores e inferiores y niveles de mercado de Gann. Los indicadores proporcionan todo tipo de alertas, incluidas
AW Trend Predictor
AW Trading Software Limited
4.74 (39)
La combinación de niveles de tendencia y ruptura en un sistema. Un algoritmo de indicador avanzado filtra el ruido del mercado, determina la tendencia, los puntos de entrada y los posibles niveles de salida. Las señales indicadoras se registran en un módulo estadístico, que le permite seleccionar las herramientas más adecuadas, mostrando la efectividad del historial de señales. El indicador calcula las marcas Take Profit y Stop Loss. Manual e instrucciones ->   Aquí   / Versión MT5 ->   Aquí Cóm
GOLD Impulse with Alert
Bernhard Schweigert
4.56 (9)
Este indicador es una super combinación de nuestros 2 productos Advanced Currency IMPULSE with ALERT  +   Currency Strength Exotics . ¡Funciona para todos los marcos de tiempo y muestra gráficamente el impulso de fuerza o debilidad para las 8 divisas principales más un Símbolo! Este Indicador está especializado en mostrar la aceleración de la fuerza de la divisa para cualquier símbolo como Oro, Pares Exóticos, Materias Primas, Índices o Futuros. Es el primero de su clase, cualquier símbol
Support Resistance screnner
STE S.S.COMPANY
4.86 (36)
Support And Resistance Screener está en un indicador de nivel para MetaTrader que proporciona múltiples herramientas dentro de un indicador. Las herramientas disponibles son: 1. Cribador de estructura de mercado. 2. Zona de retroceso alcista. 3. Zona de retroceso bajista. 4. Puntos pivotes diarios 5. Puntos de pivote semanales 6. Puntos Pivotes mensuales 7. Fuerte soporte y resistencia basado en patrón armónico y volumen. 8. Zonas de nivel de banco. OFERTA POR TIEMPO LIMITADO: El indicador de so
IX Power MT4
Daniel Stein
5 (5)
IX Power lleva por fin la insuperable precisión de FX Power a los símbolos que no son de Forex. Determina con exactitud la intensidad de las tendencias a corto, medio y largo plazo de tus índices, acciones, materias primas, ETF e incluso criptodivisas favoritas. Puede analizar todo lo que su terminal le ofrece. Pruébalo y experimenta cómo tu timing mejora significativamente a la hora de operar. Características principales de IX Power Resultados de cálculo 100% precisos y sin repintado -
FX Volume
Daniel Stein
4.6 (35)
Obtenga su actualización diaria del mercado con detalles y capturas de pantalla a través de nuestro Morning Briefing aquí en mql5 y en Telegram ! FX Volume es el PRIMER y ÚNICO indicador de volumen que proporciona una visión REAL del sentimiento del mercado desde el punto de vista de un bróker. Proporciona una visión impresionante de cómo los participantes institucionales del mercado, como los brokers, están posicionados en el mercado Forex, mucho más rápido que los informes COT. Ver esta info
TrendDecoder Premium
Christophe, Pa Trouillas
5 (2)
Identifique los rangos y los próximos movimientos probables   |  Obtenga las señales más tempranas y la fuerza de las Tendencias   |  Obtener salidas claras antes de reversión   |  Detecte los niveles de Fibo que el precio pondrá a prueba Indicador no repintado y no retardado - ideal para la trading manual y automatizada - adecuado para todos los activos y todas las unidades temporales Oferta por tiempo limitado >>   50% OFF Después de la compra, póngase en contacto con mi canal  para conocer lo
Gann Signal
Kirill Borovskii
Gann Signal is a very simple indicator at first glance, but hidden inside is many years of experience in studying W.D.Ganna methods. The indicator gives accurate BUY/SELL signals, without redrawing. The indicator is very easy to use. All you need to do is attach it to your chart and follow its recommendations. The indicator constantly analyzes the market for entry opportunities. When such an opportunity appears, the indicator gives a signal in the form of an arrow. I repeat, all signals are NOT
Antes que nada, vale la pena enfatizar que este Sistema de Trading es un Indicador No Repintado, No Redibujado y sin Retardos, lo que lo hace ideal para el trading profesional. El "Sistema de Trading de Soporte y Resistencia Inteligente" es un indicador avanzado diseñado para traders nuevos y experimentados. Empodera a los traders con precisión y confianza en el mercado de divisas. Este sistema integral combina más de 7 estrategias, 10 indicadores y varios enfoques de trading, incluyendo estr
Otros productos de este autor
Identify Trend
Aleksey Ivanov
4.25 (32)
El indicador Identificar tendencia (" Identify Trend "), que utiliza métodos de filtrado bastante simples pero robustos (según la mediana móvil - el algoritmo XM ) y algoritmos más complejos desarrollados por el autor (XC, XF, XS,  cuatro tipos de promedios móviles no retardados   SMAWL, EMAWL,  SSMAWL, LWMAWL ) , permite establecer el comienzo de un verdadero movimiento de tendencia con mucha precisión y, lo que es más importante, con un pequeño retraso, y identificar el plana. Es
FREE
The Identify Market State   indicator allows you to set the beginning of a new trends and pullbacks on an existing trend. This indicator can be used both for trading on scalper strategies and for long-term trading strategies.               The indicator is based on the 14 periodic DeMarker   indicator and the 8 periodic simple moving average from this indicator. Statistical studies have shown that the sharp peaks of the DeMarker   indicator curve when they drop below its minimum li
Scientific trade
Aleksey Ivanov
5 (1)
An extremely convenient indicator that truly makes the process of making money on the exchange easy. It is based on the scientifically rigorous theory of the market developed by the author, the beginning of which is presented here .                The full algorithm of this indicator operation is presented in the article .               The indicator calculates the most probable price movement trajectory and displays it on the chart. Based on the predicted price movement trajectory
TrueChannel
Aleksey Ivanov
5 (7)
The TrueChannel   indicator shows us the true price movement channels. This indicator resembles Donchian Channel   in its appearance, but is built on the basis of completely different principles and gives (in comparison with Donchian Channel , which is better just to use to assess volatility) more adequate trading signals.              As shown in the article , the price actually moves in channels parallel to the time axis and jumps abruptly from the previous channels to the subsequ
FREE
Absolute Bands
Aleksey Ivanov
4.5 (4)
Principles of construction of the indicator.               The Absolute Bands (AB) indicator is reminiscent of the Bollinger Bands indicator with its appearance and functions, but only more effective for trading due to the significantly smaller number of false signals issued to them. This effectiveness of the Absolute Bands indicator is due to its robust nature.               In the Bollinger Bands indicator, on both sides of the moving average - Ma, there are lines spaced from Ma by the standa
FREE
Quality trend
Aleksey Ivanov
5 (1)
The Quality trend indicator expresses the ratio of the strength of a trend or the speed of its growth (fall) to the degree of its noisiness or a certain norm of amplitudes of chaotic fluctuations of a growing (falling) price. The position of the indicator line above zero shows an increasing trend, below zero - a falling trend, the fluctuation of the indicator line near zero shows a flat. If the indicator line begins to fluctuate rapidly around zero and approach it, then this indica
Casual Channel
Aleksey Ivanov
5 (1)
Las tendencias que ves en los gráficos no siempre son tendencias o, más precisamente, tendencias con las que puedes ganar dinero. El caso es que hay dos tipos de tendencias:  1)   verdaderas tendencias , que son causadas por razones económicas fundamentales, que son estables y, por lo tanto, pueden proporcionar una ganancia confiable para el comerciante;  2)  y hay secciones de falsa tendencia que solo parecen una tendencia y surgen debido a cadenas de eventos aleatorios que despla
The Signal Envelopes   indicator uses the robust filtering method based on: (1) the moving median Buff0 = <Median> = (Max {x} + Min {x}) / 2 and (2) the averaging algorithm developed by the author Buff1 = <(<Median> ) ^ (- 3)> * (<Median>) ^ 4  based on the moving median. The Signal Envelopes   indicator allows you to most accurately and with the minimum possible delay set the beginning of a new trend.  The Signal Envelopes indicator can be used both for trading according to scalpe
Iterative Moving Average – IMA.   IMA is obtained by correcting the usual   MA.   The correction consists in addition   to MA averaged difference between the time series (X) and its MA, i.e.   IMA(X)=MA(X) + MA ( Х -MA(X)). Correction is done in several iterations (and, exactly, 2 iterations in this indicator) and with a change in the averaging period.               As a result, the time-series points begin to cluster around (on all sides) of the getting   IMA and with a smaller de
Firstly , the script estimates how many Mx bars of the chart (on which this script is applied) the future trend will most likely continue and what is its quality. Secondly (and most importantly), the script is an auxiliary tool for the extremely mathematically advanced and extremely effective ScientificTrade indicator in trading. The script calculates the optimal averaging period, which is also equal to Mx, of the ScientificTrade indicator, which gives the maximum profit according to the strate
The principle of constructing indicator lines .               Profit Trade  indicator is very effective for trading. Profit Trade  is a deep development of the well-known Donchian channel  indicator. The upper (BlueViolet color) Dup and the lower (IndianRed) Ddn lines of the indicator are constructed in the same way as in the Donchian channel , based on the highest (high of High) and lowest (low of Low) prices for the previous n1 = 20 periods. The middle line (Gold) Dm is constructed in the sam
Profit MACD
Aleksey Ivanov
5 (2)
I present an indicator for professionals. ProfitMACD is very similar to classic MACD in appearance and its functions . However, ProfitMACD is based on completely new algorithms (for example, it has only one averaging period) and is more robust, especially on small timeframes, since it filters random price walks. The classic MACD indicator (Moving Average Convergence / Divergence) is a very good indicator following the trend, based on the ratio between two moving averages, namely the EM
Alligator Analysis
Aleksey Ivanov
4.75 (4)
Indicator description.            The “ Alligator Analysis ” ( AA ) indicator allows you to build various (by averaging types and by scales) “ Alligators ” and their combinations, i.e. allows you to analyze the state of the market based on the correlation of this state with a whole range of different " Alligators ".  The classic " Alligator " by Bill Williams is based on moving averages and Fibonacci numbers, which makes it one of the best indicators now. The classic " Alligator "   is based on
FREE
Channel Builder
Aleksey Ivanov
4.67 (6)
The Channel Builder (CB) or Ivanov Bands indicator is a broad generalization of the Bollinger Bands indicator. First, in CB, the mean line <X> is calculated using various averaging algorithms. Secondly, the mean deviations calculated by Kolmogorov averaging are plotted on both sides of the middle line <X>.                The middle line <X>, besides the standard SMA, EMA, SMMA and LWMA averaging algorithms, can be Median = (Max + Min) / 2 sliding median (which is the default). In
FREE
The indicator visualizes the result of the   CalculateScientificTradePeriod    script (which, of course, also needs to be downloaded), which, firstly , estimates how many Mx bars of the active chart the future trend will most likely continue and what is its quality, and, secondly , calculates the optimal the averaging period (which is also equal to Mx) of the ScientificTrade   indicator, which gives the maximum profit according to the extremely effective   ScientificTrade strategy. For the FindS
Asummetry
Aleksey Ivanov
The principle of the indicator.                             The Asummetry  indicator allows you to predict the beginning of a change in the direction of trends, long before their visual appearance on the price chart.               The author statistically revealed that before changing the direction of the trend, the probability distribution function of the price is made as asymmetric as possible. More precisely, the price movement in any direction always pulls sideways the function of its dis
PDP indicator is used for: defining price probability distributions. This allows for a detailed representation of the channel and its borders and forecast the probability of a price appearing at each segment of its fluctuations; defining the channel change moment. Operation principles and features PDP analyzes a quote history on lower timeframes and calculates a price probability distribution on higher ones. Forecast algorithms allow the indicator to calculate probability distributions and m
Descripción del indicador.             " Signal Bands " es un procesamiento estadístico profundo y avanzado, un indicador sensible y conveniente que le permite ver inmediatamente en el gráfico principal y (1) la tendencia del movimiento del precio y (2) su canal claro y (3) signos latentes de un cambio en esta tendencia. El indicador se puede usar en gráficos de cualquier escala, pero, debido a su mayor sensibilidad al estado actual del mercado, es especialmente útil para el scalping.     Func
Structure of the indicator.               The Cunning crocodile indicator consists of three moving averages (applied to the price   Median price   = (high + low)/2 ) :   1) the usual MA ( SMA , EMA , SMMA ,   LWMA )  or the mean <X> of the process X and her two generalizations 2) <XF> = <X / <X >> * <X> and 3) <XS> = <X * <X >> / <X> with the same averaging period. All three curves intersect at common points that (such an intersection in which the cunning crocodile, unlike the usual one, "never
The principle of the indicator.               A simple moving average (SMA) with an averaging period (2n + 1) of bars is always obtained lagging by n bars. If SMA or other types of moving averages are the basis for making trading decisions, then their strong delay does not allow   to open positions in time and close positions, which leads to losses.                            The Estimation moving average without lag ( EMAWL ) indicator calculates the non-lagging moving average, which is calcula
The principle of the indicator.               The Strong Trend Flat Signal (STFS) indicator is the intersection of two, developed by the author, non-lagging moving averages with averaging periods 21 and 63.               A simple moving average (SMA) with an averaging period (2n + 1) of bars is always obtained lagging by n bars. If SMA or other types of moving averages are the basis for making trading decisions, then their strong delay does not allow  to open positions in time and close positi
StatChannel
Aleksey Ivanov
5 (1)
The principle of the indicator.               The StatChannel ( SC ) indicator is a development of the Bollinger Bands indicator ( ВВ ).  BB is a moving average, on both sides of which two lines are drawn, separated from it by standard deviations std multiplied by the corresponding coefficient. At the same time, a moving average with an averaging period (2n + 1) bars is always obtained lagging behind n bars.  Sliding std is also lagging behind on n bars, also calculated by (2n + 1) points. Such
StatPredict
Aleksey Ivanov
Introducción.              El indicador predice el precio de acuerdo con la tendencia predominante y sus propias pequeñas fluctuaciones estadísticas de precios. En StatPredict , debe configurar el horizonte de tiempo de los eventos pronosticados, que se establece mediante el parámetro de configuración del indicador « Length of forecast in bars » .   El horizonte de pronóstico de eventos está determinado por la escala temporal característica de la tendencia actual, que se mide mejor por el indica
Indicator is used for: defining price probability distributions. This allows for a detailed representation of the channel and its borders and forecast the probability of a price appearing at each segment of its fluctuations; defining the channel change moment.   Operation principles and features Indicator analyzes a quote history on lower timeframes and calculates a price probability distribution on higher ones. Forecast algorithms allow the indicator to calculate probability distributions and m
The principle of constructing indicator lines and their meaning .               The Signal Channel   indicator uses a robust filtering method based on two moving medians applicable to the High and Low prices, i.e. the lines <High> and <Low>, where <..> is the sign of linear averaging, which are shifted by certain values ​​in an uptrend and by opposite values ​​in a downtrend, which allows you to get a narrow channel, approximately outlining each bar. Sharp kinks of the lines of such a channel a
Robust Filter
Aleksey Ivanov
5 (1)
The Robust filter   indicator is based on the robust filtering algorithm developed by the author using the multi-period averaged moving median. The algorithm for this averaging is shown in the last screenshot.                The indicator calculates and shows: 1. The direction of the trend; 2. Entry and exit points of positions; 3. StopLoss   lines calculated from current price probability distributions and selected probability of closing an order by StopLoss before the trend revers
This   indicator is intended for professionals assessing fundamental market trends.  This indicator calculates the index of any instrument and analyzes it.              The index of the state currency shows the real purchasing power of this currency, and the dynamics of this index shows the dynamics of the economic state of the corresponding state. An analysis of the indices of both currencies included in a currency pair makes it much more reliable to identify the trend of this cur
The Multicurrency Trend Detector ( MTD ) indicator allows you to immediately and on one chart on a selected time interval (extending from a zero bar to a bar set in the settings by the value horizon) determine the presence, direction and strength of trends in all major currencies, as well as assess the reliability of these trends.               This is achieved by calculating indices (non-relative purchasing power) of eight major currencies, namely: AUD, CAD, CHF, EUR, GBP, JPY, NZ
StatZigZag
Aleksey Ivanov
The StatZigZag  indicator looks like a regular ZigZag , but is built on the basis of completely different algorithms. The StatZigZag  indicator is a broken line built from segments of regression lines of different lengths, the beginning of each of which comes from the end of the previous segment. Each regression segment is built until the variance or spread of price around it begins to exceed a certain critical value, after which the construction of this segment ends and the constr
The Velocity of price change   ( VP ) indicator shows the average rate of price change at those characteristic time intervals where this rate was approximately constant. The robust algorithm used in VP   to smooth out the price from its random jumps, ensures the reliability of the indicator reading, which does not react to simple price volatility and its insignificant movements.             The indicator allows you to track trends and the moments of their reversals , during which t
Filtro:
iliabogos2020
29
iliabogos2020 2019.09.12 17:28 
 

Привет всем ! Пока тестирую индикатор, на каком ТФ ловить сигналы , есть разница ? Спасибо.

Alec Markarian
329
Alec Markarian 2019.03.04 22:37 
 

Great indicator to use for confirmation of bias and/or exits, under correct settings and time frame, can be adjusted very well to precisely fit your strategy, in what ever market it is that you trade.

Uladzimir Izerski
14278
Uladzimir Izerski 2019.01.11 17:45 
 

Вижу профессионализм над созданием. Очень хорошо.

Respuesta al comentario
Versión 7.0 2021.11.03
1. Algoritmo de cálculo de lotes mejorado, que ahora se calcula no solo para forex, sino también para CFD y futuros.
2. Visualización mejorada de datos numéricos calculados por el indicador
Versión 6.0 2020.11.03
Added TakeProfit calculation algorithm.
Versión 5.1 2020.10.05
Added the ability to hide StopLoss lines.
Optimization of the code.
Versión 5.0 2020.08.27
1. Improved filtering algorithm for random market noise.
2. Based on the current distributions of the probability of prices and the given probability of obtaining unprofitable trades, the StopLoss lines were calculated and visualized.
3. Added the function of calculating the lot based on the size of the deposit, the permissible % loss level and the StopLoss position.

Versión 4.0 2019.11.20
Added arrows showing the moments of the change in the direction of the trend.
Three modes of visual display of information are made:
1) Arrows showing the immediate direction of price movement and the moment of trend change.
2) Arrows showing only the direction of price movement.
3) Arrows showing only the moments of a trend change.
Versión 3.0 2019.05.14
Added push and mail alert types.
A number of signal identification methods have been introduced.
Versión 2.0 2019.02.05
The indicator added the ability to select any type of notification of trading signals, namely:
1. Window with message and beep (function Alert).
2. The text in the tab "expert" (function Print);
3. A message on the chart (function Comment);
4. Beep and text in the "expert" tab;
5. Beep and message on screen;
6. Single beep (function PlaySound).
The alert is activated when the indicator indications (for the trend direction) coincide on the last two bars.