• Información general
  • Comentarios (3)
  • Discusión (13)
  • Novedades

Choppy Market Index indicator

CMI - Profit from trending and ranging markets.

The CMI indicator is a two-part system used to trigger both trend and counter-trend trades, that has been introduced by Daniel Fernandez in an article published in Currency Trading Magazine (August 2011 issue). It is a simple, yet effective indicator, which gauges whether the market has behaved in a choppy (non-directional) manner or trending (directional) manner. CMI calculates the difference between the most recent bar's close and the close n bars ago and then divides this value by the difference between the highest high and lowest low over these n bars.

The system is composed of two separate sets of rules for both the ranging and trending markets (the CMI indicator is configured for these two rules by default settings).

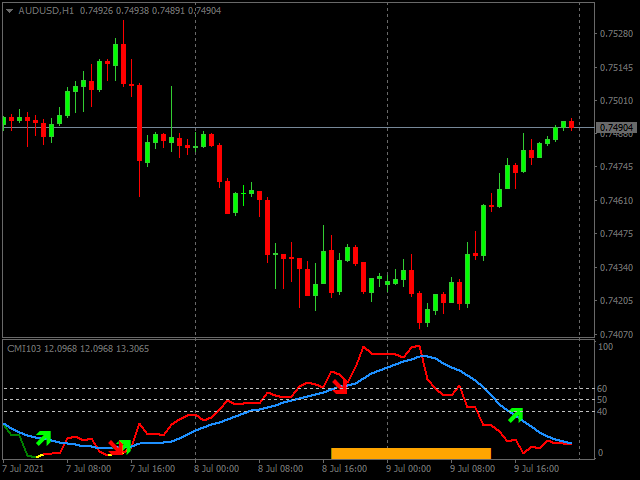
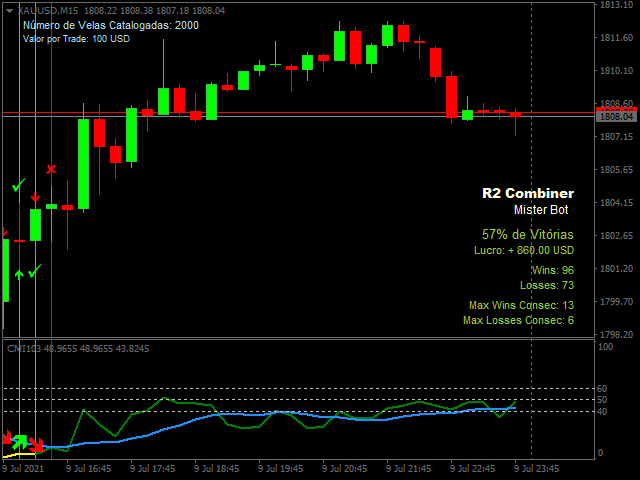
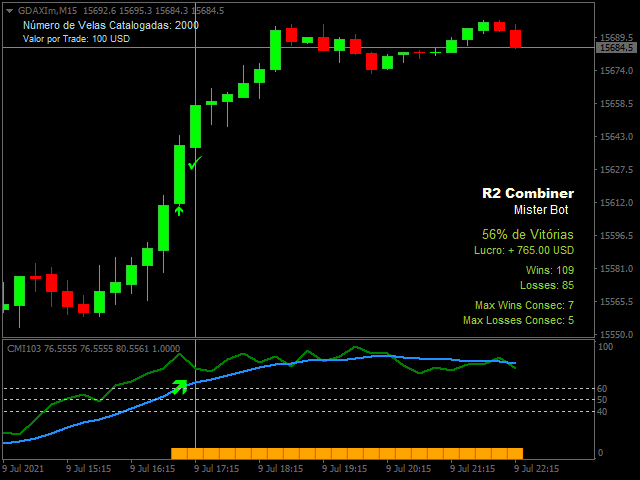
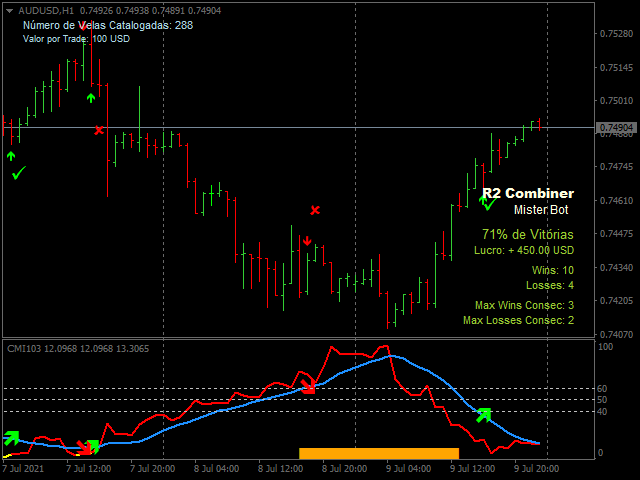
Default settings give the best result on the 1H timeframe. Buy & Sell signals are provided as green and red arrows on the indicator's plot.

Range strategy rules

  1. Enter long when the smoothing MA (blue line) of the CMI is below 40 and the CMI line color is red.
  2. Enter short when the smoothing MA (blue line) of the CMI is below 40 and the CMI line color is green.
  3. Exit trades when CMI moves above 50.

Trend strategy rules

  1. Enter long when the smoothing MA (blue line) is above 60 and the CMI line color is green.
  2. Enter short when the smoothing MA (blue line) is above 60 and the CMI line color is red.
  3. Exit trades when CMI moves below 50.

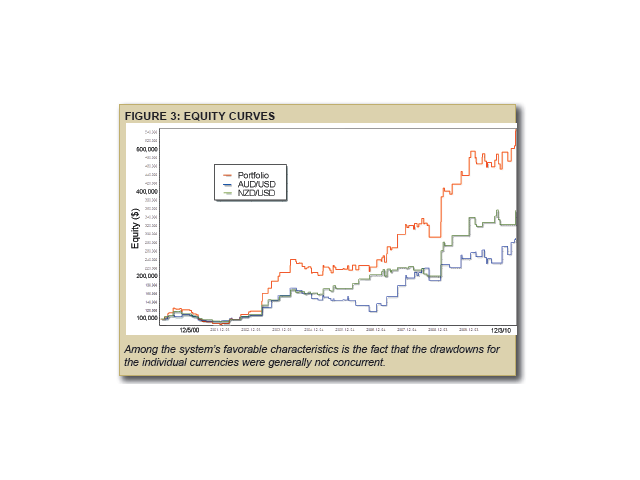
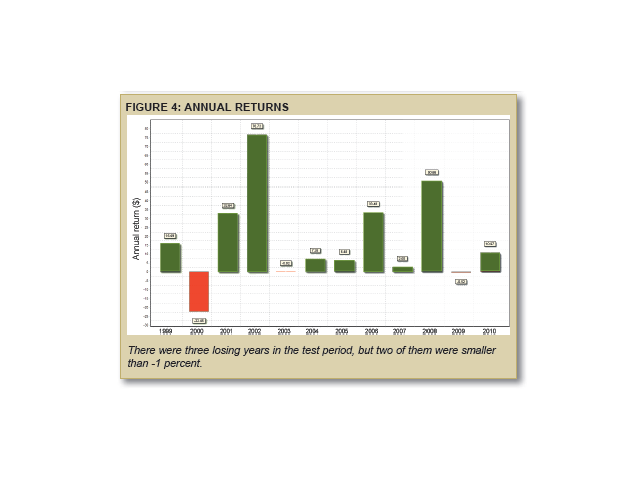
The approach has been tested in an article published in Currency Trading Magazine using data ranging from 1999 to 2010 on two currency pairs (AUDUSD and NZDUSD). There were only three losing years in the tested period, but two of them were smaller than -1 percent. Therefore, the system suggests it is possible, given realistic expectations, to create strategies using a core concept that can tackle both trending and ranging conditions. The published result can be seen in the last two screenshots.


Indicator parameters

  • Period - the number of candles that are used for calculation of the CMI value
  • MA period - the period of the moving average (blue line)
  • Display alerts in Alert Window - Buy and Sell signals are displayed in the alert window
  • Send alerts via e-mail - Buy and Sell signals are sent to e-mail via MT4 platform
  • Send alerts via push notifications - Buy and Sell signals are sent to the smartphone via MT4 platform's push notifications

Indicator buffers

  • buffer 0 - CMI line
  • buffer 1 - CMI line is green (positive)
  • buffer 2 - CMI line is red (negative)
  • buffer 3 - Signal MA
  • buffer 4 - Buy signal
  • buffer 5 - Sell signal
  • buffer 6 - Trending market indication


    Productos recomendados
    VR Cub
    Vladimir Pastushak
    VR Cub es un indicador para obtener puntos de entrada de alta calidad. El indicador fue desarrollado para facilitar los cálculos matemáticos y simplificar la búsqueda de puntos de entrada a una posición. La estrategia comercial para la cual se diseñó el indicador ha demostrado su eficacia durante muchos años. La simplicidad de la estrategia comercial es su gran ventaja, que permite que incluso los operadores novatos negocien con éxito con ella. VR Cub calcula los puntos de apertura de posiciones
    Индикатор iVeles_Perfect_Oscilator является опережающим и одним из самых лучших осциляторов на сегодняшний день,  использует специализированный расчет текущих цен графика.  Очень качественно и своевременно показывает смену направления, очень точный подход к уровням перекупленности и перепроданности, что позволяет своевременно принять решение по сделке.  Работает качественно на любом ТФ и с любым инструментом. Параметры: period_Osc - период расчетов average_Osc  - усреднение  МА method_Osc - прим
    PW Oscillator
    Svyatoslav Kucher
    PW Oscillator   - индикатор предназначенный для поиска локальных экстремумов, определения текущей тенденции. В расчетах индикатора используется авторская методика. С помощью индикатора можно определять места возможного разворота цены желательно в направлении тенденции, но также с достаточной точностью и против нее. Также с помощью индикатора можно определять текущую тенденцию. Индикатор подходит для любых валютных пар, но для адекватного отображения показания необходимо, чтобы было достаточно ис
    This is a new strategy for SUPPLY DEMAND areas It is based on a calculation using the tick volume to detect the big price action in market for both bear /bull actions this smart volume action candles are used to determine the supply and demand areas prices in between main supply and demand lines indicate sideway market  up arrows will be shown when prices moves above the main supply and the secondary supply lines Down arrows will be shown when prices moves below the main demand and the secondary
    This is a correlation hedge type indicator which helps trade the obscure relationship between crude oil and natural gas markets. Which is overall an unknown trading concept to most traders, yet a very impressive one. -----------------------------------------------------------------Overlooked Strategy------------------------------------------------------------------------------------------- Important!: this indicator is for Pepperstone users only,  due to wide spread unavailability of symbo
    The indicator detects and displays 3 Drives harmonic pattern (see the screenshot). The pattern is plotted by the extreme values of the ZigZag indicator (included in the resources, no need to install). After detecting the pattern, the indicator notifies of that by a pop-up window, a mobile notification and an email. The indicator highlights the process of the pattern formation and not just the complete pattern. In the former case, it is displayed in the contour triangles. After the pattern is com
    Market Structure Zig Zag
    Lesedi Oliver Seilane
    4.77 (22)
    Free Market structure zig zag to assist in price action trading the screenshots describe how to use and how to spot patterns new version comes with alerts, email alert and  push notification alert can be used on all pairs  can be used on all timeframes  you can add additional confirmation indicators the indicator shows you your higher high and low highs as well as your lower lows and lower highs  the indication makes price action analysis easier to spot.
    FREE
    Black series MT4
    Dmitriy Kashevich
    1 (1)
    Black series MT4 - The indicator is designed for trading on binary options with Timeframe M1-M5-M15 Multicurrency (Works on cryptocurrency and currency pairs) The signal appears when the candle opens Up to 90% correct signals There is no signal redrawing at all Can be used with other indicators. Good for scalping! In Settings there is: -Indicator working methods -I Allert Arrow color Red signal down Blue signal up Also watch the video how the indicator works and signals
    PipFinite Exit EDGE
    Karlo Wilson Vendiola
    4.89 (160)
    Did You Have A Profitable Trade But Suddenly Reversed? In a solid strategy, exiting a trade is equally important as entering. Exit EDGE helps maximize your current trade profit and avoid turning winning trades to losers. Never Miss An Exit Signal Again Monitor all pairs and timeframes in just 1 chart www.mql5.com/en/blogs/post/726558 How To Trade You can close your open trades as soon as you receive a signal Close your Buy orders if you receive an Exit Buy Signal. Close your Sell orde
    The indicator detects and displays Shark harmonic pattern (see the screenshot). The pattern is plotted by the extreme values of the ZigZag indicator (included in the resources, no need to install). After detecting the pattern, the indicator notifies of that by a pop-up window, a mobile notification and an email. The indicator highlights the process of the pattern formation and not just the complete pattern. In the former case, it is displayed in the contour triangles. After the pattern is comple
    The indicator shows De Mark patterns and gives trading signals in the form of arrows and alerts. Shows De Mark lines on the history of quotes. Has a multiframe., Can show DeMark patterns of higher timeframes on lower timeframes. Has a switchable function for displaying fractals. Trading signals are accompanied by sound alerts, as well as sending them to mail and mobile devices.
    Gioteen Volatility Index (GVI)   - your ultimate solution to overcoming market unpredictability and maximizing trading opportunities. This revolutionary indicator helps you in lowering your losing trades due to choppy market movements. The GVI is designed to measure market volatility, providing you with valuable insights to identify the most favorable trading prospects. Its intuitive interface consists of a dynamic red line representing the volatility index, accompanied by blue line that indicat
    The Wing Patterns indicator scans for many different kinds of Patterns using an XABCD structure. The term Wing Pattern is used to refer to all types of patterns based on a general XABCD structure, which is plotted in an alternate high-low extreme form. In other words, assume that point X is started at a low point on the chart. The point A is plotted at the next highest point within a certain number of bars. This certain number of bars is called the depth level. In this example, point B would be
    FreqoMaster
    Stanislav Korotky
    The main idea of this indicator is rates analysis and prediction by Fourier transform. The indicator decomposes exchange rates into main harmonics and calculates their product in future. The indicator shows 2 price marks in history, depicting price range in the past, and 2 price marks in future with price movement forecast. Buy or sell decision and take profit size are displayed in a text label in the indicator window. The indicator uses another indicator as an engine for calculations - FreqoMet
    MACD Divergence
    Sergey Deev
    2.5 (2)
    The indicator detects divergence signals - the divergences between the price peaks and the MACD oscillator values. The signals are displayed as arrows in the additional window and are maintained by the messages in a pop-up window, e-mails and push-notifications. The conditions which formed the signal are displayed by lines on the chart and in the indicator window. Indicator Parameters MacdFast - fast MACD line period MacdSlow - slow MACD line period MacdSignal - MACD signal line period MacdPri
    Professional forex expert   Black Angel   (for EURUSD, GBPUSD pairs) alyzing the market using the Elliot Wave Index. Elliott wave theory is the interpretation of processes in financial markets through a system of visual models (waves) on price charts. The author of the theory, Ralph Elliott, identified eight variants of alternating waves (of which five are in the trend and three are against the trend). The movement of prices in the markets takes the form of five waves. Three of them (1, 3, 5)
    Pisces TheProfitZone "Pisces TheProfitZone MT4 Indicator Powered byFxGangster" This indicator will calculate new support and resistant zone everyday, and that give us a trading zone such as thats telling us TP and SL, So it still telling us for where should the price will go reach? Fore Example. Uptrend : If Price can stay upper a Line and price close higher above a Line, then the price will continue go up to reach next Line. Downtrend : If Price can't pass to stay upper a Line and the pr
    Super Gator
    Agustinus Biotamalo Lumbantoruan
    This indi shows the following 1. Supertrend 2. Alligator (Not a regular alligator) 3. ZigZag 4. Moving Average 5. Trend Continuation/Mini correction Signal (plotted in X) (See screenshots in green background color 6. Early Signal Detection (See screenshots in green background color) You may treat Alligator as the lagging indicator The leading indicator is the supertrend. The zig zag is based on the leading indicator where it gets plotted when the leading indicator got broken to the opposite.
    Strong Retracement Points Pro demo edition! SRP (Strong Retracement/Reversal Points) is a powerful and unique support and resistance indicator. It displays the closest important levels which we expect the price retracement/reversal! If all level are broken from one side, it recalculates and draws new support and resistance levels, so the levels might be valid for several days depending on the market! If you are still hesitating to start using this wonderful tool, you can check this link to see h
    Exclusive Limited Time Offer! Grab this useful indicator for a lifetime at just $49. Note: It is requested that purchases must be refrained from if the buyer is from India, Bangladesh, or Pakistan, as developer support for these regions is unavailable due to legal restrictions. Volatility indicator dashboard designed to revolutionize how traders perceive and navigate market volatility. Track volatile for multiple currency pairs one at time for multiple timeframes. Works best with Forex Market,
    Owl smart levels
    Sergey Ermolov
    4.63 (54)
    Versión MT5  |   FAQ El   Indicador Owl Smart Levels   es un sistema comercial completo dentro de un indicador que incluye herramientas de análisis de mercado tan populares como   los fractales avanzados de Bill Williams , Valable ZigZag que construye   la estructura de onda correcta   del mercado y   los niveles de Fibonacci   que marcan los niveles exactos de entrada. en el mercado y lugares para tomar ganancias. Descripción detallada de la estrategia Instrucciones para trabajar con el indi
    Laser Trend
    Nicolas Zouein
    The trend is your friend! This is what this indicator is all about. Follow this famous saying and be safe. Characteristics: Buy/Sell signals fixed on the close of a bar. Works on all symbols and all timeframes. Clear visual market trend laser line, Buy/Sell signal arrows, market strength meter, TP1 & TP2 boxes. Visual signals when to enter, when to exit the market. No repainting. Compatible with Flexible EA for trading automation. (Ask for a free set file optimized to perform 2010-2018) Para
    The indicator displays Renko bars on the chart, uses them to plot the ZigZag - trend lines connecting the local Lows and Highs of the price movement, and highlights them based on the Gartley patterns, showing the potential price reversal points. Renko - specialized display of the price action, in which the graph is displayed not every bar of the time frame, but only under the condition that the price had passed more than the specified number of points. Renko bars are not bound to a time frame, s
    PABT Pattern Indicator - it's classical system one of the signal patterns. Indicator logic - the Hi & Lo of the bar is fully within the range of the preceding bar, look to trade them as pullback in trend. In the way if indicator found PABT pattern it's drawing two lines and arrow what showing trend way.  - First line - it's entry point and drawing at: 1. On the high of signal bar or on middle of the signal bar (depending from indicator mode) for buy; 2. On the low of signal bar or on middle of t
    Victorias
    Andriy Sydoruk
    Victoria is a trend indicator used to identify trends in financial markets, indicates the direction of price movement. Flexible indicator settings allow you to receive more accurate signals for opening positions. The indicator will allow you to determine the current trend. Using this algorithm, you can quickly understand what kind of trend is currently developing in the market. Victoria can be used along with oscillators as a filter. Victoria is a true range indicator that identifies the ra
    TradingDesk
    Christian Weilinger
    4 (1)
    TradingDesk – Performance Analyse MT4 To test the indicator download free Demo version here: https://www.mql5.com/en/market/product/40471 TradingDesk analysed MetaTrader 4 historical data by Symbol, Magic Number, Trade or Comment. All these evaluations will be displayed in real time on your MetaTrader 4 chart window. All this information will be displayed in the following dashboards: account info General information about the account is displayed in the account info dashboard. performance
    Wave Wolf MT4
    Andrei Salanevich
    El indicador Forex Wave Wold MT4 está diseñado para buscar ondas de Wolfe y mostrarlas en la ventana actual del terminal comercial. Excelente indicador para los comerciantes que utilizan en el comercio de la onda de Wolfe. Su uso en estrategias comerciales aumentará significativamente su eficiencia y rentabilidad. INFORMACIÓN DEL INDICADOR A diferencia de otros indicadores de ondas Wolfe, el indicador Forex Wave Wold MT4 tiene una serie de características que aumentan significativamente su ef
    Atlon
    Roman Kucher
    El complejo de señales Atlon es un sistema comercial listo para usar que envía señales en forma de flechas al correo electrónico y notificaciones automáticas a su teléfono. Atlon también muestra niveles de TP listos para usar en forma de cuadrados rojos. El sistema funciona en cualquier gráfico (pares de divisas, acciones, criptomonedas, metales, petróleo). Periodo H1. El sistema no se vuelve a dibujar y las flechas no desaparecen por ningún lado. El conjunto incluye configuraciones lista
    GMMA Trade X is an EA based on GMMA. GMMA parameters such as MovingAveragePeriod1-24, MovingAverageMAShift1-24, MovingAverageShift1-24 and CandlestickShift1-24 can be adjusted. GMMA Trade X applies BTN TECHNOLOGY's state-of-the-art intelligent technology to help you create optimal results for your trades. May your dreams come true through GMMA Trade X. Good luck. = == == Inquiries = == == E-Mail:support@btntechfx.com
    Fractal Zig Zag
    Mikhail Nazarenko
    5 (1)
    A   professional version of the ZigZag indicator for visualizing the structure of price movements by fractals. Fractal ZigZag fixes the flaws of the standard version of the ZigZag indicator MT4. It uses Price action and a unique filtering algorithm to determine fractals. Suitable for all types of trading. Ideal for trading according to the WM pattern "Sniper" strategy !!! Features Marks the place of price reversal during the formation of a new fractal with specified parameters. Suitable for
    Los compradores de este producto también adquieren
    TrendMaestro
    Stefano Frisetti
    5 (2)
    note: this indicator is for METATRADER4, if you want the version for METATRADER5 this is the link: TRENDMAESTRO recognizes a new TREND in the bud, he never makes mistakes. The certainty of identifying a new TREND is priceless. DESCRIPTION TRENDMAESTRO identifies a new TREND in the bud, this indicator examines the volatility, volumes and momentum to identify the moment in which there is an explosion of one or more of these data and therefore the moment in which prices have strong probability of f
    Presentamos el Indicador Milagroso de Forex: Desata el Poder del Trading Preciso ¿Estás cansado de buscar el mejor indicador de Forex que realmente ofrezca resultados excepcionales en todos los marcos temporales? ¡No busques más! Ha llegado el Indicador Milagroso de Forex para revolucionar tu experiencia de trading y llevar tus ganancias a nuevas alturas. Construido sobre una base de tecnología de vanguardia y años de desarrollo meticuloso, el Indicador Milagroso de Forex se erige como el pinácu
    Shepherd Harmonic Pattern
    Abdullah Alrai
    4.68 (59)
    Este indicador detectará patrones armónicos que se dibujen en el gráfico mediante métodos manuales y automáticos. Puede consultar el manual del usuario en el siguiente enlace: Agregue su opinión y contáctenos para obtenerlo Existe una versión gratuita para probar este producto en mt4. Puede utilizarlo para detectar patrones de Gartley y Nenstar: https://www.mql5.com/en/market/product/30181 Puede comprar la versión completa de MT4 en: https://www.mql5.com/en/market/product/15212 Notas El indicad
    How to use Pair Trading Station Pair Trading Station is recommended for H1 time frame and you can use it for any currency pairs. To generate buy and sell signal, follow few steps below to apply Pair Trading Station to your MetaTrader terminal. When you load Pair Trading Station on your chart, Pair Trading station will assess available historical data in your MetaTrader platforms for each currency pair. On your chart, the amount of historical data available will be displayed for each currency pai
    Presentamos ON Trade Waves Patterns Harmonic Elliot Wolfe, un indicador avanzado diseñado para detectar diversas formas de patrones en el mercado mediante métodos tanto manuales como automáticos. A continuación, te explicamos cómo funciona: Patrones Armónicos: Este indicador puede identificar patrones armónicos que aparecen en tu gráfico. Estos patrones son esenciales para los traders que practican la teoría del trading armónico, tal como se popularizó en el libro de Scott Carney "Harmonic Tradi
    Por supuesto, aquí tienes la traducción al español: Presentamos el Indicador de Astronomía para MT4: Tu Compañero Celestial Definitivo en el Trading ¿Estás listo para elevar tu experiencia de trading a alturas celestiales? No busques más allá de nuestro revolucionario Indicador de Astronomía para MT4. Esta innovadora herramienta trasciende los indicadores de trading tradicionales, aprovechando el poder de algoritmos complejos para proporcionarte una visión astronómica sin igual y cálculos de pre
    PZ Day Trading
    PZ TRADING SLU
    3.67 (3)
    Este indicador detecta reversiones de precios en forma de zig-zag, utilizando solo análisis de acción de precios y un canal donchian. Ha sido diseñado específicamente para el comercio a corto plazo, sin repintar ni pintar en absoluto. Es una herramienta fantástica para comerciantes astutos con el objetivo de aumentar el tiempo de sus operaciones. [ Guía de instalación | Guía de actualización | Solución de problemas | FAQ | Todos los productos ] Increíblemente fácil de comerciar Proporciona
    Please send me Direct message on MQL5 CHAT after purchasing the Indicator for Training and Installation Support There are some additional files that is important to use with the Indicator . So be sure to contact me after purchasing the Indicator So that I can add you for training and support . If you find any difficulty with installation then send me Direct message here So that I can connect with you via Anydesk or Teamview for the product installation. " Smart Order Block Indicator " to find
    The breakout algorithm is a technique based on price, price features, to shape a breakout strategy. The strategy in this indicator will not be redrawn (none-repaint indicator), it is suitable for short or long term traders In the screenshot is the EURUSD pair, these currency pairs, commodities or stocks, it have similar strength *Non-Repainting (not redrawn) *For Metatrader4 Only *Great For Scalping *Great For Swing Trading *Arrow Entry, Green is Long, Red is Short *Works On Any Timeframe *Work
    Indicator : RealValueIndicator Description : RealValueIndicator is a powerful tool designed specifically for trading on the EURUSD pair. This indicator analyzes all EUR and USD pairs, calculates their real currency strength values, and displays them as a single realistic value to give you a head start on price. This indicator will tell you moves before they happen if you use it right. RealValueIndicator allows you to get a quick and accurate overview of the EURUSD currency pair tops and bottoms,
    Gann Signal
    Kirill Borovskii
    Gann Signal is a very simple indicator at first glance, but hidden inside is many years of experience in studying W.D.Ganna methods. The indicator gives accurate BUY/SELL signals, without redrawing. The indicator is very easy to use. All you need to do is attach it to your chart and follow its recommendations. The indicator constantly analyzes the market for entry opportunities. When such an opportunity appears, the indicator gives a signal in the form of an arrow. I repeat, all signals are NOT
    Order Block Indicator MT4
    Diego Arribas Lopez
    5 (3)
    [ Versión MT 5 ] Order Block Indicator MT5 Order Block Indicator MT4 es actualmente el indicador más preciso y personalizable del mercado. Ha sido desarrollado para facilitar el análisis de operativas basadas en Bloques de Órdenes y Zonas de Oferta y Demanda. Estas zonas son posibles puntos de reversión de un movimiento. Order Block Indicator MT4 resalta los bloques de órdenes activos de hasta 4TFs simultáneamente. A su vez, Order Block Indicator MT4 provee de un sistema de alerta visual que
    Introduction Excessive Momentum Indicator is the momentum indicator to measure the excessive momentum directly from raw price series. Hence, this is an extended price action and pattern trading. Excessive Momentum Indicator was originally developed by Young Ho Seo. This indicator demonstrates the concept of Equilibrium Fractal Wave and Practical Application at the same time. Excessive Momentum detects the market anomaly. Excessive momentum will give us a lot of clue about potential reversal and
    System Trend Pro - This is the best trend trading indicator!!! The indicator no repaint!!!   The indicator has   MTF   mode, which adds confidence to trading on the trend (   no repaint   ). How to trade? Everything is very simple, we wait for the first signal (big arrow), then wait for the second signal (small arrow) and enter the market in the direction of the arrow. (See screens 1 and 2.) Exit on the opposite signal or take 20-30 pips, close half of it, and keep the rest until the oppo
    SMCpro VIP MT4  Original Price  $620   ---  Currently Price 20% OFF ( for unlimited use )   BONUS  AUX VIP Club 2024 : Include  EA Airbag  and  Load Data History  to enhance the performance of this tool to its maximum potential  Click Here to Download Files   ( for users only )   Hello World! Introducing.. SMCpro VIP tool and Indicator for MetaTrader 4, designed to revolutionize your trading experience with the ICT Smart Money Concept. This system is meticulously crafted to empower trad
    Candle Power Pro
    Thushara Dissanayake
    4.33 (6)
    Libere el poder de la información de volumen real con el indicador   Candle Power Pro   . Esta herramienta dinámica captura los datos del volumen real de cada vela y los presenta como un porcentaje del volumen total. Al hacerlo, le permite discernir la lucha en curso entre compradores y vendedores en el mercado. Candle Power Pro muestra la batalla entre compradores y vendedores como un porcentaje del volumen total, brindándole información valiosa sobre la dinámica del mercado. Puede confirmar fá
    Market Breaker Updated version 3
    Allistair Kabelo Mandow
    1 (1)
    Features for software Main functions: Accurate entry signals WITHOUT REPAINTING! Once a signal appears, it remains valid! This is a significant distinction from repainting indicators that might provide a signal and then alter it, potentially leading to deposit losses. Now, you can enter the market with higher probability and precision. There's also a function to colour candles after an arrow appears until the target (take profit) is reached or a reversal signal appears . Display of STOP LOSS
    Weis Wave with Alert
    Trade The Volume Waves Single Member P.C.
    4.79 (19)
    Rental/Lifetime Package Options and Privileges' * For optimum results the yearly or lifetime package is suggested due to live training and Discord  channel trading with the  creator! Rent Monthly Six Months   Yearly/Lifetime Weis Wave with Speed with Alert+Speed Index x x x Manual  x x x Quick Set up Video x x x Blog x x x Lifetime Updates x x x Setup and Training Material x x Free Rectangle Break Alert Tool      x Discord Access Channel "The SI traders" x 2-hour live methodology traini
    MartingaleArrow
    Abdulkarim Karazon
    Martingale Arrow es un indicador mt4 de tipo flecha diseñado para el comercio de opciones binarias martingala, esta flecha se imprime en la barra abierta/intra barra y da alerta. CÓMO UTILIZAR: abra la operación en el momento en que aparezca la flecha, si la operación ganó, espere la siguiente señal y opere con el mismo lote. Si la operación pierde el doble lote en la siguiente señal y continúa haciéndolo hasta que gane una señal, reinicie y opere con el primer lote comercial. PLAZO RECOMENDADO
    A. ¿Qué es A2SR ?   * Es un indicador técnico líder (sin repintado, sin retraso). -- Guía : -- en https://www.mql5.com/en/blogs/post/734748/page4#comment_16532516 -- y https://www.mql5.com/en/users/yohana/blog A2SR tiene una técnica especial para determinar los niveles de Soporte (demanda) y Resistencia (oferta). A diferencia de la forma ordinaria que vimos en la red, A2SR tiene un concepto original para determinar los niveles reales de SR. La técnica original no se tomó de Internet y tampoco
    Full STO
    Roman Smoroda
    Indicador STO completo (incluye todas las versiones de tres indicadores STO: Premium, Gold, Silver) - STABLE TRADE OPTION está diseñado para el comercio automático de opciones binarias.  ¡¡¡¡¡LEA CUIDADOSAMENTE!!!!! IMPORTANTE En un terminal cree dos plantillas con diferentes vencimientos, una plantilla para las 18:01, 18:02 con vencimientos de 1 a 15 minutos y una plantilla para las 22:00 con vencimientos de 10 a 20 minutos. Winrate: 71% en los últimos 5 años Gestión del dinero: 0,3% d
    Full Forex Market View Dashboard
    Opengates Success International
    5 (2)
    VISTA COMPLETA DEL MERCADO FOREX Indicador del tablero Este es un indicador personalizado creado para brindar a los comerciantes una visión completa de lo que está sucediendo en el mercado. Utiliza datos en tiempo real para acceder al mercado y mostrar toda la información necesaria para realizar transacciones exitosas. INSTALACIÓN: Antes de adjuntar este indicador a su gráfico de ventana, vaya al panel Market Watch de su MT4 y OCULTE todos los pares de divisas que no necesita ni opere y
    Connect Indicator
    Sukunthakan Ngernbamrung
    Connect Indicator is a tool used for connecting indicators between the MQL market and MT4. The connected indicators are made by our group and can be used for other applications, such as sending messages to the Line application or Telegram application. If you have any questions, please don't hesitate to ask us to receive support. Function and indicator buffer Buffer one is the high price of the previous candle. Buffer two is the high price of the previous candle. Usage To connect indicators to fu
    Idea: RSI ( Relative Strength Index) and CCI ( Commodity Channel Index ) are powerfull to solved the market.  This indicator has Smoothed Algorithmic signal of RSI and CCI. So that, it separates the market into buy and sell zones, these areas are marked with arrows, red for downtrend, green for uptrend. This algorithm has the effect of predicting the next trend based on the historical trend, so users need to be cautious when the trend has gone many candles. Please visit screenshots
    DESCRIPTION The CHAOS INDICATOR has been developed to be used for the TRADING STRATEGY OF CHAOS, as described in the book. The book is in italian language only and can be obtained only on my website indicated below. DATAS COLLECTED AND SHOWN ON GRAPHS The CHAOS INDICATOR apply easily to any graph and any asset, and it is a TRADING FACILITATOR, as it identify immediately the following items on any graph: - The GP (= RIGHT PRICE) i.e. the price to which the asset should be attracted within 24
    Desata el poder de la rentabilidad en las opciones binarias con el "Indicador Eagle Eye" para MT4 Prepárate para emprender un viaje revolucionario en el mundo de las opciones binarias con el impresionante "Indicador Eagle Eye" para MetaTrader 4 (MT4). Esta herramienta revolucionaria está lista para cambiar tu experiencia de trading, infundiéndola con una precisión láser y una rentabilidad sin igual. Adéntrate en un mundo donde se rompen los límites del potencial y se maximizan los beneficios, gr
    Gann Swing Structure
    Kirill Borovskii
    5 (1)
    This indicator is based on the mathematics of the great trader W.D. Ganna. With its help, you can easily find strong levels by analyzing swings to find the optimal entry point. The indicator works on all instruments and all timeframes. The indicator is fully manual and has control buttons. All you need to do is press the NEW button, a segment will appear, which you can place on any movement, swing or even 1 candle that you want to analyze. By placing the segment, press the OK button. A grid (th
    Difícil de encontrar y escasa en frecuencia, las divergencias son uno de los escenarios comerciales más confiables. Este indicador busca y escanea las divergencias regulares y ocultas automáticamente usando su oscilador favorito. [ Guía de instalación | Guía de actualización | Solución de problemas | FAQ | Todos los productos ] Fácil de comerciar Encuentra divergencias regulares y ocultas Admite muchos osciladores bien conocidos Implementa señales comerciales basadas en rupturas Muestra n
    PZ Swing Trading
    PZ TRADING SLU
    5 (4)
    Swing Trading es el primer indicador diseñado para detectar oscilaciones en la dirección de la tendencia y posibles oscilaciones de reversión. Utiliza el enfoque de intercambio de línea de base, ampliamente descrito en la literatura comercial. El indicador estudia varios vectores de precios y tiempos para rastrear la dirección de la tendencia agregada y detecta situaciones en las que el mercado está sobrevendido o sobrecomprado y listo para corregir. [ Guía de instalación | Guía de actualización
    El sistema de comercio técnico de BB Reversal Arrows se ha desarrollado para predecir puntos inversos para tomar decisiones minoristas. El indicador analiza la situación actual del mercado y se estructura para varios criterios: la expectativa de momentos de reversión, posibles puntos de inflexión, señales de compra y venta. El indicador no contiene información en exceso, tiene una interfaz visual comprensible, lo que permite a los operadores tomar decisiones razonables. Todas las flechas pa
    Otros productos de este autor
    X Tick Chart
    Artur Zas
    4.75 (8)
    The indicator combines the features of both the Tick charts and Volume Bar charts. The mode can be selected in the indicator's settings. Tick charts measure the number of transactions per bar. To give you an example if you have a 233 tick chart, each bar measures 233 transactions per bar and a new bar is plotted after 233 transactions. You can choose any number of ticks per bar but most traders choose Fibonacci numbers (1, 2, 3, 5, 8, 13, 21, 34, 55, 89, 144, 233...). Volume bar charts are desi
    Robust median Renko style indicator for creating custom charts resembling Median Renko, Mean Renko, Turbo Renko and Better Renko candles as well as vanilla Renko with wicks plus Point-O charts. This all in one package provides all of the signals needed by day traders, scalpers, and even long-term traders. Main characteristics The indicator is an overlay on the main chart so it is possible to utilize one-click trading and order manipulation directly on the custom charts. Visual order placement
    Range Bars
    Artur Zas
    4 (4)
    The robust charting solution enables creating custom live range bar charts on the MetaTrader 4 trading platform. You can apply all of the standard and custom indicators and technical studies directly to the range bar charts and you can run EAs directly on these charts as well* (for details see text below the input summary). To create a range bar chart you need to attach the Range Bar indicator to a standard time frame (1 minute is recommended) and use the indicator's settings to generate a live
    A utility used to create custom Tick or Volume bar charts and provide real-time updates. This is an MT4 "offline" chart equivalent which is very simple to use. You can attach any MT5 compatible indicator or template to the tick chart and perform your technical analysis. Tick charts measure the number of transactions per bar. You can choose any number of ticks per bar but most traders choose Fibonacci numbers (1, 2, 3, 5, 8, 13, 21, 34, 55, 89, 144, 233...). The generator uses tick data to plot
    Ultimate Renko
    Artur Zas
    4.58 (12)
    Ultimate Renko is a full implementation of a robust Renko style charting solution for MT4. It enables creating custom live charts resembling Median Renko , Mean Renko , Turbo Renko , and Better Renko candles as well as Vanilla Renko and Renko with wicks , PointO charts, and many more. This all-in-one package provides all of the signals needed by day traders, scalpers, and even long-term traders. You can apply all of the standard and custom indicators and technical studies as well as templates to
    Professional range bar charting on a custom symbol chart accurate pricing to the tick  accurate timeline (no future date projections) very responsive charts An Expert Advisor (EA) is used to create a RangeBar custom chart and provide real-time updates. It is an MT4 "offline" range bars chart equivalent. The simplicity of use - Attach the EA to any time-based chart that you wish to see Range Bars for, input your desired parameters and you are ready to go! You can attach any MT5 compatible indicat
    Professional renko charting on a custom symbol chart accurate pricing to the tick  accurate timeline (no future date projections ) every renko variation in a single package very responsive charts optional display of live trade levels on the chart An Expert Advisor (EA) used to create custom Renko charts and provide real-time updates. This is an MT4 "offline" chart equivalent which is very simple to use. All historical renkos are constructed using real tick data from the broker's server.
    A countdown timer for the  Volume bar chart generator  and  Tick chart generator  products, which are available for download from the MQL5 Market: Tick chart generator: https://www.mql5.com/en/market/product/29215 Volume bar chart generator: https://www.mql5.com/en/market/product/47197 The counter conveniently displays the number of ticks or transactions (depending on the chart) that need to pass for a new bar to start printing. The user can set the following indicator inputs. Volume type
    FREE
    The extreme volume indicator helps identify turning points in the market by pinpointing spots of higher than average volume. Such points usually indicate the start of a trend or a turning point in the market. The indicator averages out volume readings over an extended period of time and calculates a volume threshold level. When this level is breached, it identifies the most likely trend direction using the trend of the candle that breached the volume threshold. The direction indicator (red or gr
    The trend scalper candles are used to identify short-term trends based on the readings of the MACD, RSI and ATR indicators. All indicator calculations are visualized by candle colors which are overlapped on the chart. The indicator uses gray , green and red colors to paint individual candles, which gives you a lot of useful and easy to read information. Gray candles Gray candles indicate a range bound period and the information can be used to trade breakouts. Simply mark the high and low of th
    The professional line break chart generator is used to create live line break charts (i.e. 3 line break ). The chart is plotted using MT4's offline charging facility thus making it possible to trade* directly from the chart as well as attach any of the standard or custom indicators to perform technical analysis. The line break chart can be displayed as the most widely used 3 line break chart or a custom variation such as 2 or 5 line break chart . Wicks can be displayed or hidden on the chart - t
    Range Bars for MetaTrader 5 is a unique tool for conducting technical analysis directly on the charts, as the indicator is an overlay on the main chart and range bars are calculated using real tick data. The trader can place and modify orders directly on the range bar chart (even with the use of one-click trading). Apart from range candles, the indicator also includes the most commonly used technical studies which are 3 moving averages (Simple, Exponential, Smooth, Linear-weighted, Volume-weight
    A professional line break chart which is displayed directly in the chart window thus making it possible to trade directly from the MetaTrader 5 charts. The line break chart can be displayed as the most widely used 3 line break chart or a custom variation such as 2 or 5 line break chart . Wicks can be displayed or hidden on the chart - they give a lot of additional information regarding the underlying price action. The indicator's settings include: Line break number - determines the number of lin
    Robust trading panel for use on any symbol (including RangeBars or Renko custom symbols). The tool can be placed anywhere on the chart and offers the following array of features: One-click instant order entry. Pending order entry using horizontal lines on the chart Pending order entry using keys in Entry price (E/P) and optional Stop Loss (S/L) and/or Take Profit (T/P) A choice between fixed trading volume or risk-based volume calculation based on the available account equity, entry price, and t
    Create and trade timeframes in seconds. The bar time duration is freely adjustable from 1 second and up. The chart is accurately constructed using real ticks from the broker's server. Main characteristics The indicator is an overlay on the main chart, making it possible to utilize one-click trading and on-chart order manipulation. History calculated using real tick data. Built-in technical studies: 4 moving averages (Simple, Exponential, Smooth, Linear-weighted, Volume-weighted using tick or rea
    The Trade Tracker Library is used to automatically detect and display trade levels on custom charts. It is an especially useful add-on for EAs that trade on custom charts in MT5. With the use of this library, the EA users can see trades as they are placed via the EA (Entry, SL & TP levels) in real-time. The header file and two examples of EA skeleton files are attached in the comments section (first comment). The library will automatically detect the tradable symbol for the following custom
    Filtro:
    Zentrader2015
    1470
    Zentrader2015 2018.05.29 11:17 
     

    El usuario no ha dejado ningún comentario para su valoración

    cvdestyfx
    2702
    cvdestyfx 2018.03.28 20:28 
     

    El usuario no ha dejado ningún comentario para su valoración

    Artur Zas
    22672
    Respuesta del desarrollador Artur Zas 2021.07.12 11:04
    Thank you for your feedback. The "lag" of the indicator can be tweaked using the inputs. The defaults work best on 1H (forex pairs) and 15min for indices such as the DAX.
    Yvonne
    1044
    Yvonne 2017.06.15 11:35 
     

    El usuario no ha dejado ningún comentario para su valoración

    Respuesta al comentario
    Versión 1.3 2021.07.11
    Updated Buy/Sell signal buffers for use with universal EAs
    Versión 1.2 2019.03.30
    Code optimization,
    Added alerts (Push notification, Email notification, Alert box notification),
    Added "buy/sell" signal indication,
    Added Trending market indication
    Versión 1.1 2016.05.25
    Indicator parameters:

    period - the number of candles that are used for calculation of the CMI value
    MApriod - the period of the moving average (blue line)
    usedOnOfflneCharts - turn on/off correct operation on offline charts such as tick charts, range bars, renko, median renko, etc.