• Información general
  • Comentarios (11)
  • Discusión (23)
  • Novedades

Multi oscillator divergence MT5

4.67

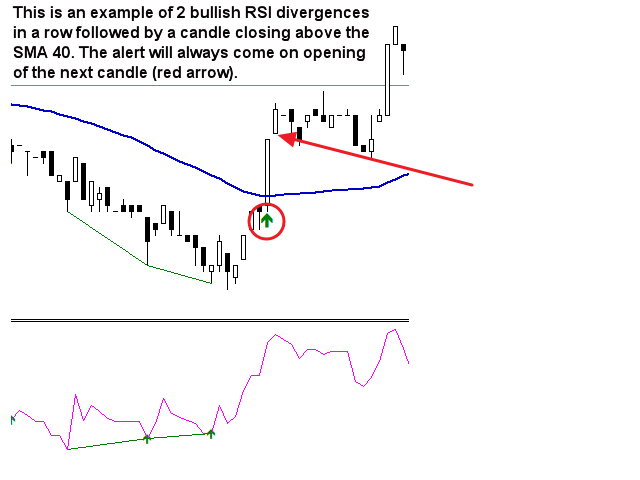
El indicador identifica cuando ocurre una divergencia entre el precio y un oscilador / indicador. Identifica divergencias tanto regulares como ocultas. Tiene una opción de filtro RSI que permite filtrar solo las configuraciones más fuertes. El indicador también ofrece opciones para esperar una ruptura del canal de Donchian o que el precio cruce una media móvil (ver captura de pantalla n. ° 3)   para confirmar la divergencia antes de señalar la oportunidad comercial. Combinado con sus propias reglas y técnicas, este indicador le permitirá crear (o mejorar) su propio sistema poderoso.

Características

  • Puede detectar divergencias para los siguientes osciladores / indicadores: MACD, OsMA, estocásticos, RSI, CCI, RVI, Awesome, ADX, índice compuesto, ATR, OBV, MFI y Momentum. Solo se puede seleccionar un oscilador / indicador.
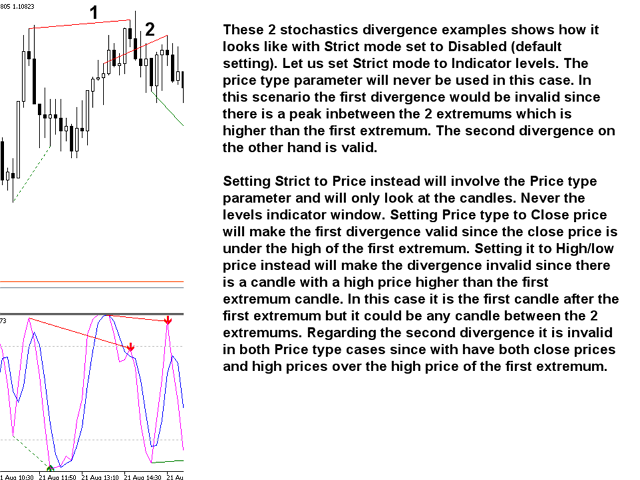
  • Dibuja líneas continuas para divergencias regulares / clásicas (reversión potencial) y líneas discontinuas para divergencias ocultas (continuación de tendencia). Las líneas se dibujan tanto en el gráfico como en la ventana del indicador.
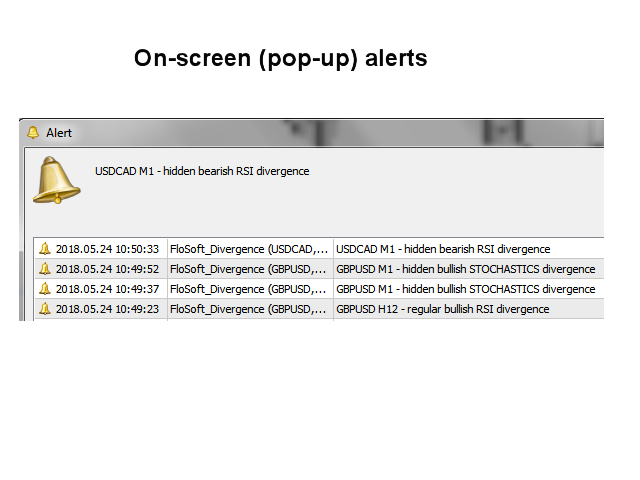
  • Envía una alerta cuando una divergencia o una ruptura / cruce   ha sido detectado. Se admiten todos los tipos de alertas nativas de Metatrader.
  • Contiene 1 búfer que un desarrollador puede usar con la función iCustom () en un Asesor Experto (EA). El índice del búfer es 4 y el desplazamiento es siempre 0. El ejemplo de código y los valores de retorno del búfer se pueden encontrar al final del   blog .

Parámetros de entrada

Encuentre la descripción y explicación de los parámetros de entrada aquí .


Comentarios 11
Johan Julien Aubry
856
Johan Julien Aubry 2023.02.12 11:38 
 

Powerfull indicator, very cheap and with a lot of possibilities to customise settings. Can be used for entry points or to confirm other entries. Well documented and EA compatible. Jan is really helpful and very reactive. I totally recommend this product!

Edensgarden
20
Edensgarden 2022.01.17 14:27 
 

It's a very good divergence indicator; it does what is promised by Jan. I have incorporated this tool into my trading habits. Also great support from Jan.

kamz1419
149
kamz1419 2021.07.16 18:14 
 

Great product, works as exactly as required and the alerts are timely and you change and choose from a range of settings. The support Jan offers os excellent and he replies very fast with the required solutions. Thanks

Productos recomendados
This indicator scans for you up to 15 trading instruments and up to 21 time frames for occurrences of the high probability reversal patterns: Double Tops/Bottoms with fake breakouts . What this indicator detects: This indicator detects a special form of Double Tops and Bottoms, so called Double Tops/Bottoms with fake breakouts . For double tops with fake breakouts the highest price of the right shoulder must be higher than the left shoulder. For double bottoms with fake breakouts the lowest pric
The  Basic Candlestick Patterns  is a Multi-Symbol and Multi-Timeframe scanner for identifying candlestick patterns. it displays your chosen patterns on the chart and helps you make trade decisions. The indicator has simple settings for coloring and alerts. You can also activate or deactivate the desired patterns, symbols and timeframes. Bullish Patterns Hammer Inverse hammer Bullish engulfing Morning star Three white soldiers Bearish Patterns Hanging man Shooting star Bearish engulfing Ev
Trend Side - un indicador técnico para determinar la tendencia. Es un conjunto de varias estrategias comerciales completas. El indicador utiliza un sistema avanzado de filtrado de tendencias, tiene un panel estadístico, calcula los niveles de entrada y salida, y calcula el nivel de Trailing Stop dinámico. Apto para cualquier tipo de símbolos, nunca redibuja sus señales y resultados. Una herramienta integral para el comercio de tendencias profesional. El conjunto del indicador Trend Side tambi
En primer lugar, vale la pena enfatizar que este Indicador de Trading no repinta, no redibuja y no se retrasa, lo que lo hace ideal tanto para el trading manual como para el automatizado. El Analista Atómico es un Indicador de Acción del Precio PA que utiliza la fuerza y el impulso del precio para encontrar una mejor ventaja en el mercado. Equipado con filtros avanzados que ayudan a eliminar ruidos y señales falsas, y aumentan el potencial de trading. Utilizando múltiples capas de indicadores
Note : i only sell this EA on MQL5, any other sellers is fake. Orbit Rage Final, a cutting-edge trading strategy meticulously designed around the bull/bear candle approach and divergence analysis. This powerful tool is engineered to empower you to shape the life you desire. To embark on this transformative journey, simply download and seamlessly integrate it into your MetaTrader 4 platform by placing it in the experts advisors folder. Orbit Rage Final revolutionizes trading by offering a risk-f
KT Renko Patterns MT5
KEENBASE SOFTWARE SOLUTIONS
KT Renko Patterns scans the Renko chart brick by brick to find some famous chart patterns that are frequently used by traders across the various financial markets. Compared to the time-based charts, patterns based trading is easier and more evident on Renko charts due to their uncluttered appearance. KT Renko Patterns features multiple Renko patterns, and many of these patterns are extensively explained in the book titled Profitable Trading with Renko Charts by Prashant Shah. A 100% automate
Elevate Your Trading Experience with Wamek Trend Consult!   Unlock the power of precise market entry with our advanced trading tool designed to identify early and continuation trends. Wamek Trend Consult empowers traders to enter the market at the perfect moment, utilizing potent filters that reduce fake signals, enhancing trade accuracy, and ultimately increasing profitability.   Key Features: 1. Accurate Trend Identification: The Trend Consult indicator employs advanced algorithms and unparall
Automated Trendlines MT5
Georgios Kalomoiropoulos
Las líneas de tendencia son la herramienta más esencial del análisis técnico en el comercio de divisas. Desafortunadamente, la mayoría de los comerciantes no los dibujan correctamente. El indicador de líneas de tendencia automatizadas es una herramienta profesional para comerciantes serios que lo ayuda a visualizar el movimiento de tendencia de los mercados. Hay dos tipos de Trendlines Bullish Trendlines y Bearish Trendlines. En la tendencia alcista, la línea de tendencia de Forex se dib
Wave Trend MT5
Diego Arribas Lopez
Versión MT4   Wave Trend   MT5 Wave Trend es un oscilador que ayuda a identificar de manera extremadamente precisa las reversiones del mercado. El oscilador está por encima del nivel de sobrecompra y un cruce hacia abajo de la MA rápida a la lenta generalmente indica una buena señal de VENTA. Si los osciladores están por debajo del nivel de sobreventa y la media móvil rápida cruza la media móvil más lenta, por lo general indica una buena señal de COMPRA. El indicador Wave Trend también se puede
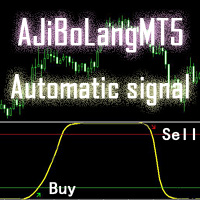
Este indicador AJiBoLang es adecuado para todos los ciclos de la señal, muy adecuado para señales a corto plazo, la precisión de la señal es buena. Solo mire las flechas en la tabla y haga un solo pedido: la flecha verde es el sencillo Comprar y la flecha roja es el único Vender. Después de realizar la orden de compra, si la línea amarilla sube al nivel superior y recorre una cierta distancia, entonces puede vender la orden de compra. Después de hacer la venta individual, si la línea amari
Liquidity Oscillator
Paolo Scopazzo
5 (1)
A powerful oscillator that provide Buy and Sell signals by calculating the investor liquidity. The more liquidity the more buy possibilities. The less liquidity the more sell possibilities. Please download the demo and run a backtest! HOW IT WORKS: The oscillator will put buy and sell arrow on the chart in runtime only . Top value is 95 to 100 -> Investors are ready to buy and you should follow. Bottom value is 5 to 0 -> Investors are ready to sell and you should follow. Alert + sound will app
How to use Pair Trading Station Pair Trading Station is recommended for H1 time frame and you can use it for any currency pairs. To generate buy and sell signal, follow few steps below to apply Pair Trading Station to your MetaTrader terminal. When you load Pair Trading Station on your chart, Pair Trading station will assess available historical data in your MetaTrader platforms for each currency pair. On your chart, the amount of historical data available will be displayed for each currency pai
KT Momentum Arrows MT5
KEENBASE SOFTWARE SOLUTIONS
5 (3)
KT Momentum Arrows Indicator is based on a momentary breakout which is calculated using the bands deviation and emerging volatility in a certain direction. A buy signal is generated when the price closes above the upper band and a sell signal is generated when the price closes below the lower band. A magnitude coefficient is used as the input which affects the band deviation and volatility at the same time. The coefficient value should be carefully selected and analyzed based on the instrument a
Fib Auto Trendline
Nhlanhla Brilliant Mashavha
INTRODUCTION The  Fib Autotrendline   is a basic tool that analysts use to find out when a security's trend is reversing. By determining the   support and resistance areas , it helps to identify significant changes in price while filtering out short-term fluctuations, thus eliminating the noise of everyday market conditions. It is an excellent tool for any trader who follows indicators that use   swing highs  and   swing lows . How to Use the fib Auto Trendline Indicator The Fib Auto Trendline
PipFinite Exit EDGE MT5
Karlo Wilson Vendiola
4.89 (35)
Did You Have A Profitable Trade But Suddenly Reversed? In a solid strategy, exiting a trade is equally important as entering. Exit EDGE helps maximize your current trade profit and avoid turning winning trades to losers. Never Miss An Exit Signal Again Monitor all pairs and timeframes in just 1 chart www.mql5.com/en/blogs/post/726558 How To Trade You can close your open trades as soon as you receive a signal Close your Buy orders if you receive an Exit Buy Signal. Close your Sell orde
Golden section price action indicator - is a trend-scalping complete system with enter and exit points. Indicator is based on most powerfull price action japan patterns that are filtered by volume, volatility, market phase. Pattern is not a simple combinations of candles. Patterns must have "weight" to move market in right direction. "Weight" - is the summary of pattern's volume, the size of pattern candles according to last average volatility and ofcourse pattern must appear in correct market p
Inventory Retracement Trade it is designed based on one of the most popular tradingview indicator.  This is mostly combined with other popurlar trend indicator to confirm the strength of the movement. Definition Inventory Retracement Trade is quickly becoming one of the most popular ways to identify where short-term counter trend institutional inventory has subsided and when it’s time to re-enter into a trade’s original trend direction.
Sensey
Yaroslav Varankin
Sensey Candlestick Pattern Recognition Indicator Sensey is an advanced tool capable of accurately identifying candlestick patterns. Not only does it recognize patterns, but it also detects price highs and lows within a specified time frame. Sensey operates seamlessly across multiple timeframes and is compatible with all currency pairs, futures, and commodities. Unlike some indicators, Sensey does not repaint historical data, ensuring reliable analysis even in cryptocurrency markets. You can wit
Este indicador le mostrará los valores TP y SL (en esa moneda) que ya configuró para cada pedido en los gráficos (cerrados a la línea de transacción/pedido) que lo ayudarán mucho a estimar sus ganancias y pérdidas para cada pedido. Y también te muestra los valores de PIP. el formato que se muestra es "Valores de moneda de nuestros valores de ganancias o pérdidas / PIP". El valor TP se mostrará en color verde y el valor SL se mostrará en color rojo. Para cualquier pregunta o más información, n
Noize Absorption Index - is the manual trading system that measures the difference of pressure between bears forces and bulls forces. Green line - is a noize free index that showing curent situation. Zero value of index shows totally choppy/flat market.Values above zero level shows how powerfull bullish wave is and values below zero measures bearish forces.Up arrow appears on bearish market when it's ready to reverse, dn arrow appears on weak bullish market, as a result of reverse expectation.
Candle Pattern Finder MT5
Pavel Zamoshnikov
4.33 (6)
This indicator searches for candlestick patterns. Its operation principle is based on Candlestick Charting Explained: Timeless Techniques for Trading Stocks and Futures by Gregory L. Morris. If a pattern is detected, the indicator displays a message at a bar closure. If you trade using the MetaTrader 4 terminal, then you can download the full analogue of the " Candle Pattern Finder for MT4 " indicator It recognizes the following patterns: Bullish/Bearish (possible settings in brackets) : Hamme
This is the famous Sunflower indicator for Metatrader5. This indicator marks possible tops and bottoms on price charts. The indicator identifies tops and bottoms in the asset's price history, keep in mind that the current sunflower of the last candle repaints, as it is not possible to identify a top until the market reverses and it is also not possible to identify a bottom without the market stop falling and start rising. If you are looking for a professional programmer for Metatrader5, please
DYJ Super Trend Wave es un sistema de negociación de picos y valles altamente preciso. Este indicador busca los puntos más altos y más bajos de la línea de velas al entrar y salir del mercado. El precio de entrada está cerca del punto más alto o más bajo. El tipo de notificación de la señal se ha agregado a dyj supertrend. Cuando se genera una señal multi-espacial, Se pueden utilizar los siguientes tipos de señales de notificación: Alert mailSend, MobilePush. Input InpSignalPeriod = 10 Ba
Indicator and Expert Adviser  EA Available in the comments section of this product. Download with Indicator must have indicator installed for EA to work. Mt5 indicator alerts for bollinger band and envelope extremes occurring at the same time. Buy signal alerts occur when A bullish candle has formed below both the lower bollinger band and the lower envelope  Bar must open and close below both these indicators. Sell signal occur when A bear bar is formed above the upper bollinger band and upp
Oscillator trading signals - это динамический индикатор, определяющий состояние к продолжению тенденции роста или падению цены торгового инструмента и отсечению зон с нежелательной торговлей. Индикатор состоит из 2 линий осцилляторов. Медленная и быстрая сигнальная линия.  Шкала отображения перевернутая. Зоны вблизи 0 свидетельствуют о тенденции роста цены валютной пары. Зоны -100 свидетельствуют о падении цены валютной пары. На основном графике в виде стрелок отображается потенциально выгодные
Dot reversal
Vitalii Zakharuk
The Dot reversal indicator was created on the basis of the original indicators of the search for extremes, the indicator is well suited for detecting a reversal or a large sharp jerk to one side, thanks to it you will know when this will happen, it will notify you with the appearance of a blue point for buying red for selling It uses in its basis the process of identifying the rate of change in price growth and allows you to find points of entry and exit from the market. a fundamental techn
¡El nivel Premium es un indicador único con más del 80% de precisión de predicciones correctas! ¡Este indicador ha sido probado por los mejores especialistas en comercio durante más de dos meses! ¡El indicador del autor no lo encontrarás en ningún otro lugar! ¡A partir de las capturas de pantalla, puede ver por sí mismo la precisión de esta herramienta! 1 es ideal para operar con opciones binarias con un tiempo de vencimiento de 1 vela. 2 funciona en todos los pares de divisas, accion
DYJ TRADINGVIEW es un sistema de calificación de indicadores múltiples, que utiliza las señales de calificación y las herramientas de análisis para encontrar oportunidades de entrada en los mercados globales. DYJ TRADINGVIEW tiene 10 indicadores incorporados para el análisis de mercado. Muchos comerciantes utilizan el análisis basado en indicadores para ayudarlos a tomar decisiones sobre qué operaciones realizar y dónde ingresar y salir de ellas. Utilizamos varios tipos diferentes que pue
Fibonacci and RSI Demo version MQL5
Carlos Daniel Vazquez Rosas
4 (1)
Fibonacci and RSI. Demo versión only works with GBPUSD. For full version, please, visit visit https://www.mql5.com/en/market/product/52101 The indicator is a combination of the Fibonacci and RSI indicators. Every time the price touches one of the fibonacci levels and the rsi condition is met, an audible alert and a text alert are generated. Parameters number_of_candles : It is the number of candles that will be calculated. If you put 100, the indicator will give you the maximum and min
FREE
Your Trend Friend
Luigi Nunes Labigalini
The trend is your friend! Look at the color of the indicator and trade on that direction. It does not  repaint. After each candle is closed, that's the color of the trend. You can focus on shorter faster trends or major trends, just test what's most suitable for the symbol and timeframe you trade. Simply change the "Length" parameter and the indicator will automatically adapt. You can also change the color, thickness and style of the lines. Download and give it a try! There are big movements
Los compradores de este producto también adquieren
Primero que todo, vale la pena enfatizar que este Sistema de Trading es un Indicador No Repintado, No Redibujado y No Retrasado, lo que lo hace ideal tanto para el trading manual como para el automatizado. El "Sistema de Trading Inteligente MT5" es una solución completa de trading diseñada para traders nuevos y experimentados. Combina más de 10 indicadores premium y presenta más de 7 estrategias de trading robustas, lo que lo convierte en una opción versátil para diversas condiciones del merca
Quantum Trend Sniper
Bogdan Ion Puscasu
5 (36)
Introduciendo       Indicador Quantum Trend Sniper   , el innovador indicador MQL5 que está transformando la forma en que identificas y negocias los cambios de tendencia. Desarrollado por un equipo de comerciantes experimentados con experiencia comercial de más de 13 años,       Indicador de francotirador de tendencia cuántica       está diseñado para impulsar su viaje comercial a nuevas alturas con su forma innovadora de identificar cambios de tendencia con una precisión extremadamente alta.
Advanced Supply Demand MT5
Bernhard Schweigert
4.53 (15)
¡Actualmente con 33% de descuento! ¡La mejor solución para cualquier tráder principiante o experto! Este indicador es una herramienta comercial única, de alta calidad y asequible, porque incorpora una serie de características patentadas y una nueva fórmula. Con esta actualización, podrá mostrar zonas de doble marco temporal. No solo podrá mostrar un marco temporal más alto, sino también mostrar ambos, el marco temporal del gráfico MÁS el marco temporal más alto: MOSTRANDO ZONAS ANIDADAS. A todos
RelicusRoad Pro MT5
Relicus LLC
4.81 (21)
Ahora $ 147 (aumentando a $ 499 después de algunas actualizaciones) - Cuentas ilimitadas (PC o Mac) Manual de usuario de RelicusRoad + Videos de capacitación + Acceso al grupo privado de Discord + Estado VIP UNA NUEVA MANERA DE VER EL MERCADO RelicusRoad es el indicador comercial más poderoso del mundo para divisas, futuros, criptomonedas, acciones e índices, y brinda a los comerciantes toda la información y las herramientas que necesitan para mantenerse rentables. Brindamos análisis téc
FX Volume MT5
Daniel Stein
4.94 (17)
Obtenga su actualización diaria del mercado con detalles y capturas de pantalla a través de nuestro Morning Briefing aquí en mql5 y en Telegram ! FX Volume es el PRIMER y ÚNICO indicador de volumen que proporciona una visión REAL del sentimiento del mercado desde el punto de vista de un bróker. Proporciona una visión impresionante de cómo los participantes institucionales del mercado, como los brokers, están posicionados en el mercado Forex, mucho más rápido que los informes COT. Ver esta info
FX Power MT5 NG
Daniel Stein
5 (4)
Obtenga su actualización diaria del mercado con detalles y capturas de pantalla a través de nuestro Morning Briefing aquí en mql5 y en Telegram ! FX Power MT5 NG es la nueva generación de nuestro popular medidor de fuerza de divisas, FX Power. ¿Y qué ofrece este medidor de fuerza de nueva generación? Todo lo que le encantaba del FX Power original PLUS Análisis de fuerza de ORO/XAU Resultados de cálculo aún más precisos Períodos de análisis configurables individualmente Límite de cálculo persona
XQ Indicator MetaTrader 5
Marzena Maria Szmit
5 (1)
Step into the realm of Forex trading with confidence and precision using XQ, a cutting-edge Forex indicator designed to elevate your trading game to unprecedented heights. Whether you're a seasoned trader or just stepping into the world of currency exchange, XQ Forex Indicator empowers you with the insights and signals needed to make informed trading decisions. The signal conditions are a combination of three indicators, and XQ Forex Indicator only display  medium and long-term trends . The ind
Este es un genial indicador para MT5 que ofrece señales precisas para entrar en una transacción sin redibujar. Se puede aplicar a cualquier activo financiero: fórex, criptomonedas, metales, acciones, índices. Nos dará valoraciones bastante precisas y nos dirá cuándo es mejor abrir y cerra una transacción. Eche un vistazo  al vídeo  (6:22), ¡contiene un ejemplo de procesamiento de una sola señal que ha amortizado el indicador! La mayoría de los tráders mejoran sus resultados comerciales durante l
Introduciendo       Quantum Breakout PRO   , el innovador indicador MQL5 que está transformando la forma en que comercia con Breakout Zones. Desarrollado por un equipo de comerciantes experimentados con experiencia comercial de más de 13 años,       Desglose cuántico PRO       está diseñado para impulsar su viaje comercial a nuevas alturas con su innovadora y dinámica estrategia de zona de ruptura. El indicador de ruptura cuántica le dará flechas de señal en las zonas de ruptura con 5 zonas
Bill Williams Advanced
Siarhei Vashchylka
5 (3)
Bill Williams Advanced is designed for automatic chart analysis using Bill Williams' "Profitunity" system. The indicator analyzes four timeframes at once. Manual (Be sure to read before purchasing) Advantages 1. Automatically analyzes the chart using the "Profitunity" system of Bill Williams. The found signals are placed in a table in the corner of the screen. 2. Equipped with a trend filter based on the Alligator indicator. Most of the system signals are recommended to be used only accordi
TPSpro TRENDPRO  - is a trend indicator that automatically analyzes the market and provides information about the trend and each of its changes, as well as giving signals for entering trades without redrawing! The indicator uses each candle, analyzing them separately. referring to different impulses - up or down impulse. Exact entry points into transactions for currencies, crypto, metals, stocks, indices!  -  Version MT4                  DETAILED DESCRIPTION        /       TRADING SETUPS       
Owl Smart Levels MT5
Sergey Ermolov
4.47 (36)
Versión MT4  |  FAQ El Indicador Owl Smart Levels es un sistema comercial completo dentro de un indicador que incluye herramientas de análisis de mercado tan populares como los fractales avanzados de Bill Williams , Valable ZigZag que construye la estructura de onda correcta del mercado y los niveles de Fibonacci que marcan los niveles exactos de entrada. en el mercado y lugares para tomar ganancias. Descripción detallada de la estrategia Instrucciones para trabajar con el indicador Asesor de c
TrendDecoder Premium MT5
Christophe, Pa Trouillas
5 (1)
Identifique los rangos y los próximos movimientos probables  |  Obtenga las señales más tempranas y la fuerza de las Tendencias   |  Obtener salidas claras antes de reversión   |  Detecte los niveles de Fibo que el precio pondrá a prueba Indicador no repintado y no retardado - ideal para la trading manual y automatizada - adecuado para todos los activos y todas las unidades temporales 69$   para el lanzamiento - luego de nuevo a >>   $ 149 Después de la compra,   póngase en contacto con mi canal
Golden Gate Algo MT5
James David Lane
4 (6)
¡40% DE DESCUENTO PARA NAVIDAD! ¡AUMENTO DE PRECIO A $250 EL 1 DE ENERO! Presentamos GoldenGate Entries: ¡Una Solución de Trading de Vanguardia! Descubre un enfoque revolucionario para el trading con GoldenGate Entries (GGE), un indicador avanzado diseñado para elevar tu experiencia de trading. GGE proporciona un conjunto completo de características para capacitar a los usuarios con precisión y confianza en sus decisiones comerciales. Pares: Cualquiera (FX - Materias primas - Acciones - A
ICT, SMC, SMART MONEY CONCEPTS, SMART MONEY, Smart Money Concept, Support and Resistance, Trend Analysis, Price Action, Market Structure, Order Blocks, BOS/CHoCH,   Breaker Blocks ,  Momentum Shift,   Supply&Demand Zone/Order Blocks , Strong Imbalance,   HH/LL/HL/LH,    Fair Value Gap, FVG,  Premium  &   Discount   Zones, Fibonacci Retracement, OTE, Buy Side Liquidity, Sell Side Liquidity, BSL/SSL Taken, Equal Highs & Lows, MTF Dashboard, Multiple Time Frame, BigBar, HTF OB, HTF Market Structure
Gartley Hunter MT5
Siarhei Vashchylka
5 (13)
Gartley Hunter - An indicator for searching for harmonic patterns (Gartley patterns) and their projections. The indicator is equipped with a system of alerts and push notifications. Manual (Be sure to read before purchasing) | Version for MT4 Advantages 1. 12 harmonic patterns: 7 classical and 5 exotic. New patterns will be added as the indicator develops. 2. Constant automatic search for harmonic patterns. The indicator is capable of finding from the smallest to the largest patterns. 3. Autom
Gartley Hunter Multi
Siarhei Vashchylka
5 (5)
Gartley Hunter Multi - An indicator for searching for harmonic patterns simultaneously on dozens of trading instruments and on all classic timeframes: (m1, m5, m15, m30, H1, H4, D1, Wk, Mn). Manual (Be sure to read before purchasing) | Version for MT4 Advantages 1. Patterns: Gartley, Butterfly, Shark, Crab. Bat, Alternate Bat, Deep Crab, Cypher 2. Simultaneous search for patterns on dozens of trading instruments and on all classic timeframes 3. Search for patterns of all possible sizes. Fr
A key element in trading is zones or levels from which decisions to buy or sell a trading instrument are made. Despite attempts by major players to conceal their presence in the market, they inevitably leave traces. Our task was to learn how to identify these traces and interpret them correctly. Reversal First Impulse levels (RFI)   -  Version MT4                  INSTRUCTIONS                 RUS                 ENG                         R ecommended to use with an indicator   -  TREND PRO  
IX Power MT5
Daniel Stein
5 (1)
IX Power   lleva por fin la insuperable precisión de FX Power a los símbolos que no son de Forex. Determina con exactitud la intensidad de las tendencias a corto, medio y largo plazo de tus índices, acciones, materias primas, ETF e incluso criptodivisas favoritas. Puede   analizar todo lo   que su terminal le ofrece. Pruébalo y experimenta cómo   tu timing mejora significativamente   a la hora de operar. Características principales de IX Power Resultados de cálculo 100% precisos y sin rep
Was: $249  Now: $99   Market Profile defines a number of day types that can help the trader to determine market behaviour. A key feature is the Value Area, representing the range of price action where 70% of trading took place. Understanding the Value Area can give traders valuable insight into market direction and establish the higher odds trade. It is an excellent addition to any system you may be using. Inspired by Jim Dalton’s book “Mind Over Markets”, this indicator is designed to suit the
The Volume by Price Indicator for MetaTrader 5 features Volume Profile and Market Profile TPO (Time Price Opportunity). Get valuable insights out of currencies, equities and commodities data. Gain an edge trading financial markets. Volume and TPO histogram bar and line charts. Volume Footprint charts. TPO letter and block marker charts including split structures. Versatile segmentation and compositing methods. Static, dynamic and flexible ranges with relative and/or absolute visualizations. Lay
Blahtech Supply Demand MT5
Blahtech Limited
4.57 (14)
Was: $299  Now: $99   Supply Demand uses previous price action to identify potential imbalances between buyers and sellers. The key is to identify the better odds zones, not just the untouched ones. Blahtech Supply Demand indicator delivers functionality previously unavailable on any trading platform. This 4-in-1 indicator not only highlights the higher probability zones using a multi-criteria strength engine, but also combines it with multi-timeframe trend analysis, previously confirmed swings
Antes que nada, vale la pena enfatizar que este Sistema de Trading es un Indicador No Repintado, No Redibujado y sin Retardos, lo que lo hace ideal para el trading profesional. El "Sistema de Trading de Soporte y Resistencia Inteligente" es un indicador avanzado diseñado para traders nuevos y experimentados. Empodera a los traders con precisión y confianza en el mercado de divisas. Este sistema integral combina más de 7 estrategias, 10 indicadores y varios enfoques de trading, incluyendo estr
Professional Scalping Tool on Deriv Attention! The indicator will be sold in limited quantities!!! Description: This trading indicator is designed for professional traders focused on scalping. Designed with the market in mind, it provides highly accurate spike trading signals. It works on the M1 timeframe and supports the following symbols: Boom 300 Index, Boom 500 Index, Boom 1000 Index, Crash 300 Index, Crash 500 Index, Crash 1000 Index. Functional Features: - Direction: - Trading is ca
TPA True Price Action indicator reveals the true price action of the market makers through 100% non-repainting signals strictly at the close of a candle! TPA shows entries and re-entries, every time the bulls are definitely stronger than the bears and vice versa. Not to confuse with red/green candles. The shift of power gets confirmed at the earliest stage and is ONE exit strategy of several. There are available now two free parts of the TPA User Guide for our customers. The first "The Basics"
Real Trend Zigzag PRO   shows the real trend of a market, u nlike the default Zigzag indicator. It calculates the trend in real time and shows green lines for upwards trends, red lines for downward trends and blue lines for no trends.  Regarding the old slogan "the trend is your friend" it helps you to decide if should open a buy or sell position. The PRO version is a multi timeframe zigzag (MTF). Means, it shows the trend of the current timeframe as well as the trend of a higher or lower time.
Legacy of Gann for MT5
Pavel Zamoshnikov
5 (4)
The indicator very accurately determines the levels of the possible end of the trend and profit fixing. The method of determining levels is based on the ideas of W.D.Gann, using an algorithm developed by his follower Kirill Borovsky. Extremely high reliability of reaching levels (according to K. Borovsky  - 80-90%) Indispensable for any trading strategy – every trader needs to determine the exit point from the market! Precisely determines targets on any timeframes and any instruments (forex, met
Trading Chaos Chart
Gennadiy Stanilevych
5 (1)
Las principales funciones del indicador es determinar y marcar las siguientes señales en los gráficos basándose en la estrategia “Caos de Trading: Segunda Edición”: La barra divergente (BDB) alcista y bajista con angulación (incluyendo las barras “sentadas” SQUAT). Las barras en la zona roja y verde de acuerdo con el color del histograma del indicador Awesome Oscillator. Las barras “sentadas” Squat en el gráfico independientemente del color del histograma del indicador Awesome Oscillator. Los ni
Ultimate Supply Demand MT5
Ramon Sobrevals Arce
5 (4)
After working during many months, with the help of Neural Networks, we have perfected the ultimate tool you are going to need for identifying key price levels (Supports and Resistances) and Supply and Demand zones. Perfectly suitable to trigger your trades, set up your future actions, decide your Take Profit and Stop Loss levels, and confirm the market direction. Price will always move between those levels, bouncing or breaking; from one zone to another, all the remaining movements are just mark
VJ Sniper MT5
Vijayaratna Kumar Boda
VJ Sniper - MT5 Buy / Sell Indicator:   This Indicator is as simple as Buy in Up Trend & Sell in Down Trend.                                                           There are Support / Resistance Graphic levels for choosing the best Entries. Background:   Any in-built indicator of MT5 does not work as stand alone such as Stochastic, CCI or DeMarker etc. But combination of them with trend projection work & give the best results for Trading entries. So this Indicator is blended to give the best
Otros productos de este autor
El indicador identifica cuando ocurre una divergencia entre el precio y un indicador u oscilador. Identifica divergencias tanto regulares como ocultas. Combinado con sus propias reglas y técnicas, este indicador le permitirá crear (o mejorar) su propio sistema poderoso. Características Puede detectar divergencias para los siguientes osciladores / indicadores:       MACD, OsMA, estocásticos, RSI, CCI, RVI, Awesome, ADX, ATR, OBV, índice compuesto, MFI y Momentum. Solo se puede seleccionar un os
FREE
Este indicador de panel de divergencia de múltiples marcos de tiempo y múltiples símbolos envía una alerta cuando se han identificado una o dos divergencias diferentes en varios marcos de tiempo y no en divergencias individuales. Se puede utilizar con todos los marcos de tiempo de M1 a MN. Se pueden mostrar un máximo de 9 períodos de tiempo en el panel de control al mismo tiempo. Es posible habilitar el filtro de tendencia de bandas de media móvil, RSI o Bollinger para filtrar solo las configura
Este asesor experto (EA) de promedio de costos coloca operaciones adicionales en la misma dirección que la orden original (abierta manualmente) cuando el precio va en su contra. Se puede utilizar como un sistema de cuadrícula o como un sistema de martingala puro (aumento exponencial del tamaño del lote) o martingala suavizada (por ejemplo, aumento lineal del tamaño del lote). Debido al riesgo involucrado, este EA es más adecuado para traders de nivel intermedio a avanzado que saben muy bien cómo
Este indicador de marco de tiempo múltiple e indicador de símbolo múltiple identifica patrones dobles superior / inferior, cabeza y hombro, banderín / triángulo y bandera. También es posible configurar alertas solo cuando se ha producido una ruptura del escote / triángulo / asta de bandera (ruptura del escote = señal confirmada para arriba / abajo y cabeza y hombros).       El indicador también se puede utilizar en modo de gráfico único. Lea más sobre esta opción en el producto   blog . Combinad
Este indicador de zona de oferta y demanda dibuja las zonas en el gráfico y envía alertas cuando el precio ha alcanzado o roto una zona. También es posible utilizarlo para recibir alertas sobre dobles techos/fondos regulares en lugar de zonas. Es posible usar filtros RSI, de volumen y de divergencia para filtrar solo las configuraciones más fuertes. Combinado con sus propias reglas y técnicas, este indicador le permitirá crear (o mejorar) su propio sistema poderoso. Este indicador es para el com
Este indicador de tendencia de múltiples marcos de tiempo y múltiples símbolos envía una alerta cuando se ha identificado una tendencia fuerte o un cambio de tendencia. Puede hacerlo seleccionando construir el tablero usando Promedio móvil (simple o doble (cruce MA)), RSI, bandas de Bollinger, ADX, índice compuesto (Constance M. Brown), Awesome (Bill Williams), MACD (línea de señal ), Heiken Ashi suavizado, media móvil de Hull, cruces estocásticos, Gann HiLo Activator y Traders Dynamic Index. Se
Este indicador de marco de tiempo múltiple y símbolo múltiple puede identificar las siguientes 5 cruces: cuando una media móvil rápida cruza una línea de media móvil lenta. cuando el precio ha alcanzado una única media móvil (cerrado por encima / por debajo o simplemente rebotando). cuando ha aparecido una formación de media móvil triple (las 3 MA: s en alineación consecutiva) cuando la línea principal del MACD cruza la línea de señal. cuando la línea de señal cruza la línea MACD cero (0). Combi
Este indicador de marco de tiempo múltiple y símbolo múltiple identifica doble arriba / abajo, cabeza       Y       hombros, banderines / triángulos y patrones de bandera. También es posible configurar alertas solo cuando se ha producido una ruptura del escote / triángulo / asta de bandera (ruptura del escote = señal confirmada para arriba / abajo y cabeza y hombros).   El indicador también se puede utilizar en modo de gráfico único. Lea más sobre esta opción en el producto   blog .       Combin
Este indicador de panel de zona de oferta y demanda de múltiples períodos de tiempo y múltiples símbolos envía alertas cuando el precio ha alcanzado una zona de oferta / demanda. También es posible usarlo para recibir alertas sobre dobles techos / fondos regulares en lugar de zonas. Se puede utilizar con todos los marcos de tiempo de M1 a MN. Es posible utilizar filtros de RSI, divergencia (MACD, OsMA, RSI o Awesome) y patrones de velas (pin bar, envolvente, pinzas y estrella matutina / nocturna
Este Asesor Experto identifica cuando ocurre una divergencia entre el precio y un oscilador / indicador. Identifica divergencias tanto regulares / clásicas (inversión de tendencia) como ocultas (continuación de tendencia). Tiene opciones de filtro RSI, Bollinger, estocástico, promedio móvil y ADX que hace posible filtrar solo las configuraciones más fuertes. Características Puede detectar divergencias para los siguientes osciladores / indicadores: MACD, OsMA (Media móvil del oscilador), estocá
FREE
Además de encontrar formaciones de huelga de tres líneas alcistas y bajistas, este indicador de múltiples símbolos y marcos de tiempo mutli también puede buscar los siguientes patrones de velas (consulte las capturas de pantalla para obtener una explicación de los patrones): Tres soldados blancos (inversión> patrón de continuación) Tres cuervos negros (inversión> patrón de continuación) Las formaciones no aparecen con mucha frecuencia en períodos de tiempo más altos cuando la opción estricta en
Este indicador de panel de divergencia de múltiples marcos de tiempo y múltiples símbolos envía una alerta cuando se han identificado una o dos divergencias diferentes en varios marcos de tiempo y no en divergencias individuales. Se puede utilizar con todos los marcos de tiempo desde M5 hasta MN. Es posible habilitar la media móvil o el filtro de tendencia RSI para filtrar solo las configuraciones más fuertes. Combinado con sus propias reglas y técnicas, este indicador le permitirá crear (o mejo
El indicador identifica cuando ocurre una divergencia entre el precio y un indicador u oscilador. Identifica divergencias alcistas y bajistas ocultas o regulares (clásicas). Combinado con sus propias reglas y técnicas, este indicador le permitirá crear (o mejorar) su propio sistema poderoso. Características Puede detectar divergencias para los siguientes indicadores / osciladores: MACD, OsMA (Media móvil del oscilador), Estocástico, RSI, CCI, RVI, Awesome (AO), ADX, ATR, OBV, MFI, Momentum y  
FREE
Este indicador puede enviar alertas cuando se produce un cambio de color Heiken Ashi Smoothed. Combinado con sus propias reglas y técnicas, este indicador le permitirá crear (o mejorar) su propio sistema poderoso. Características Puede enviar todo tipo de alertas. Opción de retrasar la alerta una o más barras para confirmar el cambio de color (tendencia). Parámetros de entrada Cambio de vela para alerta: el valor predeterminado es 1. Establecerlo en 0 le avisará sobre el cambio de color en la ve
FREE
Te recomiendo leer el   blog (manual) del producto   de principio a fin para que quede claro desde el principio lo que ofrece EA. Este Asesor Experto identifica cuando se produce una divergencia entre el precio y un oscilador/indicador. Identifica divergencias tanto regulares/clásicas (inversión de tendencia) como ocultas (continuación de tendencia). Tiene zona de oferta/demanda, RSI, Bollinger, estocástico, media móvil (MA regular y MA de casco), ADX y opciones de filtro de volumen que permite
te recomiendo que leas el       blog del producto   (manual) de principio a fin para que       Está claro desde el principio lo que ofrece EA. La estrategia principal de este asesor experto (EA) es colocar operaciones cuando 3 promedios móviles (MA) están alineados consecutivamente y a cierta distancia entre sí (puede usarse, por ejemplo, para una estrategia no muy conocida utilizada por algunos comerciantes institucionales , que involucra los MA 10, 20 y 30 en el marco de tiempo D1). El EA fun
Este indicador de marco de tiempo múltiple y símbolo múltiple identifica formaciones superiores / inferiores dobles o triples o una ruptura del escote siguiente (superior / inferior confirmada). Ofrece filtros RSI, pin bar, envolvente, pinzas, estrella matutina / vespertina, así como opciones de filtro de divergencia MACD, Awesome (AO) o RSI que permiten filtrar solo las configuraciones más fuertes.       El indicador también se puede utilizar en modo de gráfico único. Lea más sobre esta opción
Este indicador puede enviar alertas cuando se produce un cambio de color Heiken Ashi Smoothed. Combinado con sus propias reglas y técnicas, este indicador le permitirá crear (o mejorar) su propio sistema poderoso. Características Puede enviar todo tipo de alertas. Opción de retrasar la alerta una barra para confirmar el cambio de color (tendencia). Parámetros de entrada Espere a que se cierre la vela:       'verdadero o falso'. Establecerlo en 'verdadero' retrasará la alerta hasta la apertura de
FREE
Por favor, si es posible, considere comprar el       Versión MT5   que continuaré desarrollando (no habrá actualizaciones futuras para esta versión MT4). También te recomiendo que leas el       blog del producto   (manual) de principio a fin para que quede claro desde el principio lo que ofrece el EA. La estrategia principal de este asesor experto (EA) es colocar operaciones cuando 3 promedios móviles (MA) están alineados consecutivamente y a cierta distancia entre sí (puede usarse, por ejemplo
Este indicador de marco de tiempo múltiple y símbolo múltiple identifica formaciones superiores / inferiores dobles o triples o una ruptura del escote siguiente (superior / inferior confirmada). Ofrece filtros RSI, pin bar, envolvente, pinzas, estrella matutina / vespertina, así como opciones de filtro de divergencia que permiten filtrar solo las configuraciones más fuertes.  El indicador también se puede utilizar en modo de gráfico único. Lea más sobre esta opción en el producto   blog .   Comb
Este indicador reconoce un tipo especial de formación de barra interior que está formada por una gran vela maestra seguida de 4 velas más pequeñas (consulte la explicación de la estrategia a continuación). Características Traza las líneas de stop de compra / venta en el gráfico, así como los niveles de toma de ganancias y stop loss. Los niveles de TP / SL se basan en el indicador de rango verdadero promedio (ATR). Los colores de los objetos se pueden cambiar. Le envía una alerta en tiempo real c
El indicador identifica cuando ocurre una divergencia entre el precio y un oscilador / indicador. Identifica las divergencias alcistas y bajistas. Tiene una opción de filtro RSI que permite filtrar solo las configuraciones más fuertes. El indicador también ofrece opciones para esperar una ruptura del canal Donchian o que el precio cruce un promedio móvil (vea la captura de pantalla n. 3) para confirmar la divergencia antes de señalar la oportunidad comercial. Combinado con sus propias reglas y
Características Este es un indicador que reconoce un tipo especial de formación de barra interior que está formada por una vela maestra seguida de 4 velas más pequeñas (consulte la explicación de la estrategia a continuación). Traza las líneas de stop de compra / venta en el gráfico, así como los niveles de toma de ganancias y stop loss. Los niveles de TP / SL se basan en el indicador de rango verdadero promedio (ATR). Los colores de los objetos se pueden cambiar. Le envía una alerta en tiempo r
Este indicador de panel de zona de oferta y demanda de múltiples períodos de tiempo y múltiples símbolos envía alertas cuando el precio ha alcanzado una zona de oferta / demanda. También es posible usarlo para recibir alertas sobre dobles techos / fondos regulares en lugar de zonas. Se puede utilizar con todos los marcos de tiempo de M1 a MN.       Se pueden mostrar un máximo de 9 períodos de tiempo en el tablero al mismo tiempo.   Es posible utilizar filtros de RSI, divergencia (MACD, OsMA, RSI
Este indicador de marco de tiempo múltiple y símbolo múltiple puede identificar las siguientes 5 cruces: cuando una media móvil rápida cruza una línea de media móvil lenta. cuando el precio ha alcanzado una única media móvil (cerrado por encima / por debajo o rebotado). cuando ha aparecido una formación de media móvil triple (las 3 MA: s en alineación consecutiva). cuando la línea principal del MACD cruza la línea de señal. cuando la línea de señal cruza la línea MACD cero (0). Combinado con sus
Este indicador de marco de tiempo múltiple e indicador de símbolo múltiple busca barras de alfiler, estrellas matutinas / vespertinas, envolventes, pinzas, marcas de tres líneas, barras interiores y banderines y triángulos.   El indicador también se puede utilizar en modo de gráfico único. Lea más sobre esta opción en el producto   blog .   Combinado con sus propias reglas y técnicas, este indicador le permitirá crear (o mejorar) su propio sistema poderoso. Características Puede monitorear todo
Este indicador de marco de tiempo múltiple e indicador de símbolo múltiple busca barras de alfiler, estrellas matutinas / vespertinas, envolturas, pinzas, marcas de tres líneas, barras interiores y banderines y triángulos. El indicador también se puede utilizar en modo de gráfico único. Lea más sobre esta opción en el producto   blog . Combinado con sus propias reglas y técnicas, este indicador le permitirá crear (o mejorar) su propio sistema poderoso. Características Puede monitorear todos los
Este indicador de marco de tiempo múltiple y símbolo múltiple identifica cuando la línea de señal estocástica cruza la línea principal estocástica. Como beneficio adicional, también puede buscar bandas de Bollinger y cruces de sobrecompra / sobreventa de RSI. Combinado con sus propias reglas y técnicas, este indicador le permitirá crear (o mejorar) su propio sistema poderoso. Características Puede monitorear todos los símbolos visibles en su ventana Market Watch al mismo tiempo. Aplique el indic
Este indicador / oscilador múltiple (en adelante indicador), marco de tiempo múltiple e indicador de símbolo múltiple identifica cuando ocurre una divergencia entre el precio y uno, dos o tres indicadores. Identifica divergencias tanto regulares / clásicas (inversión de tendencia) como ocultas (continuación de tendencia). Tiene opciones de filtro de tendencias RSI y MA que permiten filtrar solo las configuraciones más fuertes. Combinado con sus propias reglas y técnicas, este indicador le permit
Este indicador de marco de tiempo múltiple y símbolo múltiple identifica patrones fractales. Como beneficio adicional, también puede buscar cambios de tendencia de SAR parabólico (pSAR). Combinado con sus propias reglas y técnicas, este indicador le permitirá crear (o mejorar) su propio sistema poderoso. Características Puede monitorear todos los símbolos visibles en su ventana Market Watch al mismo tiempo. Aplique el indicador a un solo gráfico y monitoree instantáneamente todo el mercado. Pu
Filtro:
Johan Julien Aubry
856
Johan Julien Aubry 2023.02.12 11:38 
 

Powerfull indicator, very cheap and with a lot of possibilities to customise settings. Can be used for entry points or to confirm other entries. Well documented and EA compatible. Jan is really helpful and very reactive. I totally recommend this product!

Daviddollar
86
Daviddollar 2022.06.30 17:04 
 

Not worth it, it alerts after the divergence is triggered. When using backtest only shows the confirmed ones and erases de rest.

Edensgarden
20
Edensgarden 2022.01.17 14:27 
 

It's a very good divergence indicator; it does what is promised by Jan. I have incorporated this tool into my trading habits. Also great support from Jan.

kamz1419
149
kamz1419 2021.07.16 18:14 
 

Great product, works as exactly as required and the alerts are timely and you change and choose from a range of settings. The support Jan offers os excellent and he replies very fast with the required solutions. Thanks

hpolanco
64
hpolanco 2021.02.26 00:31 
 

Please add multicolor histogram EXAMPLE: http://www.profitf.com/wp-content/uploads/2015/03/MACD-color.jpg

marco
132
marco 2020.10.04 11:05 
 

Very interesting Indicator and Jan is a super Friendly & Dedicated Developer

jacki robo
88
jacki robo 2020.09.07 09:18 
 

this indicator was great .I want to give 1000 star!

Robby Wijaya
210
Robby Wijaya 2020.04.14 20:30 
 

This indicator are very very great and smart, its catch almost 90% of divergence form but when you know how to use it properly for scalping strategy then this indicator I can say Perfect 100% !! Thanks Jan you are ROCK , GBU

Hasan Yildirim
911
Hasan Yildirim 2019.12.30 14:28 
 

El usuario no ha dejado ningún comentario para su valoración

Erik Vikanes Hansen
212
Erik Vikanes Hansen 2019.08.22 12:02 
 

This indicator seems to be very promising, where it gives reliable entry signals and one can choose from a variety of different oscillators. I have been using it for a short time and so far I am very happy. Jan the developer, is also very friendly and easy to get in touch with. He helps out with his experience with regards to both choosing the best oscillator and preferred settings for different instruments. So far I would recommend this indicator. It is very easy to play around with all the different oscillators and settings for backtesting.

Thomas
85
Thomas 2019.06.11 14:37 
 

I can't tell how amazing this Indicator is. In combination with a few different setups it is a weapon on GBP/USD. Really, really great. Thank you Mr. Flodin.

Respuesta al comentario
Versión 3.3 2023.03.18
*** Please always make a backup of the existing indicator (the .ex5 file) before you make an update ***

Change log:
- added Hull moving average to the list of breakout options
- added Bollinger trend filter filter as an option to the already existing RSI and ATR filters
- it is now possible to select to add the trend filter indicator to the chart
Versión 3.2 2022.02.15
*** Please always make a backup of the existing indicator (the .ex5 file) before you make an update ***

- bug fix in the function which draws lines and arrows
Versión 3.1 2022.01.18
*** Please always make a backup of the existing indicator (the .ex5 file) before you make an update ***

- bug fix in the Engulfing filter
Versión 3.0 2022.01.17
*** Please always make a backup of the existing indicator (the .ex5 file) before you make an update ***

- added an option to ignore wicks on divergence candles, hence divergence signals will based on open/close prices instead of high/low prices.
Versión 2.9 2022.01.12
*** Please always make a backup of the existing indicator (the .ex5 file) before you make an update ***

- added the possibility to be alerted only if the following candle (the candle after the divergence candle) is an engulfing candle. More information in the product's blog.
Versión 2.8 2021.11.16
*** Please always make a backup of the existing indicator (the .ex5 file) before you make an update ***

- added Stochastics oversold/overbought filter for Stochastics divergences
- added Accumulation/Distribution and Accelerator divergences
- added an option to set the minimum amount of bars between extremums
- added an option to use an ATR filter instead of the RSI filter
Versión 2.7 2021.11.03
*** Please always make a backup of the existing indicator (the .ex5 file) before you make an update ***

This is not a mandatory update if you are not using my Expert Advisor for auto trading based on signals from this indicator.

- added support for trading Donchian channel and Moving average breakouts with my Expert Advisor
Versión 2.6 2021.08.31
*** Please always make a backup of the existing indicator (the .ex5 file) before you make the update ***

- added options to wait for a Donchian channel breakout or Moving average cross to confirm the divergence before signaling the trade
Versión 2.5 2020.09.25
*** Please always make a backup of the existing indicator (the .ex5 file) before you make an update ***

This is not a mandatory update if you are not using iCustom() calls in an own developed Expert Advisor.

- added the possibility to use another buffer (#4) for iCustom() calls. By using this buffer instead you will know if the divergence is of regular (classical) or hidden type. Code example at the end of the product's blog
Versión 2.4 2020.08.02
*** Please always make a backup of the existing indicator (the .ex5 file) before you make an update ***

- I have changed the logic of detecting divergences so that more divergences will be detected. The new logic will allow divergences even if there are additional indicator extremums (top/bottoms) between the 2 already existing extremum points. Please be aware of the fact that the new logic also comes with a performance cost. Something which will be more visible on slower computers.
- added an option to disable drawing of lines and arrows if the RSI filter is enabled and the price it outside the RSI levels
Versión 2.3 2020.02.04
- added an option to embed a custom alert text into the alert
- upon request I have added the possibility to scan for "early" divergences. This means that the alert will come directly upon candle open instead of waiting for the slope in the indicator to change direction (candle shift 1 or 2). Candle shift must be set to 0 for this to work. Please be aware though that this will lead to more false signals (repaintings)
Versión 2.2 2020.01.23
- minor bug fixes
Versión 2.1 2019.11.01
- added support for MFI and Momentum divergences
- added the possibility to show MACD main line as histogram instead of a line (same as in the Metatrader native MACD indicator)
Versión 2.0 2019.09.19
- added possibility to select OBV volume type
Versión 1.9 2019.09.19
*** Please always make a backup of the existing indicator (the .ex4 file) before you make the update ***

- added support for OBV, ATR and Composite Index divgergences
- added an option to select if divergence candle must close at least xx % away from the high/low price
Versión 1.8 2019.08.21
- added an option to use strict mode for price or indicator levels. When this has been enabled then the levels between the both extremums are not allowed to be higher/lower then the first or last extremum candle or indicator level.
Versión 1.7 2019.08.15
- fixed an error for the level lines in the indicator window
Versión 1.6 2019.08.14
- added ADX divergence
Versión 1.5 2019.06.13
- corrected an issue with the RSI filter. Alerts came even if RSI was out of range.
Versión 1.3 2019.02.18
- added RSI filter option
- added the possibility to disable scanning of bullish or bearish divergences
Versión 1.2 2018.08.16
- added possibility to set custom line level values in the indicator window for Stochastics and RSI
Versión 1.1 2018.06.27
- added support for iCustom with two buffers. Buffer index 4 for bull signals and index 5 for bear signals. The shift is always 0. The value returned is a close price of the candle where the divergence occured.