YFX Wing Patterns
- Indicadores
- Richard Yancy
- Versión: 6.0
- Actualizado: 6 febrero 2020
- Activaciones: 5
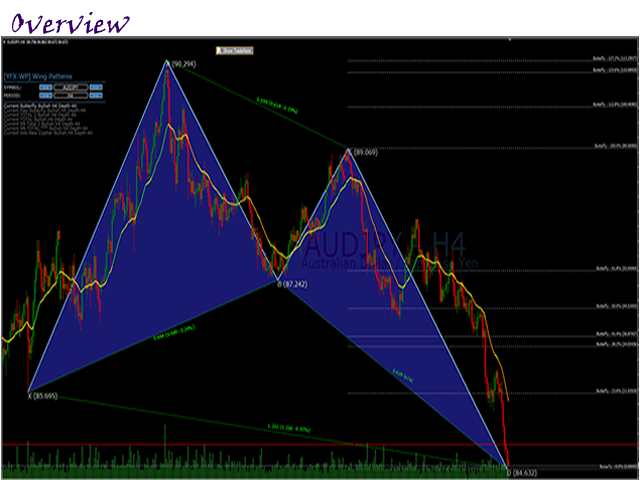
The Wing Patterns indicator scans for many different kinds of Patterns using an XABCD structure. The term Wing Pattern is used to refer to all types of patterns based on a general XABCD structure, which is plotted in an alternate high-low extreme form.
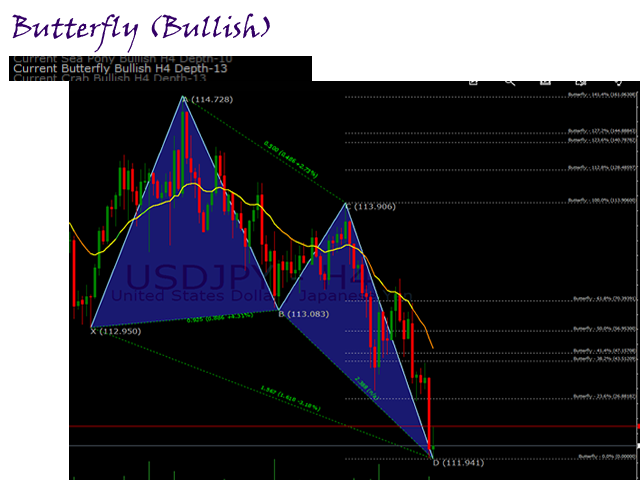
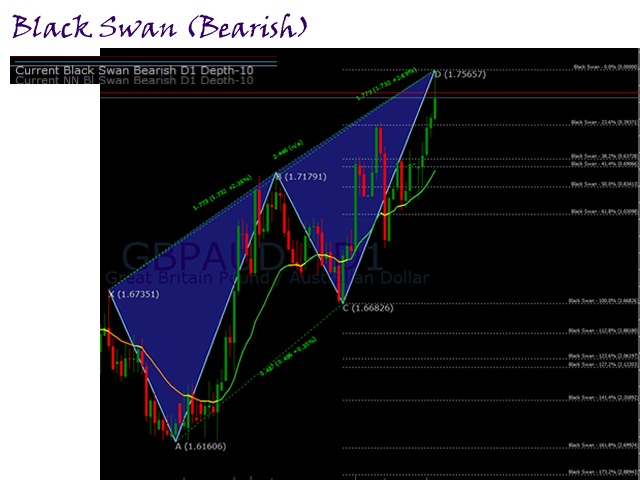
In other words, assume that point X is started at a low point on the chart. The point A is plotted at the next highest point within a certain number of bars. This certain number of bars is called the depth level. In this example, point B would be plotted at the next lowest point for a particular depth. Following the flow, point C is at next high and point D is at the next low. If you connect these points on a chart, it usually looks like the wings of a butterfly, thus the name Wing Pattern.
These patterns fit very well with the Harmonic patterns. There are many patterns that can be displayed in this indicator. Predefined patterns include the following:
- Gartley.
- Pattern 5-0.
- AB=CD.
- Bat.
- Butterfly.
- Crab.
- Cypher.
- Deep Crab.
- Shark.
- Three Drives.
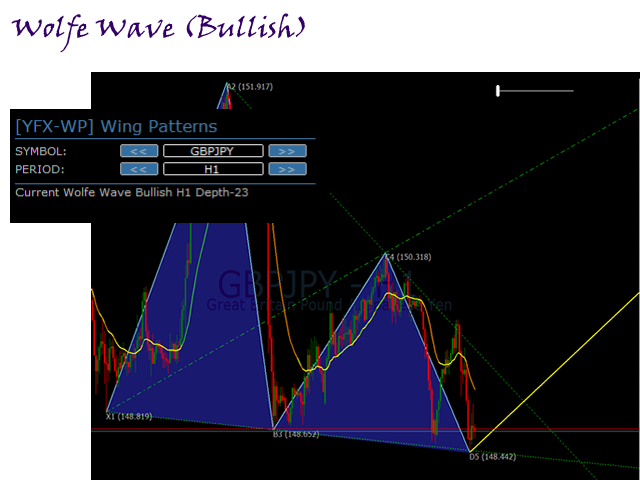
- Wolf Wave.
Other patterns that can be searched are stored in an external file. Users can also define their own patterns by adding lines of data to the external file. Note that patterns can be changed or removed from the external file.
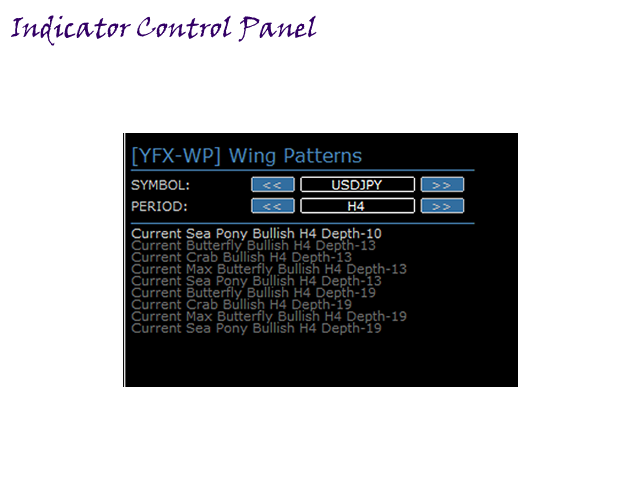
A user control panel is shown on the chart that allows users to control the display of identified patterns. Users can turn on/off the desired patterns. All control panel parameters can be set by the users.
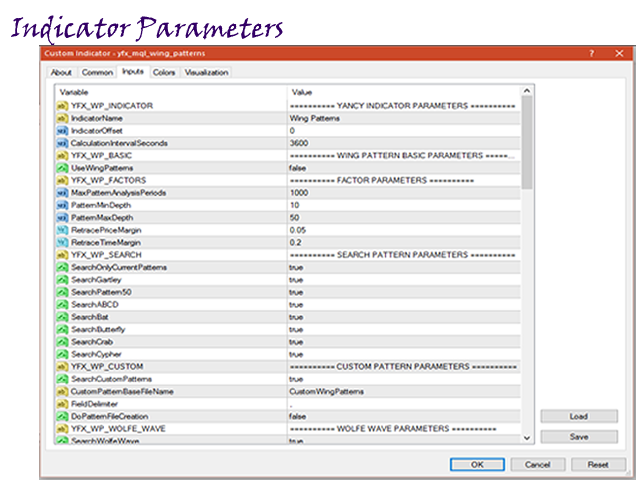
Parameters
The Wing Patterns indicator has many configurable parameters. This allows for all aspects of the indicator to be changed for the user’s preferences. By default, the indicator is designed to work without any configuration required. The parameters are divided into the following categories:
- Yancy Indicator Parameters - Control the overall functionality of the indicator.
- Wing Pattern Basic Parameters - Control how the indicator is calculated and used.
- Factor Parameters - Set global constant values used throughout the Wing Patterns indicator.
- Search Pattern Parameters - Control which patterns are analyzed and search during pattern analysis.
- Custom Pattern Parameters - Control how user-defined patterns are treated.
- Wolfe Wave Parameters - Configure how the Wolfe Wave patterns are managed in the indicator.
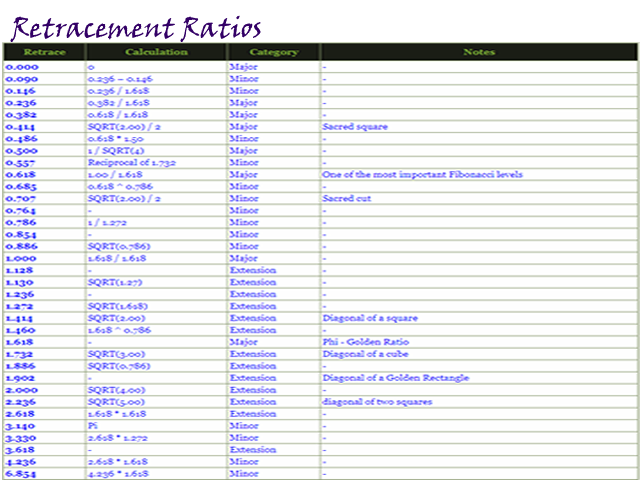
- Fibonacci Parameters - Configure how Fibonacci retracements are managed.
- Size Parameters - Configure the size of lines used to draw patterns on the chart.
- Font Parameters - Manage the fonts used in the indicator.
- Color Parameters - Colors can be strongly preferred by users. The Wing Patterns indicator allows all colors to be changed according to each user’s preference. The specific colors do not change the underlying calculations of the indicator.
- Button Parameters - configure how control panel GUI objects are managed in the indicator.
- Display Parameters - Control how wing patterns are displayed on the chart.
- Signals Parameters - Manage how trade signals are treated by the indicator.
- Message Parameters - Determine how the indicator notifications are conveyed to the user. There are several options and the user can select which ones to use at any time. Multiple options can be enabled simultaneously.
- Quiet Time Parameters - Control when notification messages are conveyed to the user. Parameters in this section specify a time period when all notifications are disable. Settings in this section override the message parameters and alert parameters. No notification will be sent during quiet time.
- Message Info Parameters - Configure if internal statistics are maintained by the indicator. The information is generally not needed by the user. Thus, it is recommended to leave the options disabled.
- Debug Parameters - Debugging can be configured with the parameters in this section. Debugging would cause a great number of messages to be generated if enabled. It is highly recommended to leave debug disabled.
It should be noted that the user does not have to change any parameters for the indicator to work. All parameters have default values that have the lowest impact on the indicator and user. The Wing Patterns indicator is designed to work perfectly by just placing it on a chart.