• Información general
  • Comentarios (1)
  • Discusión (6)
  • Novedades

ATR info panel

5

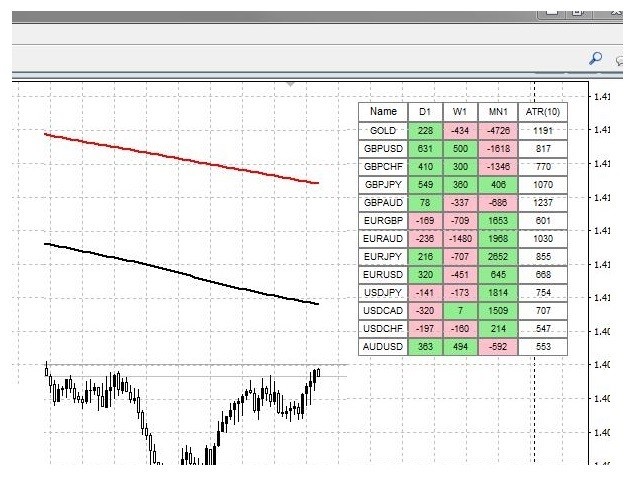
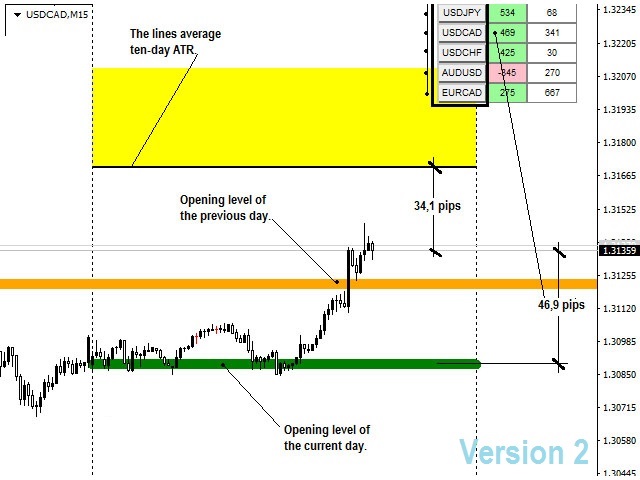
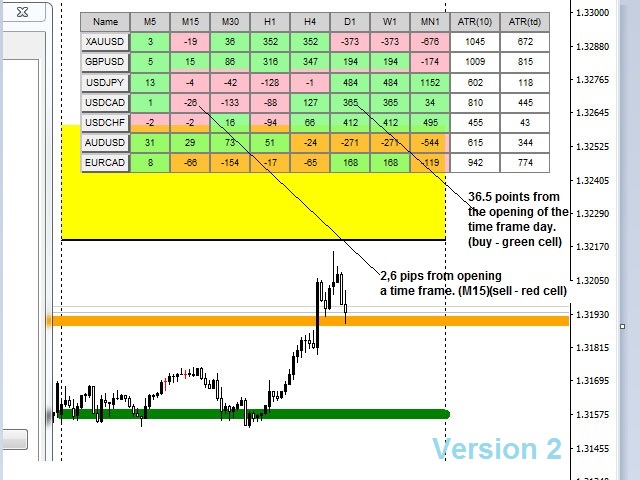
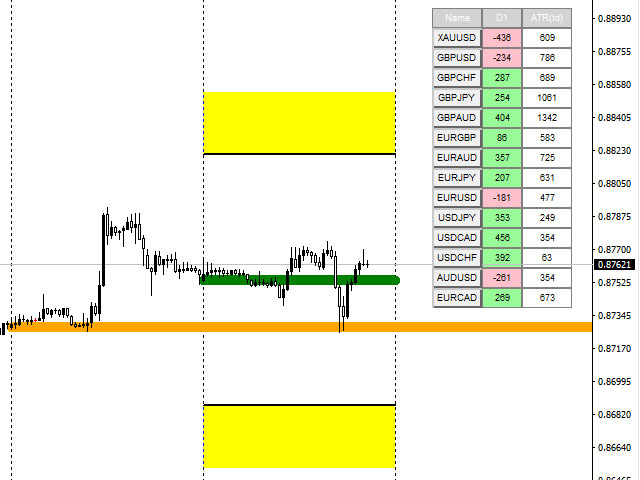
Индикатор таблица, постоянно меняющихся значений, пройденных ценой пунктов от начало дня (D1), от начала недели (W1) и от начала текущего месяца (MN).

Индикатор также показывает средний дневной АТР за выбранный период. Параметры всей таблицы регулируются. Перемещение по осям монитора, для расположения в удобном месте, цвета текстов и заполнений ячеек, размеры столбцов, строк, цифр и текстов. Пользоваться можно на белом и тёмном фоне.

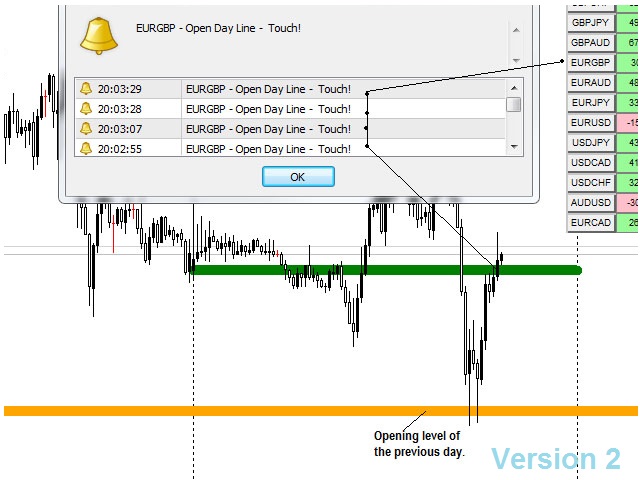
По индикатору трейдер может легко определить настроение на рынке и направление движений валютной пары за временные периоды.

В таблицу индикатора во входных его параметрах можно добавить до пятнадцати торговых инструментов.

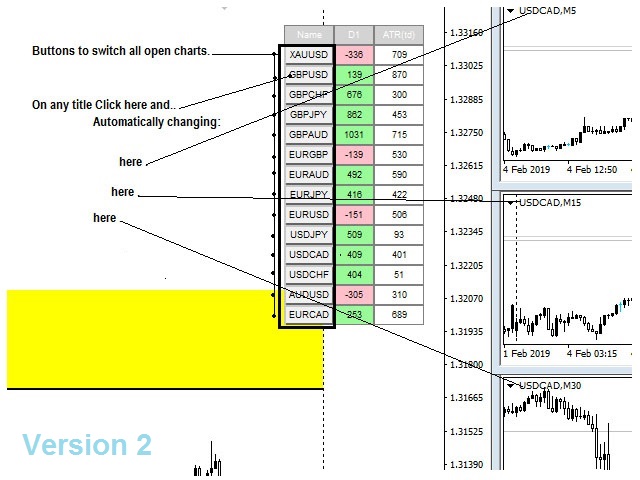
Название выбранных инструментов в таблице, являются кнопками переключения графиков валютных пар (инструментов).


Некоторые параметры индикатора:

  • D1 - отображение столбика значений пройденных пунктов от начало дня.
  • W1 - отображение столбика значений пройденных пунктов от начало недели.
  • MN - отображение столбика значений пройденных пунктов от начало месяца.
  • ATR - количество дней для подсчёта АТР, по умолчанию: 14.
  • Sym1 - символ валютной пары, по умолчанию: GOLD.
  • Sym2 - символ валютной пары, по умолчанию: GBPUSD.
  • Sym3 - символ валютной пары, по умолчанию: GBPCHF.
  • Sym4 - символ валютной пары, по умолчанию: GBPJPY.
  • Sym5 - символ валютной пары, по умолчанию: GBPAUD.
  • Sym6 - символ валютной пары, по умолчанию: EURGBP.
  • Sym7 - символ валютной пары, по умолчанию: EURAUD.
  • Sym8 - символ валютной пары, по умолчанию: EURJPY.
  • Sym9 - символ валютной пары, по умолчанию: EURUSD.
  • Sym10 - символ валютной пары, по умолчанию: USDJPY.
  • Sym11 - символ валютной пары, по умолчанию: USDCAD.
  • Sym12 - символ валютной пары, по умолчанию: USDCHF.
  • Sym13 - символ валютной пары, по умолчанию: AUDUSD.
  • Sym14 - символ валютной пары, по умолчанию: -
  • Sym15 - символ валютной пары, по умолчанию: -
  • Right indent - отступ таблицы по оси Х, по умолчанию: 20.
  • Indent from the top - отступ таблицы по оси Y, по умолчанию: 20.
  • Ширина столбцов по умолчанию: 50,40.
  • Высота строк и ячеек: 20,20.

Примечание: Индикатор подходит как для торговли на М1, М5, М15, М30, так и для торговли на старших тайм фреймах.
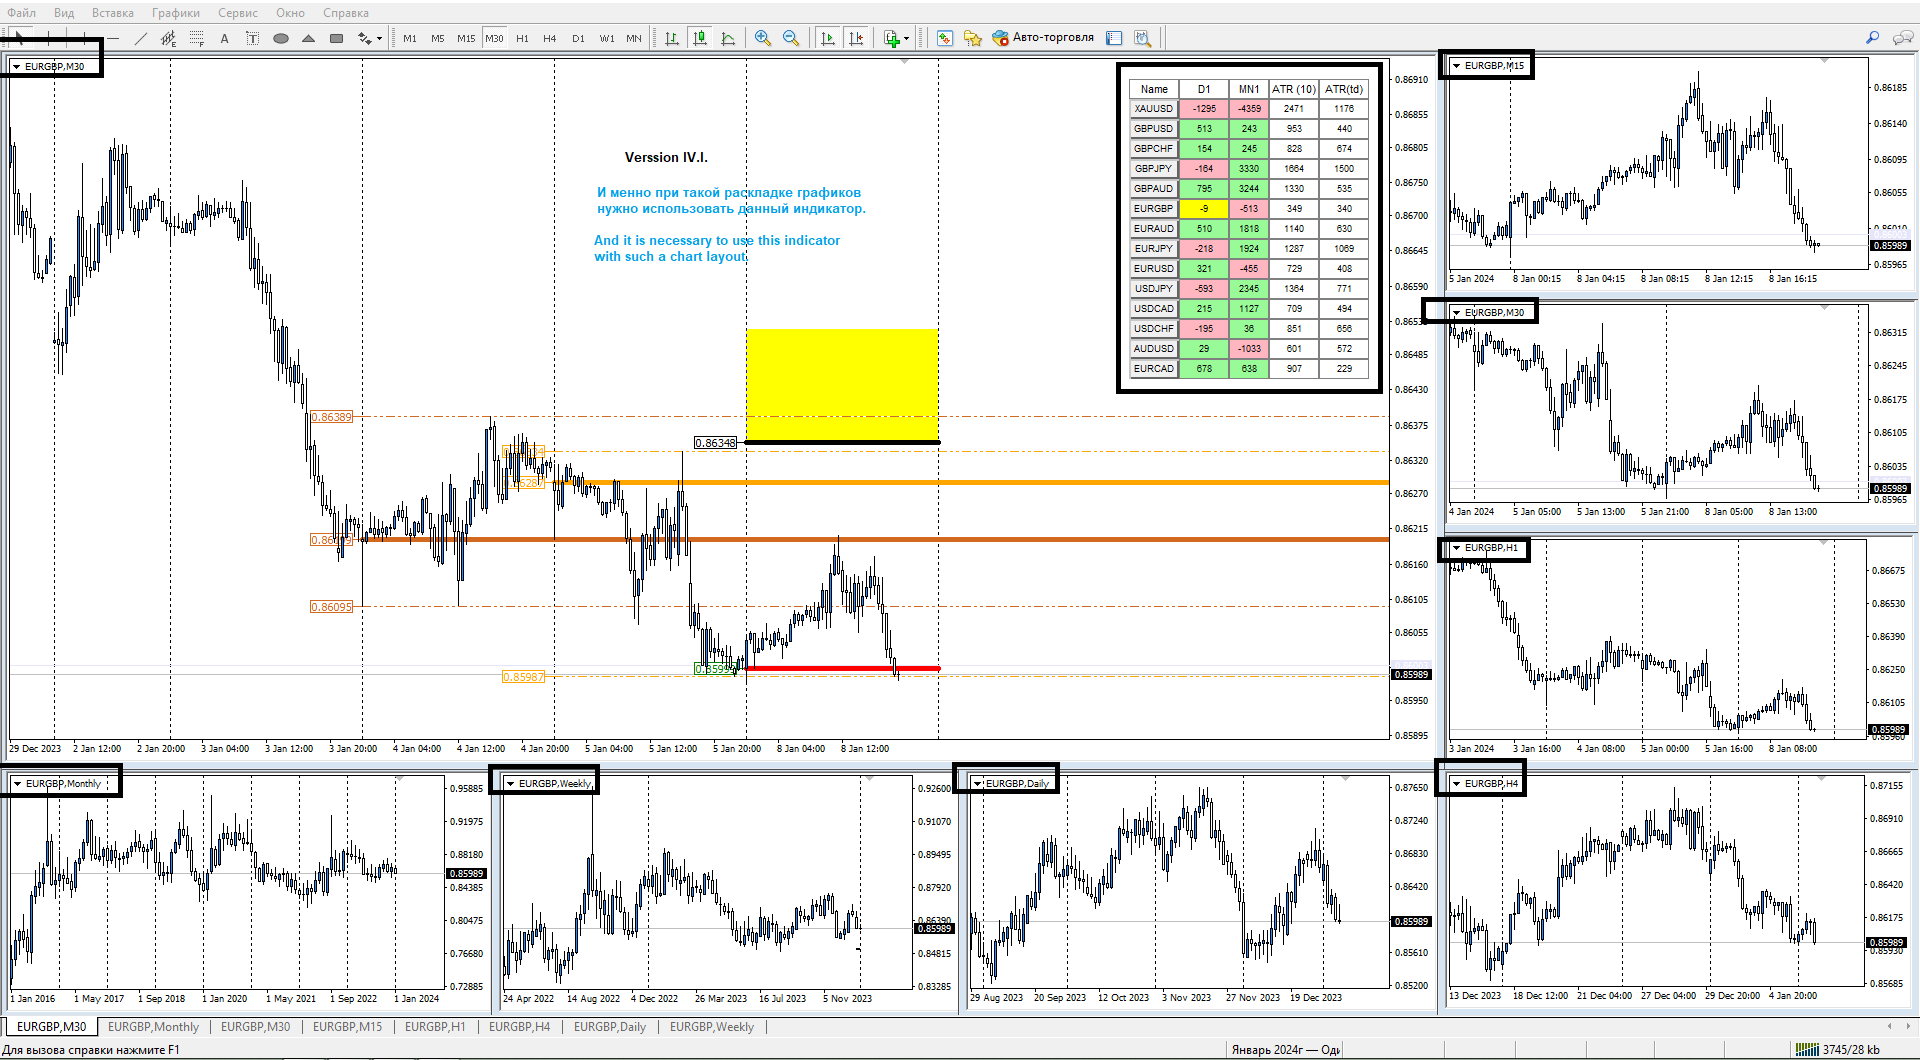
                      При работе с индикатором рекомендуется настроить графики всех таймфреймов на одном мониторе. 

Если торгуешь на одном мониторе, то этот индикатор для тебя. (смотри скрин описания).

Comentarios 1
Spirit77
32
Spirit77 2020.08.08 20:03 
 

пользуюсь несколько месяцев. удобный и простой помощник,можно всё подстроить под себя. самое главное для меня это автоматическая отрисовка ближайших уровней и переключение всех настроенных окон одним кликом! ни разу не пожалел о покупке, Александру огромный респект!!! спасибо!

Productos recomendados
Blahtech Market Profile
Blahtech Limited
4.61 (18)
Was: $249  Now: $99   Market Profile defines a number of day types that can help the trader to determine market behaviour. A key feature is the Value Area, representing the range of price action where 70% of trading took place. Understanding the Value Area can give traders valuable insight into market direction and establish the higher odds trade. It is an excellent addition to any system you may be using. Blahtech Limited presents their Market Profile indicator for the MetaTrader community. Ins
Master Scalping M1 es un indicador innovador que utiliza un algoritmo para determinar la tendencia de forma rápida y precisa. El indicador calcula el tiempo de apertura y cierre de posiciones, los algoritmos del indicador le permiten encontrar los momentos ideales para ingresar a una operación (comprar o vender un activo), lo que aumenta el éxito de las transacciones para la mayoría de los comerciantes. Beneficios del indicador: Fácil de usar, no sobrecarga el gráfico con información innecesari
Noize Absorption Index MT4
Ekaterina Saltykova
5 (1)
Noize Absorption Index - is the manual trading system that measures the difference of pressure between bears forces and bulls forces. Green line - is a noize free index that showing curent situation. Zero value of index shows totally choppy/flat market.Values above zero level shows how powerfull bullish wave is and values below zero measures bearish forces.Up arrow appears on bearish market when it's ready to reverse, dn arrow appears on weak bullish market, as a result of reverse expectation. S
Daily Candle Predictor es un indicador que predice el precio de cierre de una vela. El indicador está destinado principalmente para su uso en gráficos D1. Este indicador es adecuado tanto para el comercio de divisas tradicional como para el comercio de opciones binarias. El indicador se puede utilizar como un sistema de negociación independiente o puede actuar como una adición a su sistema de negociación existente. Este indicador analiza la vela actual, calculando ciertos factores de fuerza dent
Retroceso de Fibonacci & Herramientas de Dibujo de Líneas Extendidas Retroceso de Fibonacci & Herramientas de Dibujo de Líneas Extendidas son aptos para la plataforma MT4 y para operadores que emplean el método de negociación de puntos y la negociación de sección áurea. Ventajas: Sin líneas excusadas ni las excesivamente largas, y es fácil de observar y descubrir oportunidades de negociación. Versión de prueba: https://www.mql5.com/zh/market/product/35884 Funciones principales: 1.
The Th3Eng PipFinite indicator is based on a very excellent analysis of the right trend direction with perfect custom algorithms. It show the true direction and the best point to start trading. With StopLoss point and Three Take Profit points. Also it show the right pivot of the price and small points to order to replace the dynamic support and resistance channel, Which surrounds the price. And Finally it draws a very helpful Box on the left side on the chart includes (take profits and Stop loss
Title : Market Bias Indicator - Oscillator-Based Trading Tool Introduction : Discover the potential of the "Market Bias Indicator," a revolutionary oscillator-based trading tool designed for precise market analysis. If you're in search of a robust alternative to traditional bias indicators, your quest ends here. Market Bias Indicator offers unparalleled accuracy in identifying market sentiment and is your gateway to confident trading decisions. Recommended Trading Pairs : Market Bias Indicator i
Sto Signal AM
Andriy Matviyevs'kyy
This indicator displays Stochastic osc signals on the price chart and allows the user to receive notifications of such signals. The Stochastic indicator is a classic and proven indicator of the technical analysis of the markets. Despite its age, it is still relevant today. Depending on the settings, the indicator allows you to work effectively on various TFs and any markets. Signals are given on fully formed bars and are not redrawn. Custom Parameters: Stochastic_Price (0-1) - The applied pric
HMA Trend Professional MT4
Pavel Zamoshnikov
4.63 (8)
Improved version of the free HMA Trend indicator (for MetaTrader 4) with statistical analysis. HMA Trend is a trend indicator based on the Hull Moving Average (HMA) with two periods. HMA with a slow period identifies the trend, while HMA with a fast period determines the short-term movements and signals in the trend direction. The main differences from the free version: Ability to predict the probability of a trend reversal using analysis of history data. Plotting statistical charts for analyz
Heiken Ashi candle chart is an improved version of The Japanese candle chart, which can effectively filter the market "noise" of the Japanese candle chart. It is favored by many traders for its simplicity and intuition. For trend traders, the HA candle chart is a magic tool. Unlike the traditional Japanese candle chart, Heikenashi does not reflect the opening price, high price, low price and closing price of the market. Instead, Heikenashi calculates the value of a single K line in the dominant
Owl smart levels
Sergey Ermolov
4.63 (54)
Versión MT5  |   FAQ El   Indicador Owl Smart Levels   es un sistema comercial completo dentro de un indicador que incluye herramientas de análisis de mercado tan populares como   los fractales avanzados de Bill Williams , Valable ZigZag que construye   la estructura de onda correcta   del mercado y   los niveles de Fibonacci   que marcan los niveles exactos de entrada. en el mercado y lugares para tomar ganancias. Descripción detallada de la estrategia Instrucciones para trabajar con el indi
Cosmic Diviner X Planet
Olena Kondratenko
4 (2)
This unique multi-currency strategy simultaneously determines the strength of trends and market entry points, visualizing this using histograms on the chart. The indicator is optimally adapted for trading on the timeframes М5, М15, М30, Н1. For the convenience of users, the indicator renders the entry point (in the form of an arrow), recommended take profit levels (TP1, TP2 with text labels) and the recommended Stop Loss level. The take profit levels (TP1, TP2) are automatically calculated for
Matrixs
Andriy Sydoruk
Matrix is a Forex arrow indicator. Displays signals simply and clearly! The arrows show the direction of the transaction, and are colored accordingly, which can be seen in the screenshots. As you can see, trading with such an indicator is easy. I waited for an arrow to appear in the desired direction - I opened a deal. An arrow formed in the opposite direction - closed the deal. The indicator also displays the lines with the help of which the arrow signals are formed, taking into account the int
Point61 Indicator
Evgeniy Machok
5 (1)
The Point61 indicator is the result of many years of monitoring of price behavior of currency pairs and metals. It is not a secret, that in times of uncertainty, traders are looking for possible levels of support and resistance - the point, where price should stop its movement. There are 2 possible scenarios at these points: 1. Reverse (correction) to the opposite direction; 2. Breakthrough to continue movement. Very often these points are used to set stop orders - TakeProfit or
RiverScope Lite automatically determines the nearest most important price levels and support and resistance zones in history, it also identifies a large number of price action patterns (the lite version is limited to 10, while the full version has 30+). The support and resistance levels are determined based on an algorithm that calculates and filters the historical values of the price, its movement character, volumes, etc. It displays the current situation, therefore the nearest levels change in
Infinity Trend Pro
Yaroslav Varankin
1 (1)
This is a trend indicator without redrawing Developed instead of the binary options strategy (by the color of the Martingale candlestick) Also works well in forex trading When to open trades (binary options) A signal will appear in the place with a candle signaling the current candle It is recommended to open a deal for one candle of the current timeframe M1 and M5 When a blue dot appears, open a deal up When a red dot appears, open a trade down. How to open trades on Forex. When a signal is rec
TWO PAIRS SQUARE HEDGE METER INDICATOR Try this brilliant 2 pairs square indicator It draws a square wave of the relation between your two inputs symbols when square wave indicates -1 then it is very great opportunity to SELL pair1 and BUY Pair2 when square wave indicates +1 then it is very great opportunity to BUY pair1 and SELL Pair2 the inputs are : 2 pairs of symbols         then index value : i use 20 for M30 charts ( you can try other values : 40/50 for M15 , : 30 for M30 , : 10 for H1 ,
A "Volume Profile" is an advanced charting indicator that displays total volume traded at every price level over a user specified time period. The main components of the volume profile are POC ( Point Of Control - the price level, at which the maximum number of contracts were executed during a selected period), VAH ( Value Area High - the highest price in the Value Area) and VAL ( Value Area Low - the lowest price in the Value Area). When we settled on the original indicator, we spent a lot o
Trendiness Index
Libertas LLC
5 (3)
"The trend is your friend" is one of the best known sayings in investing, because capturing large trendy price movements can be extremely profitable. However, trading with the trend is often easier said than done, because many indicators are based on price reversals not trends. These aren't very effective at identifying trendy periods, or predicting whether trends will continue. We developed the Trendiness Index to help address this problem by indicating the strength and direction of price trend
The Chaikin Oscillator is a technical indicator developed by Marc Chaikin that combines price and volume data to measure the accumulation and distribution of a financial instrument. It aims to identify potential buying and selling opportunities in the market. The Chaikin Oscillator is calculated by subtracting a 10-day exponential moving average of the Accumulation Distribution Line (ADL) from a 3-day exponential moving average of the ADL. Here's how to use the Chaikin Oscillator indicator in tr
Un indicador técnico que calcula sus lecturas sobre los volúmenes de negociación. En forma de histograma, muestra la acumulación de la fuerza del movimiento del instrumento comercial. Dispone de sistemas de cálculo independientes para direcciones alcistas y bajistas. Funciona en cualquier instrumento comercial y marco de tiempo. Puede complementar cualquier sistema comercial. El indicador no vuelve a dibujar sus valores, las señales aparecen en la vela actual. Es fácil de usar y no carga el gr
This multicurrency indicator is the Lite version of the Cosmic Diviner Reversal Zone Pro indicator. The indicator is based on original formulas for analyzing the volatility and price movement strength. This allows determining the overbought and oversold states of instruments with great flexibility, as well as setting custom levels for opening buy or sell orders when the overbought or oversold values of the instruments reach a user-defined percentage. A huge advantage of Reversal Zone Lite is the
PZ Trend Trading
PZ TRADING SLU
4.75 (4)
Trend Trading es un indicador diseñado para sacar el máximo provecho posible de las tendencias que tienen lugar en el mercado, mediante el cronometraje de retrocesos y rupturas. Encuentra oportunidades comerciales al analizar qué está haciendo el precio durante las tendencias establecidas. [ Guía de instalación | Guía de actualización | Solución de problemas | FAQ | Todos los productos ] Opere en los mercados financieros con confianza y eficiencia Aproveche las tendencias establecidas sin s
PipFinite Trend PRO
Karlo Wilson Vendiola
4.9 (2775)
Breakthrough Solution For Trend Trading And Filtering With All Important Features Built Inside One Tool! Trend PRO's smart algorithm detects the trend, filters out market noise and gives entry signals with exit levels. The new features with enhanced rules for statistical calculation improved the overall performance of this indicator. Important Information Revealed Maximize the potential of Trend Pro, please visit www.mql5.com/en/blogs/post/713938 The Powerful Expert Advisor Version Automa
This indicator monitors the market for a flat state and possible breakout. The flat state is detected as a predefined number of consecutive bars during which price fluctuates inside a small range. If one of the next bars closes outside the range, breakout is signaled. The indicator shows 3 lines: blue - upper bound of flat ranges AND consecutive breakout areas; red - lower bound of flat ranges AND consecutive breakout areas; yellow - center of flat ranges (NOT including breakout areas). When a b
Delta Pairs
Anatolii Zainchkovskii
1 (1)
Delta Pairs is an indicator for pair trading, it displays the divergence of two currency pairs. Does not redraw. A useful tool for the analysis of the behavior of two currency pairs relative to each other. Purpose The Delta Pairs indicator is designed for determining the divergences in the movements of two currency pairs. This indicator is displayed as two line charts and the difference (delta) between these charts in the form of a histogram. The Delta Pairs indicator will be useful for those
Gioteen Volatility Index (GVI)   - your ultimate solution to overcoming market unpredictability and maximizing trading opportunities. This revolutionary indicator helps you in lowering your losing trades due to choppy market movements. The GVI is designed to measure market volatility, providing you with valuable insights to identify the most favorable trading prospects. Its intuitive interface consists of a dynamic red line representing the volatility index, accompanied by blue line that indicat
Gann Square of 144
Taras Slobodyanik
4.33 (6)
The Gann Box (or Gann Square) is a market analysis method based on the "Mathematical formula for market predictions" article by W.D. Gann. This indicator can plot three models of Squares: 90, 52(104), 144. There are six variants of grids and two variants of arcs. You can plot multiple squares on one chart simultaneously. Parameters Square — selection of a square model: 90 — square of 90 (or square of nine); 52 (104) — square of 52 (or 104); 144 — universal square of 144; 144 (full) — "full"
Forex Gump
Andrey Kozak
2.83 (6)
Forex Gump is a fully finished semi-automatic trading system. In the form of arrows, signals are displayed on the screen for opening and closing deals. All you need is to follow the instructions of the indicator. When the indicator shows a blue arrow, you need to open a buy order. When the indicator shows a red arrow, you need to open a sell order. Close orders when the indicator draws a yellow cross. In order to get the most effective result, we recommend using the timeframes H1, H4, D1. There
For sure, this indicator has become very popular amongst traders. Through coding this indicator will give you the most accurate levels possible for your trading analysis. We have also added in the ability for you to receive alerts when the price breaks above or below a Support or Resistance lines! HOW TO USE The red rectangles represent your resistance/supply zone. The green rectangles represent your support/demand zone.  BONUS FEATURES We coded this indicator with the ability to switch between
Los compradores de este producto también adquieren
Presentamos el Indicador Milagroso de Forex: Desata el Poder del Trading Preciso ¿Estás cansado de buscar el mejor indicador de Forex que realmente ofrezca resultados excepcionales en todos los marcos temporales? ¡No busques más! Ha llegado el Indicador Milagroso de Forex para revolucionar tu experiencia de trading y llevar tus ganancias a nuevas alturas. Construido sobre una base de tecnología de vanguardia y años de desarrollo meticuloso, el Indicador Milagroso de Forex se erige como el pinácu
¡Actualmente 20% OFF ! ¡La mejor solución para cualquier novato o trader experto! Este software funciona con 28 pares de divisas. Se basa en 2 de nuestros principales indicadores (Advanced Currency Strength 28 y Advanced Currency Impulse). Proporciona una gran visión general de todo el mercado de divisas. Muestra los valores de Advanced Currency Strength, la velocidad de movimiento de las divisas y las señales para 28 pares de divisas en todos los (9) marcos temporales. Imagine cómo mejorar
TPSpro RFI Levels
Roman Podpora
5 (13)
A key element in trading is zones or levels from which decisions to buy or sell a trading instrument are made. Despite attempts by major players to conceal their presence in the market, they inevitably leave traces. Our task was to learn how to identify these traces and interpret them correctly. Reversal First Impulse levels (RFI)   -  Version MT5                INSTRUCTIONS                 RUS                 ENG                                       R ecommended to use with an indicator   -  
TPSproTREND PrO
Roman Podpora
5 (15)
TPSpro TRENDPRO  - is a trend indicator that automatically analyzes the market and provides information about the trend and each of its changes, as well as giving signals for entering trades without redrawing! The indicator uses each candle, analyzing them separately. referring to different impulses - up or down impulse. Exact entry points into transactions for currencies, crypto, metals, stocks, indices!  -  Version MT5               DETAILED DESCRIPTION        /       TRADING SETUPS           
Atomic Analyst
Issam Kassas
5 (1)
En primer lugar, vale la pena enfatizar que este Indicador de Trading no repinta, no redibuja y no se retrasa, lo que lo hace ideal tanto para el trading manual como para el automatizado. El Analista Atómico es un Indicador de Acción del Precio PA que utiliza la fuerza y el impulso del precio para encontrar una mejor ventaja en el mercado. Equipado con filtros avanzados que ayudan a eliminar ruidos y señales falsas, y aumentan el potencial de trading. Utilizando múltiples capas de indicadores
ACTUALMENTE 26% DE DESCUENTO ¡La mejor solución para cualquier operador novato o experto! Este indicador es una herramienta única, de alta calidad y asequible porque hemos incorporado una serie de características propias y una nueva fórmula. ¡Con sólo UN gráfico puede leer la Fuerza de la Divisa para 28 pares de Divisas! Imagínese cómo mejorará su operativa porque podrá señalar el punto exacto de activación de una nueva tendencia o de una oportunidad de scalping. Manual del usuario: haga
Scalper Inside PRO
Alexey Minkov
4.75 (55)
An exclusive indicator that utilizes an innovative algorithm to swiftly and accurately determine the market trend. The indicator automatically calculates opening, closing, and profit levels, providing detailed trading statistics. With these features, you can choose the most appropriate trading instrument for the current market conditions. Additionally, you can easily integrate your own arrow indicators into Scalper Inside Pro to quickly evaluate their statistics and profitability. Scalper Inside
Introduciendo       Indicador Quantum Trend Sniper   , el innovador indicador MQL5 que está transformando la forma en que identificas y negocias los cambios de tendencia. Desarrollado por un equipo de comerciantes experimentados con experiencia comercial de más de 13 años,       Indicador de francotirador de tendencia cuántica       está diseñado para impulsar su viaje comercial a nuevas alturas con su forma innovadora de identificar cambios de tendencia con una precisión extremadamente alta.
TrendMaestro
Stefano Frisetti
5 (2)
note: this indicator is for METATRADER4, if you want the version for METATRADER5 this is the link: TRENDMAESTRO recognizes a new TREND in the bud, he never makes mistakes. The certainty of identifying a new TREND is priceless. DESCRIPTION TRENDMAESTRO identifies a new TREND in the bud, this indicator examines the volatility, volumes and momentum to identify the moment in which there is an explosion of one or more of these data and therefore the moment in which prices have strong probability of f
XQ Indicator MetaTrader 4
Marzena Maria Szmit
3 (2)
Step into the realm of Forex trading with confidence and precision using XQ, a cutting-edge Forex indicator designed to elevate your trading game to unprecedented heights. Whether you're a seasoned trader or just stepping into the world of currency exchange,   XQ Forex Indicator   empowers you with the insights and signals needed to make informed trading decisions. The signal conditions are a combination of three indicators, and XQ Forex Indicator only display  medium and long-term trends . The
Advanced Supply Demand
Bernhard Schweigert
4.92 (310)
¡Actualmente con 33% de descuento! ¡La mejor solución para cualquier tráder principiante o experto! Este indicador es una herramienta comercial única, de alta calidad y asequible, porque incorpora una serie de características patentadas y una nueva fórmula. Con esta actualización, podrá mostrar zonas de doble marco temporal. No solo podrá mostrar un marco temporal más alto, sino también mostrar ambos, el marco temporal del gráfico MÁS el marco temporal más alto: MOSTRANDO ZONAS ANIDADAS. A todos
Quantum Breakout Indicator PRO
Bogdan Ion Puscasu
4.96 (26)
Introduciendo       Quantum Breakout PRO   , el innovador indicador MQL5 que está transformando la forma en que comercia con Breakout Zones. Desarrollado por un equipo de operadores experimentados con experiencia comercial de más de 13 años,   Quantum Breakout PRO   está diseñado para impulsar su viaje comercial a nuevas alturas con su innovadora y dinámica estrategia de zona de ruptura. El indicador de ruptura cuántica le dará flechas de señal en las zonas de ruptura con 5 zonas objetivo de
FX Power MT4 NG
Daniel Stein
5 (8)
Obtenga su actualización diaria del mercado con detalles y capturas de pantalla a través de nuestro Morning Briefing aquí en mql5 y en Telegram ! FX Power MT4 NG es la nueva generación de nuestro popular medidor de fuerza de divisas, FX Power. ¿Y qué ofrece este medidor de fuerza de nueva generación? Todo lo que le encantaba del FX Power original PLUS Análisis de fuerza de ORO/XAU Resultados de cálculo aún más precisos Períodos de análisis configurables individualmente Límite de cálculo persona
Presentamos ON Trade Waves Patterns Harmonic Elliot Wolfe, un indicador avanzado diseñado para detectar diversas formas de patrones en el mercado mediante métodos tanto manuales como automáticos. A continuación, te explicamos cómo funciona: Patrones Armónicos: Este indicador puede identificar patrones armónicos que aparecen en tu gráfico. Estos patrones son esenciales para los traders que practican la teoría del trading armónico, tal como se popularizó en el libro de Scott Carney "Harmonic Tradi
Entry Points Pro
Yury Orlov
4.7 (224)
Este es un genial indicador para MT4 que ofrece señales precisas para entrar en una transacción sin redibujar. Se puede aplicar a cualquier activo financiero: fórex, criptomonedas, metales, acciones, índices. Nos dará valoraciones bastante precisas y nos dirá cuándo es mejor abrir y cerra una transacción. Eche un vistazo  al vídeo  (6:22), ¡contiene un ejemplo de procesamiento de una sola señal que ha amortizado el indicador! La mayoría de los tráders mejoran sus resultados comerciales durante l
Antes que nada, vale la pena enfatizar que este Sistema de Trading es un Indicador No Repintado, No Redibujado y sin Retardos, lo que lo hace ideal para el trading profesional. El "Sistema de Trading de Soporte y Resistencia Inteligente" es un indicador avanzado diseñado para traders nuevos y experimentados. Empodera a los traders con precisión y confianza en el mercado de divisas. Este sistema integral combina más de 7 estrategias, 10 indicadores y varios enfoques de trading, incluyendo estr
TakePropips Donchian Trend Pro
Eric John Pajarillaga Aldana
4.82 (17)
¡TakePropips Donchian Trend Pro   (MT4) es una herramienta poderosa y efectiva que detecta automáticamente la dirección de la tendencia utilizando el Canal Donchian y le proporciona señales comerciales de entrada y salida! Este indicador multifunción incluye un escáner de tendencias, señales comerciales, panel estadístico, filtro, sesiones comerciales y panel de historial de alertas. ¡Está diseñado para proporcionarle señales comerciales y ahorrarle horas analizando los gráficos! Puede descargar
Presentación del Indicador Zeus: Tu Última Herramienta para Romper con las Ganancias en el Trading. Este indicador simplifica el trading, eliminando la necesidad de un análisis profundo con estrategias de ruptura. Dibuja automáticamente zonas basadas en tus marcos de tiempo preestablecidos, sugiere niveles de Stop Loss (SL), Take Profit (TP) y Trailing Stop. El Indicador Zeus te notificará de inmediato y mostrará flechas de señal cuando el precio se acerque a los puntos de entrada de compra o ve
FX Volume
Daniel Stein
4.6 (35)
Obtenga su actualización diaria del mercado con detalles y capturas de pantalla a través de nuestro Morning Briefing aquí en mql5 y en Telegram ! FX Volume es el PRIMER y ÚNICO indicador de volumen que proporciona una visión REAL del sentimiento del mercado desde el punto de vista de un bróker. Proporciona una visión impresionante de cómo los participantes institucionales del mercado, como los brokers, están posicionados en el mercado Forex, mucho más rápido que los informes COT. Ver esta info
Quantum Heiken Ashi PRO MT4
Bogdan Ion Puscasu
4.43 (7)
Introduciendo el       Gráficos   Quantum Heiken Ashi PRO Diseñadas para brindar información clara sobre las tendencias del mercado, las velas Heiken Ashi son reconocidas por su capacidad para filtrar el ruido y eliminar las señales falsas. Diga adiós a las confusas fluctuaciones de precios y dé la bienvenida a una representación gráfica más fluida y confiable. Lo que hace que Quantum Heiken Ashi PRO sea realmente único es su fórmula innovadora, que transforma los datos de velas tradicionales en
Cycle Sniper
Elmira Memish
4.41 (34)
NEW YEAR SALE PRICE FOR LIMITED TIME!!! Please contact us after your purchase and we will send you the complimentary indicators to complete the system Cycle Sniper is not a holy grail but when you use it in a system which is explained in the videos, you will feel the difference. If you are not willing to focus on the charts designed with Cycle Sniper and other free tools we provide, we recommend not buying this indicator. We recommend watching the videos about the indiactor and system before pu
RelicusRoad Pro
Relicus LLC
4.78 (139)
Ahora $ 147 (aumentando a $ 499 después de algunas actualizaciones) - Cuentas ilimitadas (PC o Mac) Manual de usuario de RelicusRoad + Videos de capacitación + Acceso al grupo privado de Discord + Estado VIP UNA NUEVA MANERA DE VER EL MERCADO RelicusRoad es el indicador comercial más poderoso del mundo para divisas, futuros, criptomonedas, acciones e índices, y brinda a los comerciantes toda la información y las herramientas que necesitan para mantenerse rentables. Brindamos análisis téc
GOLD Impulse with Alert
Bernhard Schweigert
4.56 (9)
Este indicador es una super combinación de nuestros 2 productos Advanced Currency IMPULSE with ALERT  +   Currency Strength Exotics . ¡Funciona para todos los marcos de tiempo y muestra gráficamente el impulso de fuerza o debilidad para las 8 divisas principales más un Símbolo! Este Indicador está especializado en mostrar la aceleración de la fuerza de la divisa para cualquier símbolo como Oro, Pares Exóticos, Materias Primas, Índices o Futuros. Es el primero de su clase, cualquier símbol
Gann Signal
Kirill Borovskii
Gann Signal is a very simple indicator at first glance, but hidden inside is many years of experience in studying W.D.Ganna methods. The indicator gives accurate BUY/SELL signals, without redrawing. The indicator is very easy to use. All you need to do is attach it to your chart and follow its recommendations. The indicator constantly analyzes the market for entry opportunities. When such an opportunity appears, the indicator gives a signal in the form of an arrow. I repeat, all signals are NOT
Currency Strength Exotics
Bernhard Schweigert
4.88 (33)
¡ACTUALMENTE 20% DE DESCUENTO ! ¡La mejor solución para cualquier operador novato o experto! Este indicador está especializado en mostrar la fuerza de la divisa para cualquier símbolo como Pares Exóticos, Materias Primas, Índices o Futuros. Es el primero de su clase, cualquier símbolo se puede añadir a la 9 ª línea para mostrar la verdadera fuerza de la moneda de Oro, Plata, Petróleo, DAX, US30, MXN, TRY, CNH etc. Se trata de una herramienta de trading única, de alta calidad y asequible por
CONGESTION BREAKOUT PRO This indicator scans the breakout of congestion zones . This indicator unlike any other congestion indicator you will find in the market right now,  it uses an advanced algorithm not peculiar to most traditional congestion indicators available today . The advanced algorithm used to define the congestions  is greatly responsible for the high rate real congestion zones and low rate fake congestion zones spotted by this product. UNDERSTANDING CONGESTION Congestion are
Indicador Th3Eng PipFinite PRO Este producto se diferencia de Th3Eng PipFinite Original, utilizando una lógica y algoritmos diferentes. El indicador Th3Eng PipFinite Pro analiza las direcciones de tendencia utilizando algoritmos personalizados. Muestra la dirección de la tendencia, puntos de entrada, un punto de stop loss y tres puntos de take profit. El indicador también muestra puntos de pivote, canales dinámicos de soporte y resistencia y una caja lateral con información detallada sobre la s
Reversal Sniper
Elmira Memish
5 (3)
Reversal Sniper is designed to find the extreme reversals of the price. Indicator collects data of Cycle Sniper Indicator. NOTE: REVERSAL SNIPER Indicator is made for Cycle Sniper Users as an additional tool.  However, it can be used by the traders who look for finding out strong reversal levels. Indicator works on all timeframes and all instruments. Reversal  Sniper  Checks: Harmonic Patterns RSI Zig Zag and Harmonic Swings Cycle Sniper Indicator's Buy / Sell Signals The complex algo i
This Indicator does not repaint itself at all, it's identifies a new TREND in the bud, this indicator examines the volatility, volumes and momentum to identify the moment in which there is an explosion of one or more of these data and therefore the moment in which prices have strong probability of following a new TREND. CandleBarColorate never misses a beat, he always identifies a new TREND in the bud without error. This indicator facilitates the reading of charts on METATRADER; on a single wi
Ultimate Sniper Dashboard
Hispraise Chinedum Abraham
4.84 (25)
¡Descuento de 299 $! ¡Los precios pueden aumentar en el futuro! ¡Lea la descripción a continuación! Mejor Sistema de Entrada para Ultimate Sniper Dashboard: ULTIMATE DYNAMIC LEVELS. (Por favor, compruebe mis productos) El Ultimate Sniper Dashboard SÓLO funciona en mercados en vivo debido a los límites de prueba multidivisa de MT4. ¡Presentamos el Ultimate Sniper Dashboard! Nuestro mejor que contiene tanto HA-Sniper, MA-Sniper. y muchos modos especiales. ¡El Ultimate Sniper Dashboard es
Otros productos de este autor
Today is the Day
Alexander Shienkov
5 (2)
This simple information indicator shows the name of the current day and past working days, months and years. On the concept of time and timeframe It is common knowledge that a timeframe is a time interval considered in technical analysis of free financial markets, during which the price and other market data changes occur when the price charts are plotted. In the MetaTrader 4 trading terminal, these periods are separated by vertical dashed line, which can be enabled or disabled by simply press
FREE
Open Day and ATR
Alexander Shienkov
Информационный индикатор, показывающий самые важные торговые уровни для внутридневной торговли, и не только. О понятии уровней «Поддержка» и «Сопротивление». Всем известно, что исторический ценовой диапазон цен состоит из уровней от которых в прошлом, были значимые движения. И уровни работающие в прошлом, наверняка будут работать и сейчас. К примеру, уровень, находящийся снизу текущей цены является уровнем «Поддержки», если от него ранее было значительное движение. К примеру, уровень,
Indicator of vertical lines on the timeframes М5 and М1. It draws the lines for the period of the current day and the previous day. This indicator visualizes visually shows the trader the beginning and end of the chart hour, as well as the past hourly periods, 30-minute and 5-minute chart intervals. The advantage provided by this indicator is that the trader using this indicator on a chart of a currency pair with the smaller timeframe will always be aware of when the new hour begins. On the co
FREE
Spread and Cost pips
Alexander Shienkov
5 (3)
It is another simple information indicator. This indicator shows the current spread of a financial instrument and the value of one point with a volume of 0.10 lot. About the Spread Spread is the difference between the Ask and the Bid price of an asset in the stock or currency exchange. Let's refer to Central Banks and currency exchange in these banks, in order to understand why Spread is so important in currency trading. In Central Banks, we always see the difference between the buying and the
FREE
Opening Candle Time
Alexander Shienkov
5 (2)
A simple information indicator showing the time left before the opening of the next candlestick or bar. About the concept of a timeframe A timeframe is the time interval considered in the technical analysis of free financial markets (the same applies to the global currency market), during which the price and other market data change. The smallest timeframe is the so-called tick. A timeframe is the time interval used to group quotes when drawing elements of a price chart (bars, Japanese candles
FREE
Indicator of the Margin Call, Stop Out and Plus 100 (one hundred percent of profit to the deposit) levels. It has been designed to better visualize and maintain money management when trading financial instruments. The levels drawn by the indicator have different colors. They visualize the price range, at which a broker generates a notification (Margin Call) and force closes the deals (Stop Out) due to the shortage of funds on the account, in case the price goes against the positions opened by a
An indicator of round levels. A range of important price levels with sound and text alerts, which are generated when the current Bid price of a currency pair is equal to a round number. This indicator visually shows the trader true support and resistance levels, which are used by most of traders and trading robots. The advantage provided by this indicator is that the trader using this indicator on a chart does not need to draw any additional levels. Round price levels represent a certain barrier
Doji Marker Point
Alexander Shienkov
This indicator shows the levels and signal dots of the Doji pattern. The indicator allows traders to easily determine possible location of a price rebound. Doji is a candlestick with Open and Close price equal, or almost equal. It should also have shadows of approximately the same size on both sides. Doji denotes the balance between buyers and sellers, or the absence of major players, or level testing. This pattern can mean both a reversal and a continuation of the trend. Indicator Parameters
This indicator visualizes the intersection of two moving averages. (SМА, EMA, SMMA, LWMA). It has been created for visibility of signals and notification about intersections of Moving Average. Moving Average is simply the averaged value of the price for the selected timeframe (TF). Therefore, the moving averages are used on a wide variety of timeframes, from 1 minute to a year and even decades. Possible types of moving averages in the indicator SMA (Simple Moving Average); EMA (Exponential Mo
This indicator visualizes the intersection of two moving averages in the MACD oscillator. It uses the histogram color to signal about the moving averages crossing the zero level of the indicator. The MACD (Moving Average Convergence/Divergence) indicator is a popular oscillator actively used by traders when working in the currency and stock markets to determine trends and to search for trading signals. This linear indicator allows obtaining a variety of trading signals: crossing the zero line; d
Folding rule of 4 trend lines The indicator has been created based on the "Folding rule" trading strategy. It shows four pairs of inclined resistance and support lines. These lines are plotted based on the nearest High and Low of the ZigZag technical indicator with four given input parameters. The indicator draws dots above and below the price extremums that have been used for plotting the trend lines. The indicator of trend lines facilitates the plotting of trend lines, channels and technical p
Kiss III EMA
Alexander Shienkov
Индикатор динамического уровня сопротивления и поддержки Moving Average. Визуально показывает момент прикосновение цены Bid , одной или трёх скользящих средних с   заданными во входных параметрах свойствами. Создан для наглядности сигналов и оповещения состоявшегося пересечения (прикосновения) цены Bid и Moving Average. Скользящая средняя — это просто усредненное значение цены за выбранный период времени, он же таймфрейм (ТФ). Именно поэтому скользящие используются на самых разнообразных
Open High Low Close Внешняя Свеча Индикатор внешних свечей наложенных на график с выбранными вами тайм фреймом. Наглядно отображаете уровни OHLC и пройденное значение ATR текущей свечи и свечей в истории. OHLC — аббревиатура, дословно расшифровывается как: O — open (цена открытия интервала (бара или японской свечи)). H — high (максимум цены интервала). L — low (минимум цены интервала). C — close (цена закрытия интервала). Данный индикатор наглядно покажет трейдеру, уровень открыт
ATR Sessions Pips
Alexander Shienkov
Ещё один простой информационный индикатор, показывающий самые важные торговые сессии валютного рынка. О понятии торговых сессий. Всем известно, что торговая сессия – это промежуток времени, в течение которого банки и другие участники рынка ведут активную торговлю, при этом активизируются   в определённые часы рабочего дня. Валютный рынок, рынки акций и сырьевые рынки   работают круглосуточно с понедельника по пятницу, кроме праздничных дней. Когда в одной стране ещё спят, в другой рабочи
Risk Manager VT
Alexander Shienkov
Risk Manager VT Робот - помощник, от команды VT. О рискменеджменте в торговле: Грамотный риск менеджмент в трейдинге – это залог успеха при решении основных Ваших задач, при активной ручной торговле, на биржевом рынке: дисциплина и контроль эмоций! Данный помощник поможет вам с лёгкостью ограничивать риски на каждую сделку, и правильно выставить уровни прибылей. Те кто долго торгуют, на валютном рынке, уже знают, что правильное соотношение риск/прибыль, является эффективным инструме
History VT
Alexander Shienkov
History VT Информационный индикатор. Показывает на графике, сразу после открытия сделки, стрелку именно на той японской свече, где позиция открыта. То есть там, где появилась штрихпунктирная линия открытой сделки, в терминале. Далее, после открытия сделки, как обычно, трейдер ставит SL и TP  и ждёт итога своего выбора направления движения. После того как сделка закрылась, по « sl » или « tp » или «вручную», индикатор отображает на графике уровни и текстовые сноски параметров сделки. С
Filtro:
Spirit77
32
Spirit77 2020.08.08 20:03 
 

пользуюсь несколько месяцев. удобный и простой помощник,можно всё подстроить под себя. самое главное для меня это автоматическая отрисовка ближайших уровней и переключение всех настроенных окон одним кликом! ни разу не пожалел о покупке, Александру огромный респект!!! спасибо!

Respuesta al comentario
Versión 4.1 2024.01.08
1. Обновлённый билд 2024г.
Versión 4.0 2022.06.08
Обновлено до билд 2022г.
Versión 3.0 2019.11.28
1. Исправлена ошибка отключения алерта уровня открытия дня сегодняшнего.
2. Добавлен уровень открытия позавчерашнего дня, его high\low и экстремумы вчерашнего дня.
3. Добавлены ценовые метки на всех горизонтальных уровнях индикатора.
4. Колонка ATR(td) показывает оставшиеся пункты до АТР (сегодня).
Versión 2.0 2019.02.04
ATR info panel Open Day (версия 2)

В индикатор таблицу, постоянно меняющихся значений, пройденных ценой пунктов от начало дня (D1), от начала
недели (W1) и от начала текущего месяца (MN). Добавлены ещё и ячейки значений количества пунктов пройденных
ценой, с открытия следующих тайм фреймов (М5), (М15), (М30), (Н1), (Н4).

Колонка названий валютных инструментов теперь является, кнопками переключения всех дополнительных открытых
графиков в торговой платформе, именно на тот валютный инструмент, который вы выбрали, нажав на название.

Добавлены уровни (отрезки) со звуковым, и текстовым уведомлением (алертом):

-Уровень открытия дня;

-Уровень прохождения ценой, среднедневного АТР (по умолчанию за 10 дней), в ту или иную сторону. С выделенными
жёлтым цветом зонами сверх АТР. При прохождении ценой АТР за выбранный период, цвет прямоугольника меняется;

-Уровень открытия предыдущего дня, но без алерта;

Примечание 1: При подходе цены Bid (в предела двух пунктов) к данным уровням, цвет ячейки (D1) и (ATR(td), по
инструменту, меняется. Тем самым визуально сообщая подход к уровню. А при прикосновении сработает алерт
(текстовый и звуковой), когда значение данных ячеек будет 0.

Примечание 2: Значение колонки ATR(10) меняется лишь при смене количества дней для расчёта среднедневного АТР,
во входных параметрах индикатора. По умолчанию: 10.
Примечание 3: Красные значения в ячейках колонок тайм фреймов со знаком минус, сообщают нам о том, что с
открытия тайм фрейма (периода) цена идёт sell.
Зелёная ячейка говорит нам о восходящем направлении с открытия тайм фрейма.

Примечание 4: Во входных параметрах есть возможность отключения всей таблицы. Оставив лишь уровни открытия
дней и уровни значений АТР.
Стили, цвета и толщины данных уровней также можно менять во входных параметрах индикатора, по собственному
усмотрению.