PZ Swing Trading MT5
- Indicadores
- PZ TRADING SLU
- Versión: 6.2
- Actualizado: 27 abril 2021
- Activaciones: 20
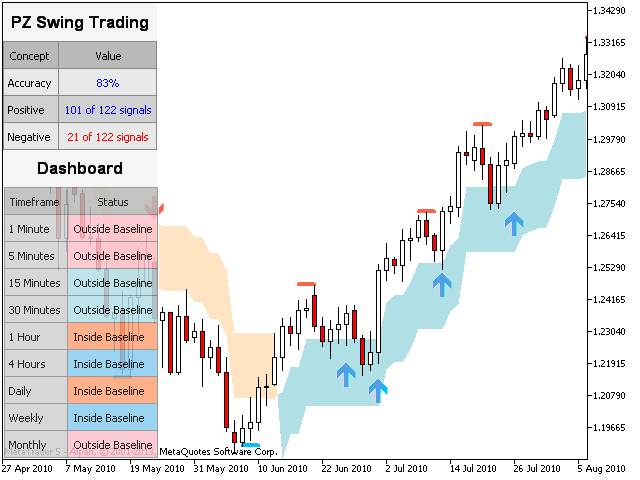
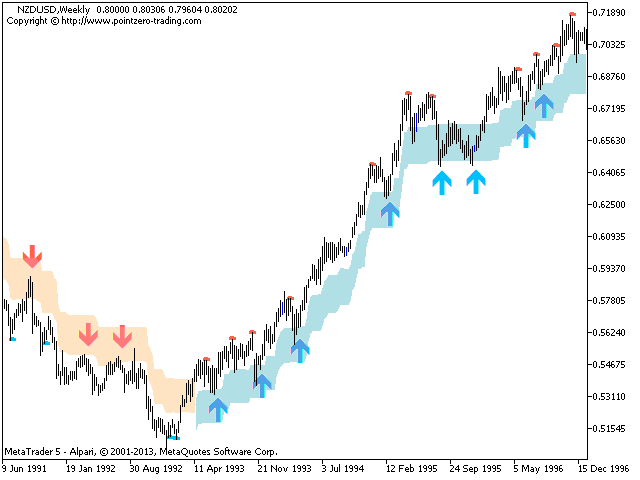
Swing Trading es el primer indicador diseñado para detectar oscilaciones en la dirección de la tendencia y posibles oscilaciones de reversión. Utiliza el enfoque de intercambio de línea de base, ampliamente descrito en la literatura comercial. El indicador estudia varios vectores de precios y tiempos para rastrear la dirección de la tendencia agregada y detecta situaciones en las que el mercado está sobrevendido o sobrecomprado y listo para corregir.
[ Guía
de instalación | Guía
de actualización | Solución
de problemas | FAQ
| Todos
los productos ]
- Beneficio por cambios en el mercado sin ser aturdido
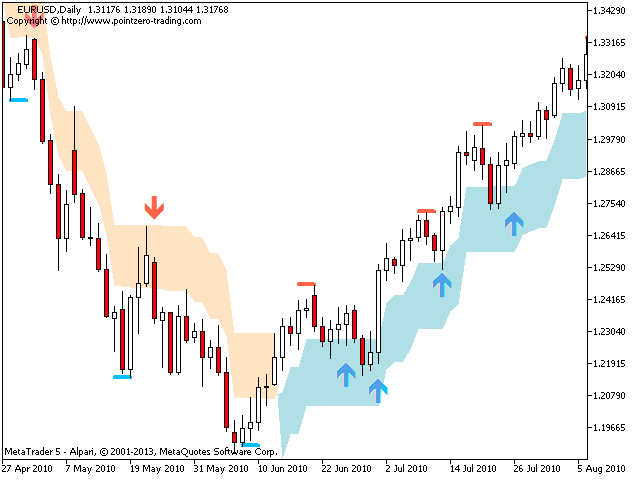
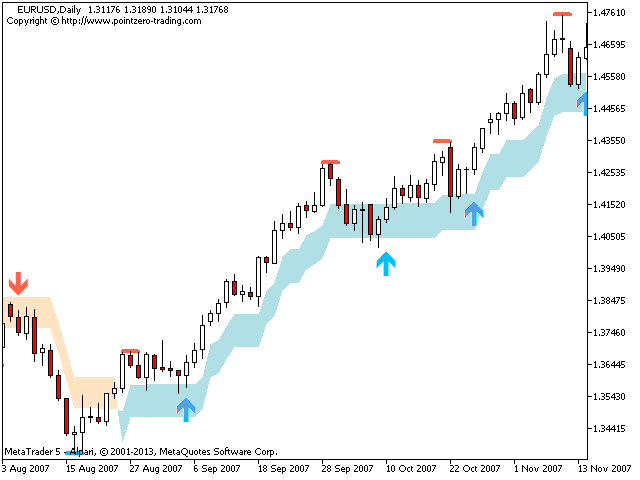
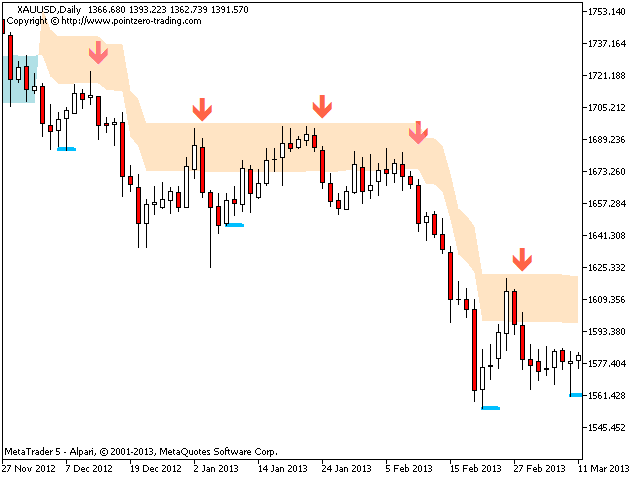
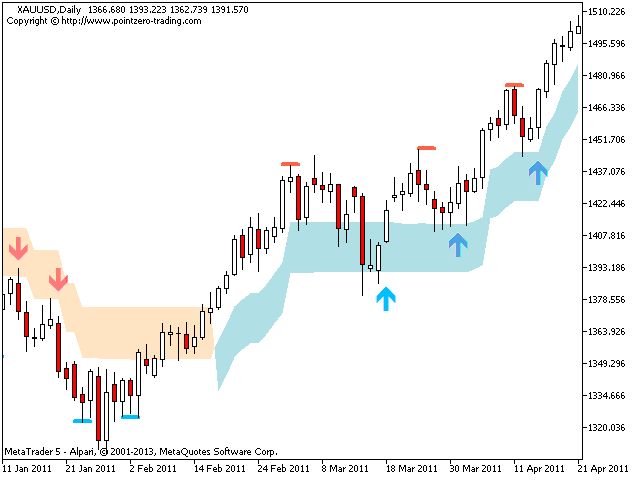
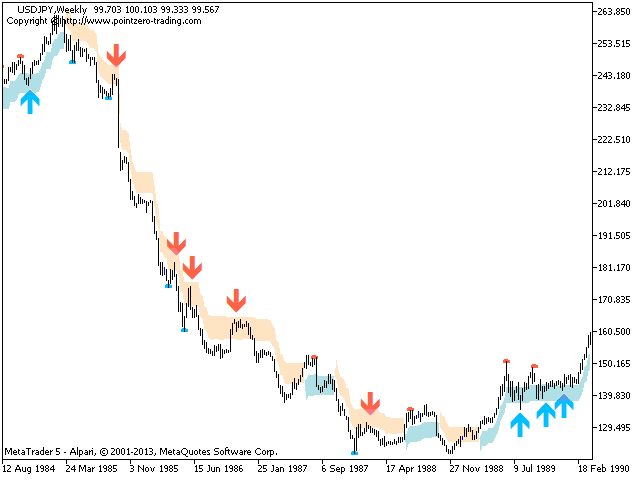
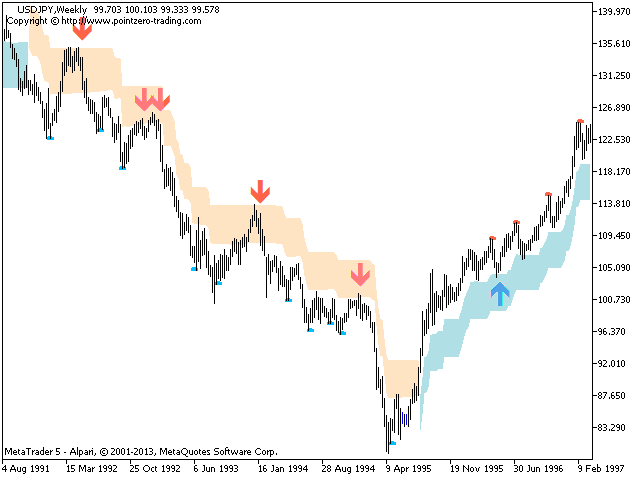
- El indicador muestra la dirección de la tendencia en todo momento.
- Una banda de precios coloreada representa la línea de base de oportunidad
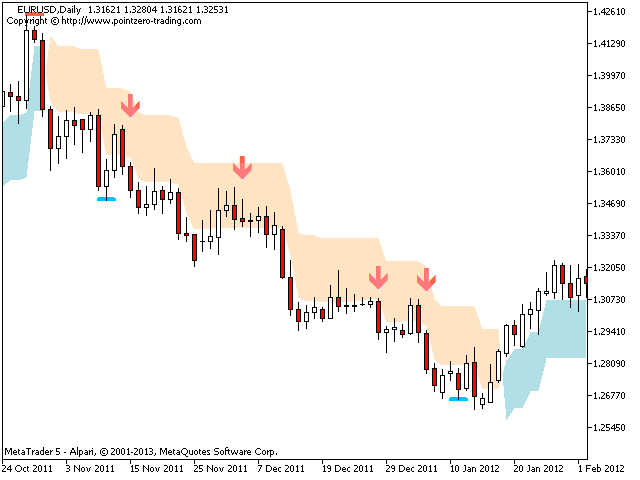
- Los guiones de colores representan posibles cambios de inversión.
- El indicador analiza su propia calidad y rendimiento.
- Implementa un tablero de múltiples marcos de tiempo
- Tendencias personalizables y períodos de swing
- Implementa alertas por correo electrónico / sonido / push
- El indicador no se repinta ni se pinta
¿Qué es el Swing Trading?
Swing Trading es un estilo de negociación que intenta capturar ganancias en un valor dentro de un día a una semana, aunque algunas operaciones pueden mantenerse vivas por más tiempo. Los operadores de swing utilizan el análisis técnico para comprar debilidad y vender fuerza, y tienen la paciencia para esperar a que estas oportunidades sucedan, porque tiene más sentido comprar un valor después de que haya ocurrido una ola de ventas en lugar de quedar atrapado en una venta masiva.
Parámetros de entrada
- Periodo de tendencia: este parámetro controla la sensibilidad a los cambios de tendencia. Un gran período de tendencia conducirá a capturar tendencias más largas. Un período de tendencia pequeño conducirá a la captura de tendencias más cortas, pero a un reconocimiento más rápido de los cambios de tendencia.
- Período de referencia: este parámetro controla la sensibilidad de la referencia. El período para la línea de base siempre debe estar por debajo del período de tendencia. Increméntelo para comerciar usando una banda de oportunidad más grande y disminuya para hacerlo más pequeño.
- Mostrar señales de oscilación: habilite este parámetro para mostrar flechas cuando el precio retroceda a la línea de base y salga de ella.
- Mostrar correcciones: habilite este parámetro para mostrar guiones de colores cuando la tendencia comience a corregirse.
- Mostrar el panel de control: active este parámetro para ver el panel de marco de tiempo múltiple en el gráfico.
- Mostrar estadísticas: habilite este parámetro para mostrar el panel de estadísticas en el gráfico.
- Configuración de dibujo: elija sus propios colores y tamaños para las flechas y los guiones inversos.
- Alertas: habilite las alertas de pantalla / correo electrónico / push / sonido para patrones.
Autor
Arturo López Pérez, inversor privado y especulador, ingeniero de software y fundador de Point Zero Trading Solutions.

I like it. I prefer it on longer time frames and as Arturo says, use an oscillator to verify signals; which will further improve the base line efficiency score (frequently in the region of 80%).
Note: This is the first review since the recent update Feb 2019.
26/04/21: Indicator has been updated. Appreciate the continued support for this product.