• Información general
  • Comentarios (24)
  • Discusión (346)
  • Novedades

AnyProfile MT5

5

The indicator displays market profiles of any duration in any place on the chart.

Simply create a rectangle on the chart and this rectangle will be automatically filled by the profile. Change the size of the rectangle or move it - the profile will automatically follow the changes.


Operation features


The indicator is controlled directly from the chart window using the panel of buttons and fields for entering parameters.

In the lower right corner of the chart window there is a pop-up "AP" button of the main menu, which is conditionally divided into two halves - clicking on the left half switches groups of control buttons, clicking on the right half switches groups of fields for entering parameters.

The indicator properties window contains, basically, only input variables related to the settings of colors, fonts size, line thickness, and so on.

The indicator remembers the settings (button status and numeric field values) individually for each timeframe.

The description of the indicator controls is on the "Comments" tab in post 293 of 21/11/2021.


Comentarios 20
Chris Pool
89
Chris Pool 2022.10.22 17:53 
 

Hello Traders, if you are looking for an indicator that will help you find sniper entries, then look no further. AnyProfile (Volume Profile, and so much more!) will help you follow big institutions as they are not able to hide their footprints. Volume is often overlooked or underused, but it is the only true indication of where big institutions are building their positions. Candle patterns, trendlines, S&R, S&D, inducement, etc. are created by big institutions to take your money (mostly algos, which is why they are often so precise), but they can't manipulate volume and you can bet they will defend their positions. AnyProfile can assist you in trading with the big institutions and not against them. I never place a trade without consulting it first. You will find that this is the only indicator that you will want on your charts. Go get it!

Daniel Christian Haehner
133
Daniel Christian Haehner 2022.08.25 11:56 
 

Where i can get the anyprofile 2.0?

znyazo
47
znyazo 2022.07.21 08:08 
 

the guy is quick to respond and offers solutions that work. you are amazing my guy and your indicator is super dope :)

Productos recomendados
Was: $249  Now: $99   Market Profile defines a number of day types that can help the trader to determine market behaviour. A key feature is the Value Area, representing the range of price action where 70% of trading took place. Understanding the Value Area can give traders valuable insight into market direction and establish the higher odds trade. It is an excellent addition to any system you may be using. Inspired by Jim Dalton’s book “Mind Over Markets”, this indicator is designed to suit the
BoxChart MT5
Evgeny Shevtsov
5 (7)
The market is unfair if only because 10% of participants manage 90% of funds. An ordinary trader has slim changes to stand against these "vultures". This problem can be solved. You just need to be among these 10%, learn to predict their intentions and move with them. Volume is the only preemptive factor that faultlessly works on any timeframe and symbol. First, the volume appears and is accumulated, and only then the price moves. The price moves from one volume to another. Areas of volume accumu
Order Book, known also as Market Book, market depth, Level 2, - is a dynamically updated table with current volumes of orders to buy and to sell specific financial instument at price levels near Bid and Ask. MetaTrader 5 provides the means for receiving market book from your broker, but in real time only, without access to its history. The indicator OrderBook Cumulative Indicator accumulates market book data online and visualizes them on the chart. In addition, the indicator can show the market
El indicador construye cotizaciones actuales, que se pueden comparar con las históricas y, sobre esta base, hacer un pronóstico de movimiento de precios. El indicador tiene un campo de texto para una navegación rápida a la fecha deseada. Opciones: Símbolo - selección del símbolo que mostrará el indicador; SymbolPeriod - selección del período del cual el indicador tomará datos; IndicatorColor - color del indicador; HorisontalShift: cambio de cotizaciones dibujadas por el indicador
This is a multi-symbol and multi-timeframe table-based indicator designed for a candlestick patterns detection with 46 patterns for META TRADER 5. Each formation has own image for easier recognition. Here you find most popular formations such as "Engulfing", "Hammer", "Three Line Strike", "Piercing" or Doji - like candles. Check my full list of patterns on my screenshots below. Also you can not only switch all bearish or bullish patterns from input, but also select formation for a specified symb
VolumeDeltaBars
Stanislav Korotky
This indicator is a conventional analytical tool for tick volumes changes. It calculates tick volumes for buys and sells separately, and their delta on every bar, and displays volumes by price clusters (cells) within a specified bar (usually the latest one). The algorithm used internally is the same as in the indicator VolumeDeltaMT5 , but results are shown as cumulative volume delta bars (candlesticks). Analogous indicator for MetaTrader 4 exists - CumulativeDeltaBars . This is a limited substi
Trading Utility for Forex Currency Pairs Only not for Gold  Functions Auto Lot Calculation based on Risk Auto stoploss  Auto TakeProfit Breakeven Auto Close Half % Close in percentage with respect to the PIPs Pending Orders BuyLimit Sell Limit with distances BuyStop Sell Stop    with distances Trading Informations Risk in percentage For Multiple trades Combine Takeprofit and Combine Stoplosses
Este producto le ayudará a comprar con beneficio y usar dos productos más populares para el análisis de los volúmenes de las peticiones y operaciones en los mercados de equidad: Actual Depth of Market Chart Actual Tick Footprint Volume Chart Este producto ha integrado toda la potencia de cada uno de los indicadores y se ofrece como un archivo único. Las rebajas anticrisis. ¡Hoy el precio del producto está rebajado! ¡Dese prisa! Las capacidades funcionales del producto Actual COMBO Depth of Mark
Blahtech Supply Demand MT5
Blahtech Limited
4.57 (14)
Was: $299  Now: $99   Supply Demand uses previous price action to identify potential imbalances between buyers and sellers. The key is to identify the better odds zones, not just the untouched ones. Blahtech Supply Demand indicator delivers functionality previously unavailable on any trading platform. This 4-in-1 indicator not only highlights the higher probability zones using a multi-criteria strength engine, but also combines it with multi-timeframe trend analysis, previously confirmed swings
Wapv Price and volume
Eduardo Da Costa Custodio Santos
El indicador de precio y volumen WAPV para MT5 es parte del conjunto de herramientas (Wyckoff Academy Wave Market) y (Wyckoff Academy Price and Volume). El indicador de precio y volumen WAPV para MT5 se creó para facilitar la visualización del movimiento del volumen en el gráfico de forma intuitiva. Con ella podrás observar los momentos de pico de volumen y momentos en los que el mercado no tiene interés profesional Identificar momentos en los que el mercado se mueve por inercia y no por movimie
Noize Absorption Index - is the manual trading system that measures the difference of pressure between bears forces and bulls forces. Green line - is a noize free index that showing curent situation. Zero value of index shows totally choppy/flat market.Values above zero level shows how powerfull bullish wave is and values below zero measures bearish forces.Up arrow appears on bearish market when it's ready to reverse, dn arrow appears on weak bullish market, as a result of reverse expectation.
Tick Chart — full-featured chart for MetaTrader 5. A utility for creating and working with a tick chart in the MetaTrader 5 terminal. You can create a tick chart that works exactly the same as a regular chart. You can apply indicators, Expert Advisors and scripts to the tick chart. You get a fully functional tick chart on which you can work just as well as on a regular chart. You can enable the output of the Ask price data. The data are generated in the form of the upper shadow of a tick bar. Fr
Renko Plus
Eadvisors Software Inc.
With Renko Plus you can use the features in the Indicator functionality, just add it to the Metatrader5 chart.             The Renko chart is a type of chart, developed by the Japanese, that is constructed using price movement rather than standardized prices and time intervals like most charts. It is believed to be named after the Japanese word for bricks, "renga", as the graphic looks like a series of bricks.             A new brick is created when the price moves a specified p
This new unique indicator Actual tick footprint (volume chart) is developed for using on Futures markets, and it allows seeing the volume of real deals right when they are performed. The indicator Actual tick footprint (volume chart) represents a greatly enhanced tick chart that includes additional information about the volume of deal performed at a specific price. In addition, this unique indicator for MetaTrader 5 allows to clearly detecting a deal type – buy or sell. Alike the standard tick c
Owl Smart Levels MT5
Sergey Ermolov
4.47 (36)
Versión MT4  |  FAQ El Indicador Owl Smart Levels es un sistema comercial completo dentro de un indicador que incluye herramientas de análisis de mercado tan populares como los fractales avanzados de Bill Williams , Valable ZigZag que construye la estructura de onda correcta del mercado y los niveles de Fibonacci que marcan los niveles exactos de entrada. en el mercado y lugares para tomar ganancias. Descripción detallada de la estrategia Instrucciones para trabajar con el indicador Asesor de c
UPD1 Profile Levels MT5
Vitaliy Kuznetsov
5 (3)
El indicador encuentra los niveles de volumen de precio máximo y mínimo (perfil de mercado) en el gráfico de barras de trabajo para el número especificado de barras.   Perfil compuesto. La altura del histograma es completamente automática y se adapta a cualquier instrumento y marco de tiempo. Se utiliza un algoritmo de autor y no repite análogos conocidos. La altura de los dos histogramas es aproximadamente igual a la altura promedio de la vela. La alerta inteligente le ayudará a informar sobre
This indicator provides an original mix of WPR, VSA, and volume delta. It shows ratio of buy/sell volumes scaled on 100% range based on total volume change for a selected period. The convetional VSA (Volume Spread Analysis) studies interconnections of price action and volume change in absolute values, whereas WPR (Williams Percent Range) offers a convenient approach of price moves normalization into the fixed percentage metric: 0 - 100%. Hence overbough and oversold states are easily spotted. N
¡El nivel Premium es un indicador único con más del 80% de precisión de predicciones correctas! ¡Este indicador ha sido probado por los mejores especialistas en comercio durante más de dos meses! ¡El indicador del autor no lo encontrarás en ningún otro lugar! ¡A partir de las capturas de pantalla, puede ver por sí mismo la precisión de esta herramienta! 1 es ideal para operar con opciones binarias con un tiempo de vencimiento de 1 vela. 2 funciona en todos los pares de divisas, accion
This is visualization tool based on the Depth of Market. It works with the symbols that have the Depth of Market available. It's a visual indicator that shows the volume of each Bid/Ask price and ratio of total volume of Bids/Asks. Note: check if your broker supports DOM before purchasing. 。。。。。。。。。。。。。。。。。。。。。。。。。。。。。。。。。。。。。。。。。。。。。。。。。。。 。。。。。。。。。。。。。。。。。。。。。。。。。。。。。。。。。。。。。。。。。。。。。。。。。。。
POC level MT5
Mikhail Nazarenko
The indicator automatically calculates       and displays the level of the maximum       real   volume Point Of Control (POC) of the Market Profile for the   array of candles   highlighted by a rectangular area. This will significantly increase the accuracy of your position entries when trading POC bounces and reversals. Attention when testing the demo version!   In the MT5 strategy tester , there is no possibility of dragging a rectangle and this is a problem of limitations of the MT5 strategy
This is a multi timeframe version of the  Supply and Demand indicator . It allows you to analyze a chart using the law of supply and demand on three different timeframes at a time. You will see zones of sales and purchases and determine the most profitable points to open positions. The indicator is based on the principle of market fractality. Supply and demand zones show places where a strong buyer or seller has made the price reverse and change its direction. The indicator has several types of
Fixed Range Volume Profile MT5
Abdelkhabir Yassine Alaoui
2 (1)
Perfil de volumen de rango fijo automático con alertas para MT5 Este indicador muestra dónde ha pasado más tiempo el precio, destacando niveles importantes que se pueden utilizar en el comercio. y puede mostrar la densidad de precios a lo largo del tiempo, destacando los niveles de precios más importantes, el área de valor y el valor de control de una sesión de negociación determinada. Este indicador se puede adjuntar a marcos de tiempo entre M1 y D1 y mostrará el perfil de mercado para ses
An indicator of patterns #24, #25, #26 and #27 ("Head and Shoulders", "Complex Head and Shoulders") from Encyclopedia of Chart Patterns by Thomas N. Bulkowski. Parameters: Alerts - show alert when an arrow appears   Push - send a push notification when an arrow appears (requires configuration in the terminal) PeriodBars - indicator period K - an additional parameter that influences the accuracy of pattern shape recognition. The smaller the value is, the smoother the row of peaks/valleys shoul
Bear Bull
Ignacio Agustin Mene Franco
Bear Bull ! es un indicador que marca con velas heikin ashi pero modificado , las ventas y compras  a largas y cortas tendencia !  con 2 colores  verde marca la compra ,  violeta marca la venta ,  sirve para cualquier tipo de temporalidad ,  sirve para los mercados de forex y indices sinteticos !  ideal para cualquier par , tambien sirve para los pares de crypto ,  Buen Profit ! World Inversor -
VolumeProfile MT5
Robert Hess
3.75 (8)
Description: The Volume Profile displays detailed informations of historical trading activities at certain price levels (Market Profile). Locate the areas with the best prices in the market and get an advantage over other market participants. Support: The indicator is constantly being developed and improved. Please do not hesitate to contact me via the MQL5 Platform. I am very grateful about any Bug report, so that i can constantly improve the indicator. I appreciate any public review for this
BoxInside MT5
Evgeny Shevtsov
5 (4)
This indicator calculates the volume profile and places labels that correspond to the VAH, VAL and POC levels, for each candle individually. Indicator operation features The indicator works on the timeframes from M3 to MN, but it uses the history data of smaller periods: M1 - for periods from M3 to H1, M5 - for periods from H2 to H12, M30 - for the D1 period, H4 - for the W1 period, D1 - for the MN period. The color and location of the VAL, VAH and POC labels on the current candle are consider
FREE
A machine translation from the English product description was used. We apologize for possible imprecisions. Se utilizó una traducción automática de la descripción del producto en inglés. Pedimos disculpas por posibles imprecisiones. Un sistema de visualización de patrones de acción de precios de velas japonesas favoritas. Una vez adjunto, el indicador marcará automáticamente los siguientes patrones en el gráfico: Barra de Pinocho (pinbar)  - una barra de cuerpo pequeño con una 'nariz' larga, un
SafeProfit Market Profile es el indicador de seguimiento más avanzado del mercado Forex. Fue desarrollado para rastrear el perfil de mercado de cada sesión del día: asiático, europeo y americano. Con este indicador operarás Intradía sonriendo ... sabiendo exactamente dónde están posicionados los Big Players y el momento exacto hacia donde se dirigen. El indicador es simple, rápido y objetivo, rastreando cada movimiento de los Grandes Jugadores en precio. Salga de la estadística del 95% que solo
AW Candle Patterns
AW Trading Software Limited
El indicador de patrones de velas AW es una combinación de un indicador de tendencia avanzado combinado con un potente escáner de patrones de velas. Es una herramienta útil para reconocer y resaltar los treinta patrones de velas más fiables. Además, es un analizador de tendencias actual basado en barras de colores con un       panel de tendencias de múltiples marcos de tiempo que se puede cambiar de tamaño y posicionar. Una capacidad única para ajustar la visualización de patrones según el filtr
Esta herramienta profesional de los mejores corredores de bolsa ahora está disponible en la plataforma MetaTrader 5 . El indicador Actual depth of market chart visualiza la Profundidad del Mercado (DOM, por sus siglas en inglés) en forma del histograma que se coloca en el gráfico del precio y se actualiza en tiempo real. ¡Atención! ¡La actualización reciente ha sido hecha a petición de nuestros usuarios! Ahora el indicador Actual Depth of Market visualiza la relación actual de los volúmenes de
Los compradores de este producto también adquieren
Atomic Analyst MT5
Issam Kassas
3.64 (11)
En primer lugar, vale la pena enfatizar que este Indicador de Trading no repinta, no redibuja y no se retrasa, lo que lo hace ideal tanto para el trading manual como para el automatizado. El Analista Atómico es un Indicador de Acción del Precio PA que utiliza la fuerza y el impulso del precio para encontrar una mejor ventaja en el mercado. Equipado con filtros avanzados que ayudan a eliminar ruidos y señales falsas, y aumentan el potencial de trading. Utilizando múltiples capas de indicadores
Primero que todo, vale la pena enfatizar que este Sistema de Trading es un Indicador No Repintado, No Redibujado y No Retrasado, lo que lo hace ideal tanto para el trading manual como para el automatizado. El "Sistema de Trading Inteligente MT5" es una solución completa de trading diseñada para traders nuevos y experimentados. Combina más de 10 indicadores premium y presenta más de 7 estrategias de trading robustas, lo que lo convierte en una opción versátil para diversas condiciones del merca
Quantum Trend Sniper
Bogdan Ion Puscasu
5 (37)
Introduciendo       Indicador Quantum Trend Sniper   , el innovador indicador MQL5 que está transformando la forma en que identificas y negocias los cambios de tendencia. Desarrollado por un equipo de comerciantes experimentados con experiencia comercial de más de 13 años,       Indicador de francotirador de tendencia cuántica       está diseñado para impulsar su viaje comercial a nuevas alturas con su forma innovadora de identificar cambios de tendencia con una precisión extremadamente alta.
Trend Screener Pro MT5
STE S.S.COMPANY
4.89 (61)
Desbloquee el poder del comercio de tendencias con el indicador Trend Screener: ¡su solución definitiva para el comercio de tendencias impulsada por lógica difusa y un sistema multidivisa!Mejore su comercio de tendencias con Trend Screener, el revolucionario indicador de tendencias impulsado por lógica difusa. Es un poderoso indicador de seguimiento de tendencias que combina más de 13 herramientas y funciones premium y 3 estrategias comerciales, lo que lo convierte en una opción versátil para co
FX Volume MT5
Daniel Stein
4.94 (17)
Obtenga su actualización diaria del mercado con detalles y capturas de pantalla a través de nuestro Morning Briefing aquí en mql5 y en Telegram ! FX Volume es el PRIMER y ÚNICO indicador de volumen que proporciona una visión REAL del sentimiento del mercado desde el punto de vista de un bróker. Proporciona una visión impresionante de cómo los participantes institucionales del mercado, como los brokers, están posicionados en el mercado Forex, mucho más rápido que los informes COT. Ver esta info
FX Power MT5 NG
Daniel Stein
5 (4)
Obtenga su actualización diaria del mercado con detalles y capturas de pantalla a través de nuestro Morning Briefing aquí en mql5 y en Telegram ! FX Power MT5 NG es la nueva generación de nuestro popular medidor de fuerza de divisas, FX Power. ¿Y qué ofrece este medidor de fuerza de nueva generación? Todo lo que le encantaba del FX Power original PLUS Análisis de fuerza de ORO/XAU Resultados de cálculo aún más precisos Períodos de análisis configurables individualmente Límite de cálculo persona
Ante todo, vale la pena enfatizar que esta Herramienta de Trading es un Indicador No Repintado, No Redibujado y No Retrasado, lo que la hace ideal para el trading profesional. El Indicador de Conceptos de Acción del Precio Inteligente es una herramienta muy potente tanto para traders nuevos como experimentados. Combina más de 20 indicadores útiles en uno solo, combinando ideas avanzadas de trading como el Análisis del Trader del Círculo Interior y Estrategias de Trading de Conceptos de Dinero
Advanced Supply Demand MT5
Bernhard Schweigert
4.53 (15)
¡Actualmente con 33% de descuento! ¡La mejor solución para cualquier tráder principiante o experto! Este indicador es una herramienta comercial única, de alta calidad y asequible, porque incorpora una serie de características patentadas y una nueva fórmula. Con esta actualización, podrá mostrar zonas de doble marco temporal. No solo podrá mostrar un marco temporal más alto, sino también mostrar ambos, el marco temporal del gráfico MÁS el marco temporal más alto: MOSTRANDO ZONAS ANIDADAS. A todos
RelicusRoad Pro MT5
Relicus LLC
4.81 (21)
Ahora $ 147 (aumentando a $ 499 después de algunas actualizaciones) - Cuentas ilimitadas (PC o Mac) Manual de usuario de RelicusRoad + Videos de capacitación + Acceso al grupo privado de Discord + Estado VIP UNA NUEVA MANERA DE VER EL MERCADO RelicusRoad es el indicador comercial más poderoso del mundo para divisas, futuros, criptomonedas, acciones e índices, y brinda a los comerciantes toda la información y las herramientas que necesitan para mantenerse rentables. Brindamos análisis téc
XQ Indicator MetaTrader 5
Marzena Maria Szmit
5 (1)
Step into the realm of Forex trading with confidence and precision using XQ, a cutting-edge Forex indicator designed to elevate your trading game to unprecedented heights. Whether you're a seasoned trader or just stepping into the world of currency exchange, XQ Forex Indicator empowers you with the insights and signals needed to make informed trading decisions. The signal conditions are a combination of three indicators, and XQ Forex Indicator only display  medium and long-term trends . The ind
The Volume by Price Indicator for MetaTrader 5 features Volume Profile and Market Profile TPO (Time Price Opportunity). Get valuable insights out of currencies, equities and commodities data. Gain an edge trading financial markets. Volume and TPO histogram bar and line charts. Volume Footprint charts. TPO letter and block marker charts including split structures. Versatile segmentation and compositing methods. Static, dynamic and flexible ranges with relative and/or absolute visualizations. Lay
Introduciendo       Quantum Breakout PRO   , el innovador indicador MQL5 que está transformando la forma en que comercia con Breakout Zones. Desarrollado por un equipo de comerciantes experimentados con experiencia comercial de más de 13 años,       Desglose cuántico PRO       está diseñado para impulsar su viaje comercial a nuevas alturas con su innovadora y dinámica estrategia de zona de ruptura. El indicador de ruptura cuántica le dará flechas de señal en las zonas de ruptura con 5 zonas
Este es un genial indicador para MT5 que ofrece señales precisas para entrar en una transacción sin redibujar. Se puede aplicar a cualquier activo financiero: fórex, criptomonedas, metales, acciones, índices. Nos dará valoraciones bastante precisas y nos dirá cuándo es mejor abrir y cerra una transacción. Eche un vistazo  al vídeo  (6:22), ¡contiene un ejemplo de procesamiento de una sola señal que ha amortizado el indicador! La mayoría de los tráders mejoran sus resultados comerciales durante l
ICT, SMC, SMART MONEY CONCEPTS, SMART MONEY, Smart Money Concept, Support and Resistance, Trend Analysis, Price Action, Market Structure, Order Blocks, BOS/CHoCH,   Breaker Blocks ,  Momentum Shift,   Supply&Demand Zone/Order Blocks , Strong Imbalance,   HH/LL/HL/LH,    Fair Value Gap, FVG,  Premium  &   Discount   Zones, Fibonacci Retracement, OTE, Buy Side Liquidity, Sell Side Liquidity, BSL/SSL Taken, Equal Highs & Lows, MTF Dashboard, Multiple Time Frame, BigBar, HTF OB, HTF Market Structure
AW Trend Predictor MT5
AW Trading Software Limited
4.76 (54)
La combinación de niveles de tendencia y ruptura en un sistema. Un algoritmo de indicador avanzado filtra el ruido del mercado, determina la tendencia, los puntos de entrada y los posibles niveles de salida. Las señales indicadoras se registran en un módulo estadístico, que le permite seleccionar las herramientas más adecuadas, mostrando la efectividad del historial de señales. El indicador calcula las marcas Take Profit y Stop Loss. Manual e instrucciones ->   AQUÍ   / Versión MT4 ->   AQUÍ Có
Auto Order Block with break of structure based on ICT and Smart Money Concepts Futures Break of Structure ( BoS )             Order block ( OB )            Higher time frame Order block / Point of Interest ( POI )    shown on current chart           Fair value Gap ( FVG ) / Imbalance   ,  MTF      ( Multi Time Frame )    Volume Imbalance     ,  MTF          vIMB Gap’s Equal High / Low’s     ,  MTF             EQH / EQL Liquidity               Current Day High / Low           HOD /
El Indicador de Cuadrados de Gann es una herramienta poderosa de análisis de mercado basada en el artículo "Fórmula Matemática para Predicciones de Mercado" escrito por W.D. Gann, que se basa en conceptos matemáticos para el análisis. Incorpora elementos de las técnicas de Gann relacionadas con los cuadrados de 144, 90 y 52, así como el cuadrado de 9. Además, incluye el método del  sobre cómo combinar el cuadrado de 9 con canales y patrones de estrellas. Manual del Usuario y Modo de Uso: Antes d
TrendMaestro5
Stefano Frisetti
note: this indicator is for METATRADER4, if you want the version for METATRADER5 this is the link:  https://www.mql5.com/it/market/product/108106 TRENDMAESTRO recognizes a new TREND in the bud, he never makes mistakes. The certainty of identifying a new TREND is priceless. DESCRIPTION TRENDMAESTRO identifies a new TREND in the bud, this indicator examines the volatility, volumes and momentum to identify the moment in which there is an explosion of one or more of these data and therefore the mome
Conviértase en un Breaker Trader y obtenga beneficios de los cambios en la estructura del mercado a medida que se invierte el precio. El indicador de ruptura de bloque de órdenes identifica cuándo una tendencia o movimiento de precio se acerca al agotamiento y está listo para revertirse. Le alerta sobre cambios en la estructura del mercado que generalmente ocurren cuando una reversión o un retroceso importante están a punto de suceder. El indicador utiliza un cálculo patentado que identific
Trend Line Map Pro MT5
STE S.S.COMPANY
4.67 (9)
El indicador Trend Line Map es un complemento para Trend Screener Indicator. Funciona como un escáner para todas las señales generadas por el evaluador de tendencias (Trend Line Signals). Es un escáner de líneas de tendencia basado en el indicador de evaluación de tendencias. Si no tiene el indicador Trend Screener Pro, Trend Line Map Pro no funcionará. It's a Trend Line Scanner based on Trend Screener Indicator. If you don't have Trend Screener Pro Indicator,     the Trend Line Map Pro will
TrendLine PRO MT5
Evgenii Aksenov
4.78 (49)
El indicador Trend Line PRO es una estrategia comercial independiente. Muestra el cambio de tendencia, el punto de entrada a la transacción, así como calcula automáticamente tres niveles de Take Profit y la protección contra la pérdida de Stop Loss Trend Line PRO es perfecto para todos los símbolos de Meta Trader: monedas, metales, criptomonedas, acciones e índices Ventajas de Trend Line PRO: Nunca vuelve a dibujar sus señales Posibilidad de utilizar como estrategia independiente Tiene tres niv
TPSpro TRENDPRO  - is a trend indicator that automatically analyzes the market and provides information about the trend and each of its changes, as well as giving signals for entering trades without redrawing! The indicator uses each candle, analyzing them separately. referring to different impulses - up or down impulse. Exact entry points into transactions for currencies, crypto, metals, stocks, indices!  -  Version MT4                  DETAILED DESCRIPTION        /       TRADING SETUPS       
Gartley Hunter Multi
Siarhei Vashchylka
5 (5)
Gartley Hunter Multi - An indicator for searching for harmonic patterns simultaneously on dozens of trading instruments and on all classic timeframes: (m1, m5, m15, m30, H1, H4, D1, Wk, Mn). Manual (Be sure to read before purchasing) | Version for MT4 Advantages 1. Patterns: Gartley, Butterfly, Shark, Crab. Bat, Alternate Bat, Deep Crab, Cypher 2. Simultaneous search for patterns on dozens of trading instruments and on all classic timeframes 3. Search for patterns of all possible sizes. Fr
Black Dragon indicator mt5
Ramil Minniakhmetov
4.82 (56)
El indicador de detección de tendencias complementará cualquier estrategia y también se puede utilizar como una herramienta independiente. Ventajas Fácil de usar, no sobrecarga el gráfico con información innecesaria; Puede usarse como filtro para cualquier estrategia; Tiene niveles integrados de soporte y resistencia dinámicos, que se pueden usar tanto para obtener ganancias como para establecer límites de pérdidas; El indicador no cambia de color después de que se cierra la vela;  Funciona
Golden Spikes Detector
Batsirayi L Marango
5 (1)
Golden Spikes Detector Este indicador se basa en una estrategia avanzada principalmente para negociar picos en índices de auge y caída. Se implementaron algoritmos complejos para detectar únicamente entradas de alta probabilidad. Alerta sobre posibles entradas de Compra y Venta. Para negociar picos en el corredor Deriv o Binary, solo acepte las alertas Buy Boom y Sell Cash. Se optimizó para cargarse en un período de tiempo de 5 minutos, aunque se realiza un análisis de múltiples períodos de tiem
Matrix Arrow Indicator MT5
Juvenille Emperor Limited
5 (14)
Matrix Arrow Indicator MT5   es una tendencia única 10 en 1 que sigue un indicador   100% sin repintado   de marcos temporales múltiples que se puede usar en todos los símbolos/instrumentos:   divisas ,   materias primas ,   criptomonedas ,   índices ,   acciones .  Matrix Arrow Indicator MT5  determinará la tendencia actual en sus primeras etapas, recopilando información y datos de hasta 10 indicadores estándar, que son: Índice de movimiento direccional promedio (ADX) Índice de canales de prod
Smart Peak Bottom
Xiaoyu Huang
5 (2)
Este es un indicador claro para juzgar máximos y mínimos, y funciona bien para el mercado Oscilante. Precio promocional 49$ → 59$ características bueno para juzgar los mejores y los peores Sin redibujar, sin deriva Cálculo rápido, sin retrasos Modo de recordatorio enriquecido Se pueden ajustar múltiples parámetros y colores. parámetro "======== Principal ========" PeriodoAltoBajo1 = 9 PeriodoAltoBajo2 = 60 PeriodoAltoBajo3 = 34 HighLowEMAPeriod = 4 MASignalPeriod = 5 "======== Notificar =
IX Power MT5
Daniel Stein
5 (2)
IX Power   lleva por fin la insuperable precisión de FX Power a los símbolos que no son de Forex. Determina con exactitud la intensidad de las tendencias a corto, medio y largo plazo de tus índices, acciones, materias primas, ETF e incluso criptodivisas favoritas. Puede   analizar todo lo   que su terminal le ofrece. Pruébalo y experimenta cómo   tu timing mejora significativamente   a la hora de operar. Características principales de IX Power Resultados de cálculo 100% precisos y sin rep
Account Graph MT5
Kyra Nickaline Watson-gordon
5 (1)
An indicator to draw a graph of account current and historical state such as Balance, Equity, Margin, Free Margin, Margin Level, Drawdown, Account Profit, Deposit and Withdrawals. Indicator Inputs : Draw Balance Graph Draw Equity Graph Draw Margin Graph Draw Free Margin Graph Draw Margin Level Graph Draw Drawdown Graph Draw Account Profit Graph Hide Data on Chart and Buffers Connect Gaps by Lines Sign of DDs on Profit Sign of DDs on Loss Tips : The Indicator will draw historical balance gra
Golden Gate Algo MT5
James David Lane
4 (6)
¡40% DE DESCUENTO PARA NAVIDAD! ¡AUMENTO DE PRECIO A $250 EL 1 DE ENERO! Presentamos GoldenGate Entries: ¡Una Solución de Trading de Vanguardia! Descubre un enfoque revolucionario para el trading con GoldenGate Entries (GGE), un indicador avanzado diseñado para elevar tu experiencia de trading. GGE proporciona un conjunto completo de características para capacitar a los usuarios con precisión y confianza en sus decisiones comerciales. Pares: Cualquiera (FX - Materias primas - Acciones - A
Otros productos de este autor
The balance of supply and demand is a simple and effective market analysis method. The supply and demand diagram can show you in advance, even before the trend reversal, where the supply ends and the demand is already emerging, where the demand ends and the supply is emerging, while substantially increasing the probability of making a deal in the right direction and with a high profit factor. Indicator Signals The indicator uses the price/volume values to generate signals: ED – excess demand.
Cumulative Delta MT5
Evgeny Shevtsov
4.47 (57)
The indicator analyzes the volume scale and splits it into two components - seller volumes and buyer volumes, and also calculates the delta and cumulative delta. The indicator does not flicker or redraw, its calculation and plotting are performed fairly quickly, while using the data from the smaller (relative to the current) periods. The indicator operation modes can be switched using the Mode input variable: Buy - display only the buyer volumes. Sell - display only the seller volumes. BuySell -
FREE
Smart Depth Of Market
Evgeny Shevtsov
4.2 (20)
The indicator displays the orders book, as well as increases its depth, remembering the location of orders that have gone beyond the current "window" view. Indicator capability Display the levels of open positions. Simulation of placing/cancelling/editing pending orders directly in the displayed orders book. Indicator features The orders book display works only on those trading symbols for which it is broadcast by the broker. To reset the information about the rows that were recorded in the
FREE
Cumulative Delta MT4
Evgeny Shevtsov
4.69 (35)
The indicator analyzes the volume scale and splits it into two components - seller volumes and buyer volumes, and also calculates the delta and cumulative delta. The indicator does not flicker or redraw, its calculation and plotting are performed fairly quickly, while using the data from the smaller (relative to the current) periods. The indicator operation modes can be switched using the Mode input variable: Buy - display only the buyer volumes. Sell - display only the seller volumes. BuySell -
FREE
BoxProfile MT5
Evgeny Shevtsov
4.56 (9)
The indicator displays volume profiles based on the nesting principle. Profiles periods are pre-set so that each subsequent profile has a length twice as long as the length of the previous profile. In addition to profiles, the indicator displays volume clusters sorted by color, depending on the volume they contain. Indicator operation features The indicator works on typical timeframes from M5 to MN, but for calculations uses historical data from smaller timeframes: M1 - for timeframes from M5
FREE
Clusters Chart MT5
Evgeny Shevtsov
5 (7)
The indicator displays volume clusters or volume profiles to choose from. For trading symbols which contain the tape of deals, the indicator can perform calculations based on the tape of deals. Input variables StepPoint  - cluster step in points, if the value is zero, the step is assigned automatically. HistoryTicks  - size of tick history (for VolumeType in the mode TimeAndSales). AssociatedTimeframe  - binding the indicator to the specified timeframe of the chart, if the value is equal to
AnyProfile MT4
Evgeny Shevtsov
5 (23)
The indicator displays market profiles of any duration in any place on the chart. Simply create a rectangle on the chart and this rectangle will be automatically filled by the profile. Change the size of the rectangle or move it - the profile will automatically follow the changes. Operation features The indicator is controlled directly from the chart window using the panel of buttons and fields for entering parameters. In the lower right corner of the chart window there is a pop-up "AP" butt
BoxChart MT5
Evgeny Shevtsov
5 (7)
The market is unfair if only because 10% of participants manage 90% of funds. An ordinary trader has slim changes to stand against these "vultures". This problem can be solved. You just need to be among these 10%, learn to predict their intentions and move with them. Volume is the only preemptive factor that faultlessly works on any timeframe and symbol. First, the volume appears and is accumulated, and only then the price moves. The price moves from one volume to another. Areas of volume accumu
Clusters Chart MT4
Evgeny Shevtsov
5 (4)
The indicator displays volume clusters or volume profiles to choose from. Input variables StepPoint  - cluster step in points, if the value is zero, the step is assigned automatically. AssociatedTimeframe  - binding the indicator to the specified timeframe of the chart, if the value is equal to Current, the indicator works on all timeframes. ClustersVolume  - volume in clusters: All  - all volume. Active  - active volume (which produced the price movement). ClustersAsDelta  - difference betw
BoxInside MT5
Evgeny Shevtsov
5 (4)
This indicator calculates the volume profile and places labels that correspond to the VAH, VAL and POC levels, for each candle individually. Indicator operation features The indicator works on the timeframes from M3 to MN, but it uses the history data of smaller periods: M1 - for periods from M3 to H1, M5 - for periods from H2 to H12, M30 - for the D1 period, H4 - for the W1 period, D1 - for the MN period. The color and location of the VAL, VAH and POC labels on the current candle are consider
FREE
BoxProfile MT4
Evgeny Shevtsov
4.8 (15)
The indicator displays volume profiles based on the nesting principle. Profiles periods are pre-set so that each subsequent profile has a length twice as long as the length of the previous profile. In addition to profiles, the indicator displays volume clusters sorted by color, depending on the volume they contain. Indicator operation features The indicator works on typical timeframes from M5 to MN, but for calculations uses historical data from smaller timeframes: M1 - for timeframes from M5
FREE
FORTS Trading Data
Evgeny Shevtsov
3.67 (3)
The indicator has been designed for use on FORTS, but it can also work on other markets, at brokers broadcasting the required data. A peculiarity of these data is that they cannot be requested from the broker's server as a section of history, but can only be obtained for the current moment. The indicator periodically requests the broker, collects to a file and displays the following history from the stored file: The weighted average price. The volume of buy pending orders. The volume of sell pen
FREE
BoxInside MT4
Evgeny Shevtsov
4.56 (9)
This indicator calculates the volume profile and places labels that correspond to the VAH, VAL and POC levels, for each candle individually. Indicator operation features The indicator works on the timeframes from M5 to MN, but it uses the history data of smaller periods: M1 - for periods from M5 to H1, M5 - for the H4 period, M30 - for the D1 period, H4 - for the W1 period, D1 - for the MN period. The color and location of the VAL, VAH and POC labels on the current candle are considered to be
FREE
The utility refers to probabilistic analysis tools, in particular the Monte Carlo method. The Monte Carlo method is defined as the simulation of processes in purpose to evaluate their probabilistic characteristics and apply them to the solvable task. Operation features The simulation uses a tick model with the subsequent transformation to the candles form, as a model as close as possible to the real market process. The utility generates a stream of a random tick sequence until a result with th
The utility displays the order book, as well as increases its depth, remembering the location of applications that have gone beyond the current "window" view. With the utility user can perform quick trading actions in one click - placing/cancelling/editing of explicit and hidden orders, and also opening/editing positions. Utility features The orders book display works only on those trading symbols for which it is broadcast by the broker. To reset the information about the rows that were record
Neural Predictor MT4
Evgeny Shevtsov
2 (1)
The indicator refers to the means of probabilistic analysis. Prediction is performed by the Monte Carlo method together with a mathematical model of a neuron. But, the modeling of samples for this method is made not artificially, but comes from the original "nature", that is, from history. The number of samples and the detail of their modeling is achieved using the lower (relative current) timeframe. Indicator algorithm : In general terms, the algorithm boils down to the fact that the ind
BoxChart MT4
Evgeny Shevtsov
4.57 (7)
The market is unfair if only because 10% of participants manage 90% of funds. An ordinary trader has slim changes to stand against these "vultures". This problem can be solved. You just need to be among these 10%, learn to predict their intentions and move with them. Volume is the only preemptive factor that faultlessly works on any timeframe and symbol. First, the volume appears and is accumulated, and only then the price moves. The price moves from one volume to another. Areas of volume accumu
Time And Sales Delta
Evgeny Shevtsov
5 (2)
The indicator displays the delta and the cumulative delta based on the "Time & Sales" deals list data. In addition to the standard timeframes, the indicator displays data regarding the seconds timeframes (S5, S10, S15, S20, S30) to choose from. Using the rectangle, user can select an arbitrary area in the indicator subwindow to view the ratio of the volumes of deals of buyers and sellers within this area. Indicator features: The indicator works correctly only on those trading symbols for whi
Market Marker MT4
Evgeny Shevtsov
4.5 (8)
The indicator displays peak levels of activity formed by the maximum volume, tracks the correlation of the candles on all timeframes (from the highest to the lowest one). Each volume level is a kind of key trading activity. The most important cluster is inside a month, week, day, hour, etc. Indicator operation features A volume level receives Demand status if the nearest volume level located to the left and above has been broken upwards. A volume level receives Supply status if the nearest vol
The indicator calculates volume profiles dynamically and displays the result as VAL, VAH and POC curves. Indicator features The indicator uses the historical data of the lower (relative to the current) timeframes for calculations: M1 - for timeframes up to H1, M5 - for timeframe H1, M15 - for timeframe H4, H1 - for timeframe D1, H4 - for timeframe W1, D1 - for timeframe MN. The color of the DPOC curve sections is determined by comparing the volume of the POC levels of all profiles that make up
Market Marker MT5
Evgeny Shevtsov
3.8 (5)
The indicator displays peak levels of activity formed by the maximum volume, tracks the correlation of the candles on all timeframes (from the highest to the lowest one). Each volume level is a kind of key trading activity. The most important cluster is inside a month, week, day, hour, etc. Indicator operation features A volume level receives Demand status if the nearest volume level located to the left and above has been broken upwards. A volume level receives Supply status if the nearest vol
The balance of supply and demand is a simple and effective market analysis method. The supply and demand diagram can show you in advance, even before the trend reversal, where the supply ends and the demand is already emerging, where the demand ends and the supply is emerging, while substantially increasing the probability of making a deal in the right direction and with a high profit factor. Indicator signals The indicator uses the price/volume values to generate signals: ED – excess demand.
The utility refers to probabilistic analysis tools, in particular the Monte Carlo method. The Monte Carlo method is defined as the simulation of processes in purpose to evaluate their probabilistic characteristics and apply them to the solvable task. Operation features The simulation uses a tick model with the subsequent transformation to the candles form, as a model as close as possible to the real market process. The utility generates a stream of a random tick sequence until a result with t
Dynamic POC MT5
Evgeny Shevtsov
5 (2)
The indicator calculates volume profiles dynamically and displays the result as VAL, VAH and POC curves. Indicator features The indicator uses the historical data of the lower (relative to the current) timeframes for calculations: M1 - for timeframes up to H1, M5 - for timeframe H1, M15 - for timeframe H4, H1 - for timeframe D1, H4 - for timeframe W1, D1 - for timeframe MN. The color of the DPOC curve sections is determined by comparing the volume of the POC levels of all profiles that make u
The indicator refers to the means of probabilistic analysis. Prediction is performed by the Monte Carlo method together with a mathematical model of a neuron. But, the modeling of samples for this method is made not artificially, but comes from the original "nature", that is, from history. The number of samples and the detail of their modeling is achieved using the lower (relative current) timeframe. Indicator algorithm : In general terms, the algorithm boils down to the fact that the ind
Filtro:
Chris Pool
89
Chris Pool 2022.10.22 17:53 
 

Hello Traders, if you are looking for an indicator that will help you find sniper entries, then look no further. AnyProfile (Volume Profile, and so much more!) will help you follow big institutions as they are not able to hide their footprints. Volume is often overlooked or underused, but it is the only true indication of where big institutions are building their positions. Candle patterns, trendlines, S&R, S&D, inducement, etc. are created by big institutions to take your money (mostly algos, which is why they are often so precise), but they can't manipulate volume and you can bet they will defend their positions. AnyProfile can assist you in trading with the big institutions and not against them. I never place a trade without consulting it first. You will find that this is the only indicator that you will want on your charts. Go get it!

Daniel Christian Haehner
133
Daniel Christian Haehner 2022.08.25 11:56 
 

Where i can get the anyprofile 2.0?

Evgeny Shevtsov
64997
Respuesta del desarrollador Evgeny Shevtsov 2022.08.25 12:15
Perhaps only the "Service Desk" will be able to help you.
But I can't say that for sure.
znyazo
47
znyazo 2022.07.21 08:08 
 

the guy is quick to respond and offers solutions that work. you are amazing my guy and your indicator is super dope :)

long20
29
long20 2022.05.11 06:24 
 

Hello adimin, can u add footprint too?

Evgeny Shevtsov
64997
Respuesta del desarrollador Evgeny Shevtsov 2022.05.11 07:35
Hello.
In the context of trading, the word "footprint" has many interpretations. What exactly do you mean?
However, the "Reviews" tab is not intended for dialogue, and if the question is still relevant, then write on the "Comments" tab.
Kasim Ijelu
453
Kasim Ijelu 2021.12.28 01:58 
 

Simply Excellent

Rodrigo Braz
23
Rodrigo Braz 2021.06.20 03:57 
 

Hola, yo te compre el anydesk v3.5 y al correrlo ahora en mt5 en otra maquina, no funciona.... me puedes ayudar?

Evgeny Shevtsov
64997
Respuesta del desarrollador Evgeny Shevtsov 2021.06.20 19:49
I'm sorry, but I'll answer in English.
I know a little English and if my translator does not translate correctly, I will be able to notice it.
But if I answer in your language, I'm not sure if the translation is correct.
If you run the indicator on another PC (not on the one where you bought the indicator), then licensing is probably required there.
With this question, you should contact the MQL5 Service Desk, because such questions are only within their competence.
If you have any more questions, start the dialogue on the "Comments" tab, as it is more designed for conducting a dialogue than the "Reviews" tab.
Roberto Arlan
117
Roberto Arlan 2021.05.10 23:02 
 

O indicador seria perfeito se não travasse o metatrade, quando abro duas telas lado a lado.

ivanvp2
89
ivanvp2 2021.01.07 14:09 
 

Отличный индюк! Все видно!

Зуфар Исмагилов
31
Зуфар Исмагилов 2020.11.11 09:04 
 

Super!

Raul Bartolamei
56
Raul Bartolamei 2020.09.16 16:08 
 

Hi, would be very nice if we could configure hotkey for types os volume profile (MD)... very good indicator, congratulations!

wsw2000
70
wsw2000 2020.06.23 18:03 
 

Very good indicator: highly flexibile and customizable (there are so many options that it takes sometimes to elarn how to use it well but it is great). This is really a professional Market Profile package, I recommend it. Support is also very fast, polite and accurate. Thank you.

joshuacoppins
31
joshuacoppins 2020.06.18 08:09 
 

Superior Support,Value = 100%,Thx a Lot!

Dan_2pq
31
Dan_2pq 2020.06.10 02:03 
 

One of the best. Thanks to the developer.

rajeshram
224
rajeshram 2020.06.09 12:07 
 

The author Evgeny is very professional and this indicator is a very good one. Thank you!

1600005347
218
1600005347 2019.12.08 15:02 
 

Best one in mt5

CryptoCowboy
78
CryptoCowboy 2019.02.04 19:29 
 

This indicator may have single-handedly placed the metatrader platform as a whole on a new playing field. It simply doesn't get any better than this. The author has thought of everything. Has proven to be absolutely invaluable to my trading.

Onofre Lima
46
Onofre Lima 2019.01.07 02:17 
 

Hi Guy!!

I need help to configure any profile indicator.

israelicc
58
israelicc 2018.09.17 03:00 
 

Hands down, best MKTP on the MQL5!

ViniciusFrg
25
ViniciusFrg 2018.07.03 19:37 
 

The very best volume profile and TPO profile for MT5! :D

slamburger
44
slamburger 2017.05.16 00:40 
 

очень полезная штуковина!

12
Respuesta al comentario
Versión 4.4 2024.04.22
The indicator is recompiled in MT5 build 4275.
Versión 4.3 2024.01.27
The indicator is recompiled in MT5 build 4153.
Versión 4.2 2023.05.23
The indicator is recompiled in MT5 build 3742.
Versión 4.1 2022.12.07
The indicator is recompiled in MT5 build 3531.
Versión 4.0 2022.10.19
Fixed the error of drawing profiles in the opposite direction (in the manual mode of placing profiles using rectangles).
Versión 3.9 2022.05.11
The indicator is recompiled in MT5 build 3285.
Versión 3.8 2021.11.17
The indicator is recompiled in MT5 build 3091.
Versión 3.7 2021.07.06
Using the input variable MainPanelDisappear user can disable the disappearance of the indicator control panel.
Versión 3.6 2021.03.31
The indicator is recompiled in MT5 build 2860.
Versión 3.5 2020.12.01
The indicator is recompiled in MT5 build 2715.
Versión 3.4 2020.10.13
Improved algorithm for checking synchronization of the terminal history with the server history.
The indicator is compiled in MT5 build 2650.
Versión 3.3 2020.06.11
Fixed error of settings of priority OBJPROP_ZORDER.
The indicator is recompiled in MT5 build 2485.
Versión 3.2 2020.05.24
Added display of bars of opening/closing prices of profiles.
The button BV now has several modes:
1. The profile border is disabled, and the value area is marked with strokes.
2. The profile border is disabled, and the value area is marked with border.
3. The profile border is enabled, and the value area is marked with border.
Versión 3.1 2019.11.04
The button PE (Poc extend) has several modes:
1. Display POC levels.
2. Display VAL and VAH levels.
3. Display VAL, VAH and POC levels.
Versión 3.0 2019.10.21
Added the function of accelerated calculation of volume profiles.
The input variable VolumeProfileCalculation has two states:
Normal - normal algorithm for calculating volume profiles.
Fast - accelerated algorithm for calculating volume profiles, with some loss of quality for Delta and MathOI modes on timeframes from H1 and above.
Versión 2.9 2018.07.09
Fixed incorrect coloring of the price area and POC level, when using the TPO profile display mode with the fixed chart scale.
Versión 2.8 2018.05.04
For the summary profile, it is possible to enter the start and end number of the candle instead of the start and end date/time.
Any value not exceeding 1440 will be perceived by the indicator not as a date/time, but as a pointer to the candle number.
Note: the candles are numbered from right to left, starting with one. Accordingly, the number of the initial candle is always greater than the number of the final candle.
Versión 2.7 2018.04.26
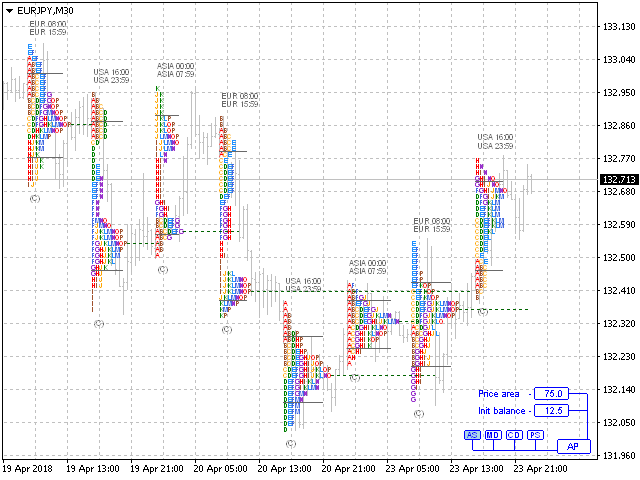
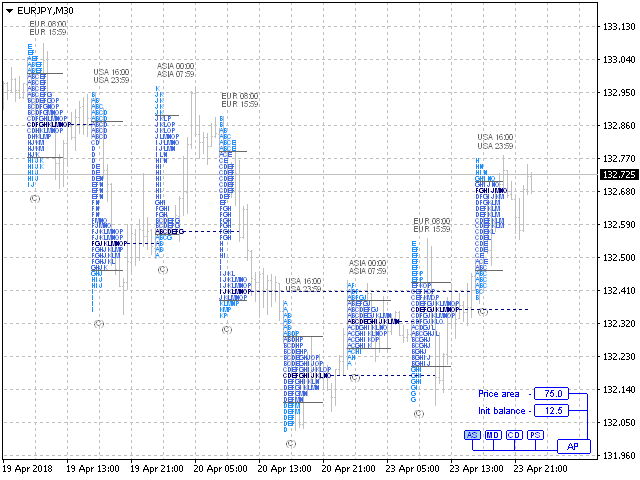
Added a new mode - the classic profile.
Added the RS (reset) button to reset the indicator parameters to their default values.
Added the RT (remaining timeframes) button to apply the indicator parameters from the current timeframe to all other timeframes.
Optimized the algorithm for plotting the profiles to improve its operation speed.
Versión 2.6 2018.04.17
Added the "Period" field for adding an arbitrary period for profile following, from right to left, starting from the current candle.
Added the "PE" button (POC extend), which enables/disables the display of horizontal lines as continuations of POC levels, from left to right, until the intersection with the price chart.
Added the "PA" (POC alert) button, which enables/disables showing signals in Alert boxes in case the price touches any POC level. The signal is generated only for POC levels that had not been previously covered by the price chart.
Note: when installing this version of the indicator, it is necessary to delete all files from the terminal folder …MQL5/Files/AnyProfile.
Versión 2.5 2018.04.09
The indicator management has been moved to buttons.
The pop-up button of the main menu is located in the lower right corner of the chart. It is divided into two halves - pressing on the left half changes the group of control buttons, pressing the right half changes the group of text boxes for entering parameters.
Versión 2.4 2017.12.01
Restored the operability of the ProfileMode input variable for mass modification of profile display modes.
Versión 2.3 2017.10.19
Profile display method can be changed by a double click on a text below the profile.
The indicator remembers selected values separately for each profile of each timeframe.
Versión 2.2 2017.09.13
Modified the startup algorithm of the indicator during the first start of the terminal, for cases when the new candles of quotes history have not been loaded yet.
Versión 2.1 2017.06.15
Price area calculation method is set using the ProfileAreaMode variable, it has two options: AreaOfPocND - mathematical normal distribution based on the POC level, AreaOfTotalVolume - distribution based on the amount of total volume traded in the profile.
The ProfileRectanglePrefix input variable sets the name prefix of the rectangle that will be used by the indicator as a reference.
Versión 2.0 2017.06.06
Displaying the profile as a thin line is now available for all modes. It can be activated using the ProfileLineDrawing input parameter. Width of the line is set using the ProfileLineWidth input parameter.
Versión 1.9 2017.05.18
Fixed an error of a double drawing of labels on profile clusters when changing the vertical chart scale or modifying the time length of the profiles.
Now, in the ProfileAutoSet mode, the last (not closed) profile develops in real time, not at each candlestick opening.
Versión 1.8 2017.03.28
In version 1.8, added the function for automatic placement of profiles - ProfileAutoSet. Using this function allows scrolling the chart in history. The profiles cannot be edited manually in this mode. When this feature is disabled, the profiles are placed in the same location where (and if) they had been created before.
In addition, the indicator displays the volume of each profile as a histogram column at the lower border of the chart window. The column height is automatically adjusted in the aggregate comparison with the volumes of other profiles present on the chart. The display of the volume columns is activated using the VolumeVisible input variable. This function is not performed for the summary profile.
Versión 1.7 2017.02.24
Added multiple new features in the version 1.7:
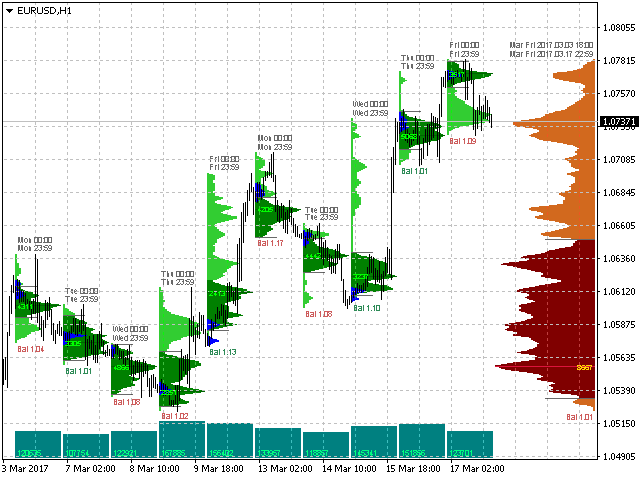
1. Mode of displaying the profile in the form of two lines, separately for buy and sell volumes. In a sense, such display method represents a graph of supply and demand.
2. Mode of open interest, mathematically obtained by successively zeroing the mutually exclusive volumes. Only the volumes not affected by this operation are displayed in the profile. This function is not performed for the summary profile.
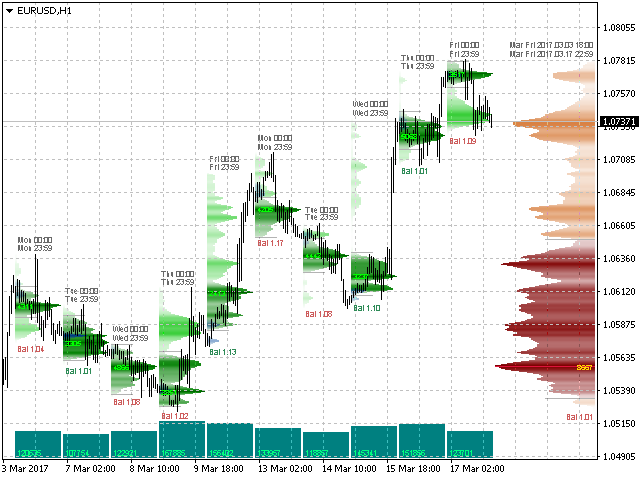
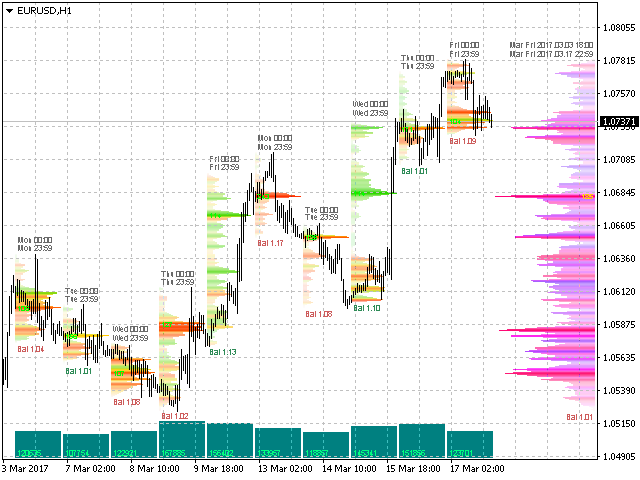
3. The indicator calculates the resulting profile of the balance. The balance is displayed by one number below the profile and it represents the ratio between the buy and sell volumes.
The value of balance is always not less than one. For example, if the balance value is 1.18 and the number is colored in green, this means that the buy volumes exceed sell volumes by 18%. And conversely, if the number is colored in red, this means that the sell volumes exceed the buy volumes by 18%.
If the balance value is equal to or very close to one, this means that the profile is almost balanced, that is, the buy are very close or equal to the sell volumes.
4. By default, the balance and delta are calculated in terms of market orders. The new ProfileDeltaReverse function activates the calculation mode in terms of limit orders.
Versión 1.6 2016.10.14
Improved algorithm for calculating the color difference delta.
Set the profile in such a way as to capture the beginning and the end of the trend, and you will see clearly enough the green layers of buyers and the red layers of sellers within this trend.
Versión 1.5 2016.07.22
Fixed negative values at profile clusters if the volume is too high.
Versión 1.4 2016.07.11
Added the ability to select the type of the volumes (tick or real) used in the terminal to the indicator. If your broker broadcasts the values of real volumes to the MT5, set the value of the input variable RealVolumes=true, in this case, the indicator will use the real volumes in its calculations.
Versión 1.3 2016.06.07
Added three new functions:
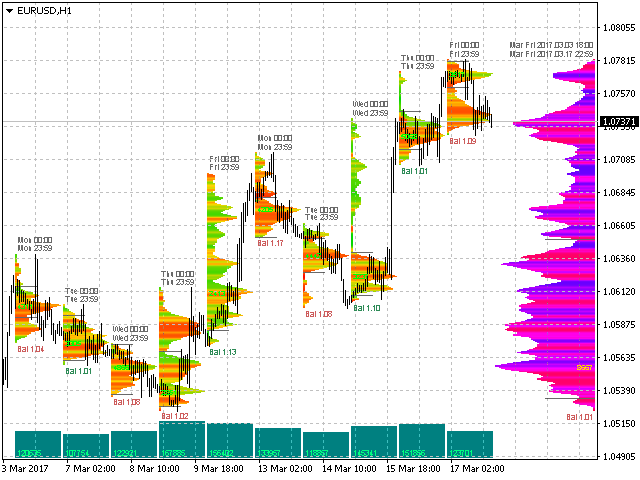
ProfileImbalance - in this mode, not simply the volume profile is displayed, but the profile of the difference between the volumes of buyers and the volumes of sellers, that is the delta profile.
ProfileInitBalance - in this mode, the profile of the initial balance is displayed inside the mail profile. This profile is calculated based on the data, the capture range of which is set as a percentage of the total length of the main profile, from left to right, starting from the beginning of the main profile. For example, if the main profile has a length of 8 hours, then the value of 12.5% is equivalent to 1 hour of the initial balance. The color of the initial balance profile is set using the ProfileInitBalanceColor variable. This function is not performed for the summary profile, as well as for the profiles directed from right to left. If the value is zero the function is not performed.
ProfileMaxLengthPix - the maximum length of the profile, specified in monitor pixels. In this mode, regardless of the profile capture area, its total visible length will not be greater than the specified value. If the value is zero the function is not performed.
Fixed the error with the summary profile becoming a normal profile when it is overlapped by new candles on the chart. The reference rectangle of the summary profile is now automatically positioned at the bottom, under the summary profile.
The ProfileStepPoint input variable now has a fractional type. This allows to set the grid step of the profiles in «new» points. The value of 0.1 corresponds to one «new» point.
The color of the reference rectangles automatically adjusts to the chart background color, but with a darker tone (slightly brighter tone for a black background). If you want to apply a different color, then set the ProfileRectangleColor input variable to any other color, except White.
Versión 1.2 2016.05.27
The indicator works on all timeframes.
Improved the visual appearance and extended the indicator capabilities.
When the scale of the calculated grid is increased (ProfileStepPoint or ProfileStepPointPix), the numerical value of volume is specified not only along the POC line, but also on each cluster of profiles.
The initial position as well as the final position is displayed above the profiles. Depending on the timeframe, those will be the initial and final – time, and/or session (day of the week, month, date).
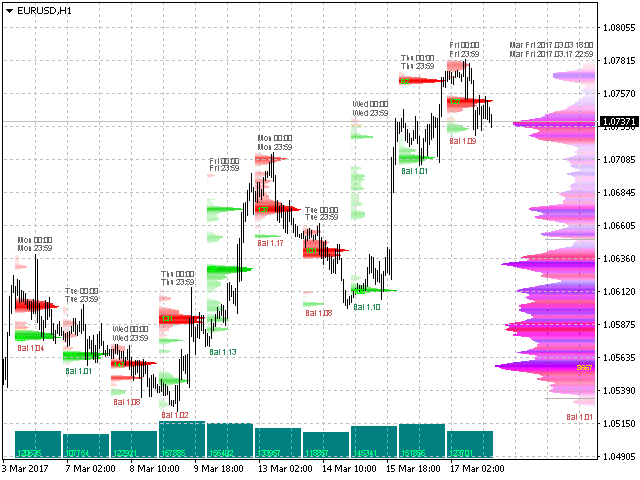
Added the ability to display the total (cumulative) profile. Create a rectangle in an empty space on the right beyond the graph, and the summary profile will appear in that area.
Scrolling the chart to history is allowed for the summary profile. When scrolling the chart, the summary profile will be plotted based on the data in the visible area, that is, the data to the left and right beyond the chart window are not considered in the calculations.
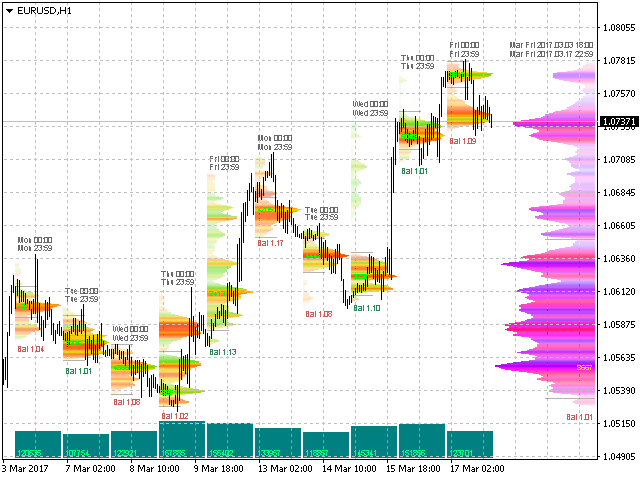
Added the color fading visual effect - ProfileFading.
Added the function of color difference delta - ProfileDelta. In this mode, the areas of prevailing Buys on the profiles is colored in green, that of Sells - in red. On the summary profile, respectively, blue/red.
Separate color variables are introduced for the summary profile:
ProfileSumInAreaColor – summary profile color in the price area.
ProfileSumOutAreaColor – summary profile color outside the price area.
ProfileSumPocColor – color of the POC line of the summary profile.
ProfileSumTextColor – text color on the summary profile.
Versión 1.1 2016.05.11
In version 1.1 the principle of indicator management has been completely changed.
Now it is possible to create multiple custom profiles within one indicator running on the chart. Simply create a rectangle of required length on the chart and this rectangle will be automatically filled by the profile. The color of this rectangle will also automatically change according to the ProfileRectangleColor input parameter.
Note: If you do not want the rectangle to be filled by a profile, then rename it to any other name which does not include the word «Rectangle».