• Información general
  • Comentarios
  • Discusión
  • Novedades

Normalized OBV

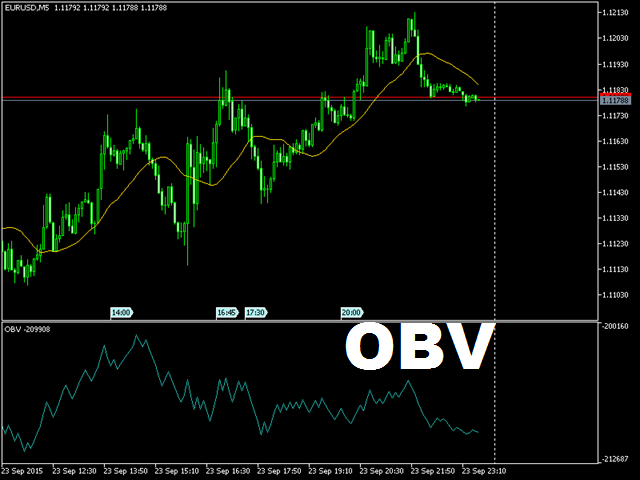
When looking at the information of On Balance Volume indicator, a question arises: is it a strong or weak movement? Should it be compared with previous days? These data should be normalized to always have a reference.


This indicator presents the followings parameters:

  • Normalization period (Max-Mins absolute)
  • Smoothing period (-1 off)
  • Tick/Real Volume
  • Maximum number of bars to calculate (-1 off)
  • Upper value normalization
  • Lower value normalization

Calculation: normOBV = (value - absMin) * (relMax - relMin) / (absMax - absMin) + relMin

Productos recomendados
Was: $249  Now: $99   Market Profile defines a number of day types that can help the trader to determine market behaviour. A key feature is the Value Area, representing the range of price action where 70% of trading took place. Understanding the Value Area can give traders valuable insight into market direction and establish the higher odds trade. It is an excellent addition to any system you may be using. Inspired by Jim Dalton’s book “Mind Over Markets”, this indicator is designed to suit the
Wapv Price and volume
Eduardo Da Costa Custodio Santos
El indicador de precio y volumen WAPV para MT5 es parte del conjunto de herramientas (Wyckoff Academy Wave Market) y (Wyckoff Academy Price and Volume). El indicador de precio y volumen WAPV para MT5 se creó para facilitar la visualización del movimiento del volumen en el gráfico de forma intuitiva. Con ella podrás observar los momentos de pico de volumen y momentos en los que el mercado no tiene interés profesional Identificar momentos en los que el mercado se mueve por inercia y no por movimie
Este producto le ayudará a comprar con beneficio y usar dos productos más populares para el análisis de los volúmenes de las peticiones y operaciones en los mercados de equidad: Actual Depth of Market Chart Actual Tick Footprint Volume Chart Este producto ha integrado toda la potencia de cada uno de los indicadores y se ofrece como un archivo único. Las rebajas anticrisis. ¡Hoy el precio del producto está rebajado! ¡Dese prisa! Las capacidades funcionales del producto Actual COMBO Depth of Mark
UPD1 Profile Levels MT5
Vitaliy Kuznetsov
5 (3)
El indicador encuentra los niveles de volumen de precio máximo y mínimo (perfil de mercado) en el gráfico de barras de trabajo para el número especificado de barras.   Perfil compuesto. La altura del histograma es completamente automática y se adapta a cualquier instrumento y marco de tiempo. Se utiliza un algoritmo de autor y no repite análogos conocidos. La altura de los dos histogramas es aproximadamente igual a la altura promedio de la vela. La alerta inteligente le ayudará a informar sobre
No Demand No Supply MT5
Trade The Volume Waves Single Member P.C.
No Demand No Supply   This indicator identifies   No Demand –No Supply candles  to your chart and plots volume bars colored according to the signal. It can be applied to all timeframes or to a specific one only. It can also be used as regular volume indicator  with exceptional future of WEIGHTED VOLUME. Furthermore is has an alert notification, sound and email when a signals occurs. The indicator does not repaint but the alert will come on two candles back due to the definition of No Demand No S
El indicador construye cotizaciones actuales, que se pueden comparar con las históricas y, sobre esta base, hacer un pronóstico de movimiento de precios. El indicador tiene un campo de texto para una navegación rápida a la fecha deseada. Opciones: Símbolo - selección del símbolo que mostrará el indicador; SymbolPeriod - selección del período del cual el indicador tomará datos; IndicatorColor - color del indicador; HorisontalShift: cambio de cotizaciones dibujadas por el indicador
Esta herramienta profesional de los mejores corredores de bolsa ahora está disponible en la plataforma MetaTrader 5 . El indicador Actual depth of market chart visualiza la Profundidad del Mercado (DOM, por sus siglas en inglés) en forma del histograma que se coloca en el gráfico del precio y se actualiza en tiempo real. ¡Atención! ¡La actualización reciente ha sido hecha a petición de nuestros usuarios! Ahora el indicador Actual Depth of Market visualiza la relación actual de los volúmenes de
IceFX VelocityMeter Mini is a very unique indicator on MetaTrader 4 platform which measures the speed of the Forex market . It is not a normal volume or other measurement indicator because IceFX VelocityMeter Mini is capable to understand market speed movements which are hidden in ticks and those valuable information cannot be read in an ordinary way from the candles. The software monitors the received ticks (frequency, magnitude of change) within a specified time range, analyzes these info and
BoxChart MT5
Evgeny Shevtsov
5 (7)
The market is unfair if only because 10% of participants manage 90% of funds. An ordinary trader has slim changes to stand against these "vultures". This problem can be solved. You just need to be among these 10%, learn to predict their intentions and move with them. Volume is the only preemptive factor that faultlessly works on any timeframe and symbol. First, the volume appears and is accumulated, and only then the price moves. The price moves from one volume to another. Areas of volume accumu
This indicator provides an original mix of WPR, VSA, and volume delta. It shows ratio of buy/sell volumes scaled on 100% range based on total volume change for a selected period. The convetional VSA (Volume Spread Analysis) studies interconnections of price action and volume change in absolute values, whereas WPR (Williams Percent Range) offers a convenient approach of price moves normalization into the fixed percentage metric: 0 - 100%. Hence overbough and oversold states are easily spotted. N
VolumeProfile MT5
Robert Hess
3.75 (8)
Description: The Volume Profile displays detailed informations of historical trading activities at certain price levels (Market Profile). Locate the areas with the best prices in the market and get an advantage over other market participants. Support: The indicator is constantly being developed and improved. Please do not hesitate to contact me via the MQL5 Platform. I am very grateful about any Bug report, so that i can constantly improve the indicator. I appreciate any public review for this
VolumeDeltaBars
Stanislav Korotky
This indicator is a conventional analytical tool for tick volumes changes. It calculates tick volumes for buys and sells separately, and their delta on every bar, and displays volumes by price clusters (cells) within a specified bar (usually the latest one). The algorithm used internally is the same as in the indicator VolumeDeltaMT5 , but results are shown as cumulative volume delta bars (candlesticks). Analogous indicator for MetaTrader 4 exists - CumulativeDeltaBars . This is a limited substi
Alpha Trend Pro
Eslam Mohamed Abdelrady Shehata
Alpha Trend Pro: Your Ultimate Trading Companion Embark on a new era of trading with Alpha Trend Pro Indicator. Crafted with precision and innovation, Alpha Trend is designed to elevate your trading experience by seamlessly blending powerful elements to navigate various market conditions. **Key Features:** **1. Dynamic Adaptability:**    - In sideways market conditions, Alpha Trend acts as a dead indicator. Say goodbye to many false signals and welcome a tool that adapts seamlessly to mar
Do you use volume in your reading of the market? Certainly many traders use it, and do not imagine operating without it. The Color Histogram Volume Set indicator allows the user to choose the value that he considers interesting to monitor. When you pass this you will have visual confirmation and if you want you will also have the audible alert that is given by the indicator. Of course, there are other ways to try to find a high volume, such as assessing whether the volume
Volumes Direction MT5
William Oswaldo Mayorga Urduy
VOLUMES DIRECTION MT5 Normalmente el indicador de volumen trae predeterminado un cambio de color cuando el volumen actual es mayor que el anterior, es importante pero no es muy útil. Por esto se creo este indicador que además del volumen normal, cuando la vela es alcista o bajista, las pinta de un color diferente, como predeterminado esta el azul para alcista y el rojo para bajista, pero estos colores se pueden personalizar al gusto del Trader. No olvides revisar mis otros indicadores que te a
Description The indicator uses market profile theory to show the most relevant trading zones, on a daily basis. The zones to be shown are LVN (low volume nodes) and POC (point of control). An LVN zone is one which represents price areas with the least time or volume throughout the day. Typically, these areas indicate a supply or demand initiative, and in the future, they can turn into important breakout or retracement zones. A POC zone is one which represents price areas with the most time or vo
Blahtech Supply Demand MT5
Blahtech Limited
4.57 (14)
Was: $299  Now: $99   Supply Demand uses previous price action to identify potential imbalances between buyers and sellers. The key is to identify the better odds zones, not just the untouched ones. Blahtech Supply Demand indicator delivers functionality previously unavailable on any trading platform. This 4-in-1 indicator not only highlights the higher probability zones using a multi-criteria strength engine, but also combines it with multi-timeframe trend analysis, previously confirmed swings
The   Supply and Demand Zones indicator   is one of the best tools we have ever made. This great tool automatically draws supply and demand zones, the best places for opening and closing positions. It has many advanced features such as multi timeframe zones support, displaying the width of zones, alert notifications for retouched zones, and much more. Because of market fractality, this indicator can be used for any kind of trading. Whether you are a positional, swing, or intraday trader does no
La singularidad de este indicador radica en el algoritmo de contabilidad de volumen: la acumulación se produce directamente para el período seleccionado sin referencia al comienzo del día. Las últimas barras se pueden excluir del cálculo, entonces los datos actuales tendrán menos influencia en los niveles significativos (volúmenes) formados anteriormente. Para un cálculo más preciso, los datos del gráfico M1 se utilizan de forma predeterminada. El paso de distribución de los volúmenes de precios
Cumulative delta indicator As most traders believe, the price moves under the pressure of market buying or selling. When someone redeems an offer standing in the cup, the deal is a "buy". If someone pours into the bid standing in the cup - the deal goes with the direction of "sale". The delta is the difference between purchases and sales. A cumulative delta - the difference between the cumulative sum of purchases and sales for a certain period of time. It allows you to see who is currently contr
El indicador calcula y traza automáticamente los niveles de soporte y resistencia de Fibonacci, una de las herramientas más efectivas para el análisis de mercado. El cálculo utiliza los datos de precios promediados para el período y el marco de tiempo seleccionados. El mínimo y el máximo para este período se toman como inicio y final del movimiento. Los niveles de Fibonacci le permiten ver puntos de referencia potenciales, alrededor de los cuales el movimiento del precio puede ralentizarse o rev
POC level MT5
Mikhail Nazarenko
The indicator automatically calculates       and displays the level of the maximum       real   volume Point Of Control (POC) of the Market Profile for the   array of candles   highlighted by a rectangular area. This will significantly increase the accuracy of your position entries when trading POC bounces and reversals. Attention when testing the demo version!   In the MT5 strategy tester , there is no possibility of dragging a rectangle and this is a problem of limitations of the MT5 strategy
1. What is this         Rising volatility and falling volatility are not the same, whether it is academic research or actual testing has shown this point.         The original ATR indicator is calculated by putting up and down fluctuations together. This indicator is to calculate separately the upward volatility and the downward volatility, which can better help you study the market. 2. Indicator description          There are two modes for the calculation of this indicator, as shown in the f
Weis Wave Result MT5
Sant Clear Ali Costa
Features 3 types of waves: bullish, bearish and unknown. The unknown tower comes when prices move in opposite the direction of the current tower. Label that shows the percentage remaining for the next tower. Allows you set the type of volume that will be accumulated in the towers, either real or tick volumes. Thus, the indicator works in any market, for example: stocks, futures, forex, commodities, etc. Allows you to set the required score for the tower exchange. Allows you to set the font size
The balance of supply and demand is a simple and effective market analysis method. The supply and demand diagram can show you in advance, even before the trend reversal, where the supply ends and the demand is already emerging, where the demand ends and the supply is emerging, while substantially increasing the probability of making a deal in the right direction and with a high profit factor. Indicator signals The indicator uses the price/volume values to generate signals: ED – excess demand.
The Volume by Price Indicator for MetaTrader 5 features Volume Profile and Market Profile TPO (Time Price Opportunity). Get valuable insights out of currencies, equities and commodities data. Gain an edge trading financial markets. Volume and TPO histogram bar and line charts. Volume Footprint charts. TPO letter and block marker charts including split structures. Versatile segmentation and compositing methods. Static, dynamic and flexible ranges with relative and/or absolute visualizations. Lay
An indicator of patterns #24, #25, #26 and #27 ("Head and Shoulders", "Complex Head and Shoulders") from Encyclopedia of Chart Patterns by Thomas N. Bulkowski. Parameters: Alerts - show alert when an arrow appears   Push - send a push notification when an arrow appears (requires configuration in the terminal) PeriodBars - indicator period K - an additional parameter that influences the accuracy of pattern shape recognition. The smaller the value is, the smoother the row of peaks/valleys shoul
A machine translation from the English product description was used. We apologize for possible imprecisions. Se utilizó una traducción automática de la descripción del producto en inglés. Pedimos disculpas por posibles imprecisiones. Un sistema de visualización de patrones de acción de precios de velas japonesas favoritas. Una vez adjunto, el indicador marcará automáticamente los siguientes patrones en el gráfico: Barra de Pinocho (pinbar)  - una barra de cuerpo pequeño con una 'nariz' larga, un
The VWAP indicator is our version of the popular Volume-Weighted Average Price indicator. The VWAP is the ratio between the value traded (price multiplied by the number of volume traded) and the total volume traded over a specific time period. As a result, it measures the average price of the instrument much better than the simple moving average. Although there are many ways to use the VWAP, most investors use it to calculate the daily average.  The indicator works in five modes: Moving  - In
Strong Support mt5
Vasiliy Strukov
5 (9)
Los niveles de soporte y resistencia han sido durante mucho tiempo la herramienta más poderosa para el análisis del mercado. Strong Support el indicador construye los niveles de soporte en los mínimos locales del precio, y los niveles de resistencia en los máximos locales del precio. Mis otros desarrollos se pueden ver aquí Se recomienda usar junto con el indicador de tendencia, por ejemplo, Gold Stuff : esto le permitirá operar en la tendencia y al mismo tiempo determinar las zonas de cons
Los compradores de este producto también adquieren
Atomic Analyst MT5
Issam Kassas
3.64 (11)
En primer lugar, vale la pena enfatizar que este Indicador de Trading no repinta, no redibuja y no se retrasa, lo que lo hace ideal tanto para el trading manual como para el automatizado. El Analista Atómico es un Indicador de Acción del Precio PA que utiliza la fuerza y el impulso del precio para encontrar una mejor ventaja en el mercado. Equipado con filtros avanzados que ayudan a eliminar ruidos y señales falsas, y aumentan el potencial de trading. Utilizando múltiples capas de indicadores
Primero que todo, vale la pena enfatizar que este Sistema de Trading es un Indicador No Repintado, No Redibujado y No Retrasado, lo que lo hace ideal tanto para el trading manual como para el automatizado. El "Sistema de Trading Inteligente MT5" es una solución completa de trading diseñada para traders nuevos y experimentados. Combina más de 10 indicadores premium y presenta más de 7 estrategias de trading robustas, lo que lo convierte en una opción versátil para diversas condiciones del merca
Quantum Trend Sniper
Bogdan Ion Puscasu
5 (37)
Introduciendo       Indicador Quantum Trend Sniper   , el innovador indicador MQL5 que está transformando la forma en que identificas y negocias los cambios de tendencia. Desarrollado por un equipo de comerciantes experimentados con experiencia comercial de más de 13 años,       Indicador de francotirador de tendencia cuántica       está diseñado para impulsar su viaje comercial a nuevas alturas con su forma innovadora de identificar cambios de tendencia con una precisión extremadamente alta.
Trend Screener Pro MT5
STE S.S.COMPANY
4.89 (61)
Desbloquee el poder del comercio de tendencias con el indicador Trend Screener: ¡su solución definitiva para el comercio de tendencias impulsada por lógica difusa y un sistema multidivisa!Mejore su comercio de tendencias con Trend Screener, el revolucionario indicador de tendencias impulsado por lógica difusa. Es un poderoso indicador de seguimiento de tendencias que combina más de 13 herramientas y funciones premium y 3 estrategias comerciales, lo que lo convierte en una opción versátil para co
RelicusRoad Pro MT5
Relicus LLC
4.81 (21)
Ahora $ 147 (aumentando a $ 499 después de algunas actualizaciones) - Cuentas ilimitadas (PC o Mac) Manual de usuario de RelicusRoad + Videos de capacitación + Acceso al grupo privado de Discord + Estado VIP UNA NUEVA MANERA DE VER EL MERCADO RelicusRoad es el indicador comercial más poderoso del mundo para divisas, futuros, criptomonedas, acciones e índices, y brinda a los comerciantes toda la información y las herramientas que necesitan para mantenerse rentables. Brindamos análisis téc
FX Volume MT5
Daniel Stein
4.94 (17)
Obtenga su actualización diaria del mercado con detalles y capturas de pantalla a través de nuestro Morning Briefing aquí en mql5 y en Telegram ! FX Volume es el PRIMER y ÚNICO indicador de volumen que proporciona una visión REAL del sentimiento del mercado desde el punto de vista de un bróker. Proporciona una visión impresionante de cómo los participantes institucionales del mercado, como los brokers, están posicionados en el mercado Forex, mucho más rápido que los informes COT. Ver esta info
FX Power MT5 NG
Daniel Stein
5 (4)
Obtenga su actualización diaria del mercado con detalles y capturas de pantalla a través de nuestro Morning Briefing aquí en mql5 y en Telegram ! FX Power MT5 NG es la nueva generación de nuestro popular medidor de fuerza de divisas, FX Power. ¿Y qué ofrece este medidor de fuerza de nueva generación? Todo lo que le encantaba del FX Power original PLUS Análisis de fuerza de ORO/XAU Resultados de cálculo aún más precisos Períodos de análisis configurables individualmente Límite de cálculo persona
Ante todo, vale la pena enfatizar que esta Herramienta de Trading es un Indicador No Repintado, No Redibujado y No Retrasado, lo que la hace ideal para el trading profesional. El Indicador de Conceptos de Acción del Precio Inteligente es una herramienta muy potente tanto para traders nuevos como experimentados. Combina más de 20 indicadores útiles en uno solo, combinando ideas avanzadas de trading como el Análisis del Trader del Círculo Interior y Estrategias de Trading de Conceptos de Dinero
Advanced Supply Demand MT5
Bernhard Schweigert
4.53 (15)
¡Actualmente con 33% de descuento! ¡La mejor solución para cualquier tráder principiante o experto! Este indicador es una herramienta comercial única, de alta calidad y asequible, porque incorpora una serie de características patentadas y una nueva fórmula. Con esta actualización, podrá mostrar zonas de doble marco temporal. No solo podrá mostrar un marco temporal más alto, sino también mostrar ambos, el marco temporal del gráfico MÁS el marco temporal más alto: MOSTRANDO ZONAS ANIDADAS. A todos
XQ Indicator MetaTrader 5
Marzena Maria Szmit
5 (1)
Step into the realm of Forex trading with confidence and precision using XQ, a cutting-edge Forex indicator designed to elevate your trading game to unprecedented heights. Whether you're a seasoned trader or just stepping into the world of currency exchange, XQ Forex Indicator empowers you with the insights and signals needed to make informed trading decisions. The signal conditions are a combination of three indicators, and XQ Forex Indicator only display  medium and long-term trends . The ind
AW Trend Predictor MT5
AW Trading Software Limited
4.76 (54)
La combinación de niveles de tendencia y ruptura en un sistema. Un algoritmo de indicador avanzado filtra el ruido del mercado, determina la tendencia, los puntos de entrada y los posibles niveles de salida. Las señales indicadoras se registran en un módulo estadístico, que le permite seleccionar las herramientas más adecuadas, mostrando la efectividad del historial de señales. El indicador calcula las marcas Take Profit y Stop Loss. Manual e instrucciones ->   AQUÍ   / Versión MT4 ->   AQUÍ Có
Este es un genial indicador para MT5 que ofrece señales precisas para entrar en una transacción sin redibujar. Se puede aplicar a cualquier activo financiero: fórex, criptomonedas, metales, acciones, índices. Nos dará valoraciones bastante precisas y nos dirá cuándo es mejor abrir y cerra una transacción. Eche un vistazo  al vídeo  (6:22), ¡contiene un ejemplo de procesamiento de una sola señal que ha amortizado el indicador! La mayoría de los tráders mejoran sus resultados comerciales durante l
Introduciendo       Quantum Breakout PRO   , el innovador indicador MQL5 que está transformando la forma en que comercia con Breakout Zones. Desarrollado por un equipo de comerciantes experimentados con experiencia comercial de más de 13 años,       Desglose cuántico PRO       está diseñado para impulsar su viaje comercial a nuevas alturas con su innovadora y dinámica estrategia de zona de ruptura. El indicador de ruptura cuántica le dará flechas de señal en las zonas de ruptura con 5 zonas
ICT, SMC, SMART MONEY CONCEPTS, SMART MONEY, Smart Money Concept, Support and Resistance, Trend Analysis, Price Action, Market Structure, Order Blocks, BOS/CHoCH,   Breaker Blocks ,  Momentum Shift,   Supply&Demand Zone/Order Blocks , Strong Imbalance,   HH/LL/HL/LH,    Fair Value Gap, FVG,  Premium  &   Discount   Zones, Fibonacci Retracement, OTE, Buy Side Liquidity, Sell Side Liquidity, BSL/SSL Taken, Equal Highs & Lows, MTF Dashboard, Multiple Time Frame, BigBar, HTF OB, HTF Market Structure
Auto Order Block with break of structure based on ICT and Smart Money Concepts Futures Break of Structure ( BoS )             Order block ( OB )            Higher time frame Order block / Point of Interest ( POI )    shown on current chart           Fair value Gap ( FVG ) / Imbalance   ,  MTF      ( Multi Time Frame )    Volume Imbalance     ,  MTF          vIMB Gap’s Equal High / Low’s     ,  MTF             EQH / EQL Liquidity               Current Day High / Low           HOD /
Conviértase en un Breaker Trader y obtenga beneficios de los cambios en la estructura del mercado a medida que se invierte el precio. El indicador de ruptura de bloque de órdenes identifica cuándo una tendencia o movimiento de precio se acerca al agotamiento y está listo para revertirse. Le alerta sobre cambios en la estructura del mercado que generalmente ocurren cuando una reversión o un retroceso importante están a punto de suceder. El indicador utiliza un cálculo patentado que identific
TPSpro TRENDPRO  - is a trend indicator that automatically analyzes the market and provides information about the trend and each of its changes, as well as giving signals for entering trades without redrawing! The indicator uses each candle, analyzing them separately. referring to different impulses - up or down impulse. Exact entry points into transactions for currencies, crypto, metals, stocks, indices!  -  Version MT4                  DETAILED DESCRIPTION        /       TRADING SETUPS       
TrendMaestro5
Stefano Frisetti
note: this indicator is for METATRADER4, if you want the version for METATRADER5 this is the link:  https://www.mql5.com/it/market/product/108106 TRENDMAESTRO recognizes a new TREND in the bud, he never makes mistakes. The certainty of identifying a new TREND is priceless. DESCRIPTION TRENDMAESTRO identifies a new TREND in the bud, this indicator examines the volatility, volumes and momentum to identify the moment in which there is an explosion of one or more of these data and therefore the mome
Owl Smart Levels MT5
Sergey Ermolov
4.47 (36)
Versión MT4  |  FAQ El Indicador Owl Smart Levels es un sistema comercial completo dentro de un indicador que incluye herramientas de análisis de mercado tan populares como los fractales avanzados de Bill Williams , Valable ZigZag que construye la estructura de onda correcta del mercado y los niveles de Fibonacci que marcan los niveles exactos de entrada. en el mercado y lugares para tomar ganancias. Descripción detallada de la estrategia Instrucciones para trabajar con el indicador Asesor de c
Quantum Heiken Ashi PRO MT5
Bogdan Ion Puscasu
4.5 (8)
Presentamos el   Quantum Heiken Ashi PRO Diseñadas para brindar información clara sobre las tendencias del mercado, las velas Heiken Ashi son reconocidas por su capacidad para filtrar el ruido y eliminar las señales falsas. Diga adiós a las confusas fluctuaciones de precios y dé la bienvenida a una representación gráfica más fluida y confiable. Lo que hace que Quantum Heiken Ashi PRO sea realmente único es su fórmula innovadora, que transforma los datos de velas tradicionales en barras de colore
IX Power MT5
Daniel Stein
5 (2)
IX Power   lleva por fin la insuperable precisión de FX Power a los símbolos que no son de Forex. Determina con exactitud la intensidad de las tendencias a corto, medio y largo plazo de tus índices, acciones, materias primas, ETF e incluso criptodivisas favoritas. Puede   analizar todo lo   que su terminal le ofrece. Pruébalo y experimenta cómo   tu timing mejora significativamente   a la hora de operar. Características principales de IX Power Resultados de cálculo 100% precisos y sin rep
TrendDecoder Premium MT5
Christophe, Pa Trouillas
5 (1)
Identifique los rangos y los próximos movimientos probables  |  Obtenga las señales más tempranas y la fuerza de las Tendencias   |  Obtener salidas claras antes de reversión   |  Detecte los niveles de Fibo que el precio pondrá a prueba   |  Indicador no repintado y no retardado - ideal para la trading manual y automatizada - adecuado para todos los activos y todas las unidades temporales 69$   para el lanzamiento - luego de nuevo a >>   $ 149 Después de la compra,   póngase en contacto con mi
Gartley Hunter Multi
Siarhei Vashchylka
5 (5)
Gartley Hunter Multi - An indicator for searching for harmonic patterns simultaneously on dozens of trading instruments and on all classic timeframes: (m1, m5, m15, m30, H1, H4, D1, Wk, Mn). Manual (Be sure to read before purchasing) | Version for MT4 Advantages 1. Patterns: Gartley, Butterfly, Shark, Crab. Bat, Alternate Bat, Deep Crab, Cypher 2. Simultaneous search for patterns on dozens of trading instruments and on all classic timeframes 3. Search for patterns of all possible sizes. Fr
TrendLine PRO MT5
Evgenii Aksenov
4.78 (49)
El indicador Trend Line PRO es una estrategia comercial independiente. Muestra el cambio de tendencia, el punto de entrada a la transacción, así como calcula automáticamente tres niveles de Take Profit y la protección contra la pérdida de Stop Loss Trend Line PRO es perfecto para todos los símbolos de Meta Trader: monedas, metales, criptomonedas, acciones e índices Ventajas de Trend Line PRO: Nunca vuelve a dibujar sus señales Posibilidad de utilizar como estrategia independiente Tiene tres niv
Golden Spikes Detector
Batsirayi L Marango
5 (1)
Golden Spikes Detector Este indicador se basa en una estrategia avanzada principalmente para negociar picos en índices de auge y caída. Se implementaron algoritmos complejos para detectar únicamente entradas de alta probabilidad. Alerta sobre posibles entradas de Compra y Venta. Para negociar picos en el corredor Deriv o Binary, solo acepte las alertas Buy Boom y Sell Cash. Se optimizó para cargarse en un período de tiempo de 5 minutos, aunque se realiza un análisis de múltiples períodos de tiem
Matrix Arrow Indicator MT5
Juvenille Emperor Limited
5 (14)
Matrix Arrow Indicator MT5   es una tendencia única 10 en 1 que sigue un indicador   100% sin repintado   de marcos temporales múltiples que se puede usar en todos los símbolos/instrumentos:   divisas ,   materias primas ,   criptomonedas ,   índices ,   acciones .  Matrix Arrow Indicator MT5  determinará la tendencia actual en sus primeras etapas, recopilando información y datos de hasta 10 indicadores estándar, que son: Índice de movimiento direccional promedio (ADX) Índice de canales de prod
Dark Power MT5
Marco Solito
4.84 (56)
Dark Power  is an Indicator for intraday trading. This Indicator is based on   Trend Following  strategy, also adopting the use of an histogram to determine the right power . We can enter in good price with this Indicator, in order to follow the   strong trend   on the current instrument. The histogram is calculated based on the size of the bars and two moving averages calculated on the histogram determine the direction of the signal Key benefits Easily visible take profit/stop loss lines Int
** All Symbols x All Timeframes scan just by pressing scanner button ** ***Contact me after purchase to send you instructions and add you in "123 scanner group" for sharing or seeing experiences with other users. After 15 years of experience in the markets and 3 years of programming, Winner indicator is ready. I would like to share with you! Introduction The 123 Pattern Scanner indicator with a special enhanced algorithm is a very repetitive common pattern finder with a high success rate . Inte
The Smart Liquidity Profile is color-coded based on the importance of the traded activity at specific price levels, allowing traders to identify significant price levels such as support and resistance levels, supply and demand zones, liquidity gaps, consolidation zones, Buy-Side/Sell-Side Liquidity and so on.  Smart Liquidity Profile allows users to choose from a number of different time periods including 'Auto,' 'Fixed Range,' 'Swing High,' 'Swing Low,' 'Session,' 'Day,' 'Week,' 'Month,' 'Quart
Golden Gate Algo MT5
James David Lane
4 (6)
¡40% DE DESCUENTO PARA NAVIDAD! ¡AUMENTO DE PRECIO A $250 EL 1 DE ENERO! Presentamos GoldenGate Entries: ¡Una Solución de Trading de Vanguardia! Descubre un enfoque revolucionario para el trading con GoldenGate Entries (GGE), un indicador avanzado diseñado para elevar tu experiencia de trading. GGE proporciona un conjunto completo de características para capacitar a los usuarios con precisión y confianza en sus decisiones comerciales. Pares: Cualquiera (FX - Materias primas - Acciones - A
Otros productos de este autor
When looking at the volume information that moves the market, a question arises: is it a strong or weak movement? Should it be compared with previous days? These data should be normalized to always have a reference. This indicator reports the market volume normalized between 0-100 values. It has a line that smoothes the main signal (EMA). The normalization of values occurs within an interval defined by user (21 bars on default). User can also define any relative maximum, timeframe and number of
"All MAs-13 jm" is a tool that allows accessing from a single control box 13 different types of MAs: 9 standard MAs in MetaTrader 5 (SMA, EMA, SMMA, LWMA, DEMA, TEMA, Frama, VIDYA, AMA ) and 4 non-standard (LRMA, HMA, JMA, SAYS) copyrights to which belong to Nikolay Kositsin (Godzilla), they can be found on the web (e.g. LRMA ). General Parameters Period MA: the number of bars to calculate the moving average. MA Method: select the type of moving average to show in the current graph. Applied Pric
Is the market volatile today? More than yesterday? EURUSD is volatile? More than GBPUSD? We need an indicator that allows us to these responses and make comparisons between pairs or between different timeframes. This indicator facilitates this task. Reports the normalized ATR as three modes; It has a line that smooths the main signal; The normalization of values occurs within a defined interval by user (34 default bars); The user can also define any symbol and timeframe to calculate and to make
"MA Angle 13 types" is an indicator that   informs of the inclination angle of the moving average curve that is displayed on the screen. It allows selecting the MA method to use. You can also select the period, the price and the number of bars the angle is calculated for. In addition, "factorVisual" parameter adjusts the information about the MA curve angle displayed on this screen. The angle is calculated from your tangent (price change per minute). You can select up to 13 types of MA, 9 standa
Chaikin Money Flow
Jose Miguel Soriano
This indicator incorporates the volume to inform the market trend. A warning system (chart, SMS and e-mail) is incorporated for warning when a certain level is exceeded. Developed by Marc Chaikin, Chaikin Money Flow (CMF) measures the amount of Money Flow Volume (MFV) over a specific period. Money Flow Volume forms the basis for the Accumulation Distribution Line. Instead of a cumulative total of Money Flow Volume, Chaikin Money Flow simply sums Money Flow Volume for a specific look-back period.
CCI normalized
Jose Miguel Soriano
Commodity Channel Index Technical Indicator (CCI) measures the deviation of the commodity price from its average statistical price. High values of the index point out that the price is unusually high being compared with the average one, and low values show that the price is too low. In spite of its name, the Commodity Channel Index can be applied for any financial instrument, and not only for the wares. There are two basic techniques of using Commodity Channel Index: Finding the divergences. Th
R2 oscilator
Jose Miguel Soriano
R2 (R-squared) represents the square of the correlation coefficient between current prices and deducted from the linear regression. It is the statistical measure of how well the regression line is  adjusted to the actual data, and therefore it measures the strength of the prevailing trend without distinguishing between ascending and descending one. The R2 value varies between 0 and 1, therefore it is an oscillator of bands that can show signs of saturation (overbought / oversold). The more the v
If instead of giving the regression value indicator end of the regression line (LRMA), we give the value of its slope, we obtain LRS or Linear Regression Slope Indicator. Since the slope is positive when prices rise, zero when they are in range and negative when they are lowered, LRS provides us the data on the price trend. Calculation                       sum(XY, n) - avg(Y, n)*sum(X, n)   Y= a + mX;      m=  --------------------------------        a= avg(Y, n) - m*avg(X, n)                   
"ATR channel all MAs jm" is a indicator that allows displaying on a chart the ATR channel calculated according to the moving average selected. You can select 9 standard MAs available in MetaTrader 5 - SMA, EMA, SMMA, LWMA, DEMA, TEMA, Frama, VIDYA, AMA, TRIX, and 4 non-standard - LRMA, HMA, JMA, AFIRMA. General Parameters: Channel type - true: channel ATR, false: channel price. Method MA - select the type of moving average to show in the current graph. Period MA - the number of bars to calcula
"Bollinger Bands all MAs" is an indicator that allows drawing Bollinger Bands calculated according to the selected moving average. You can select 9 standard MAs available in MetaTrader 5 - SMA, EMA, SMMA, LWMA, DEMA, TEMA, Frama, VIDYA, AMA, TRIX, and 4 non-standard ones - LRMA, HMA, JMA, AFIRMA. General Parameters Method MA - select the type of moving average to be displayed in the current graph. Period MA - the number of bars to calculate the MA. Width bands - the width of the bands expresse
Filtro:
No hay comentarios
Respuesta al comentario
Versión 2.10 2022.01.23
version 5 build 3146
13-ene-2022