ADX Trigger AM
- Indicadores
- Andriy Matviyevs'kyy
- Versión: 26.0
- Actualizado: 12 septiembre 2023
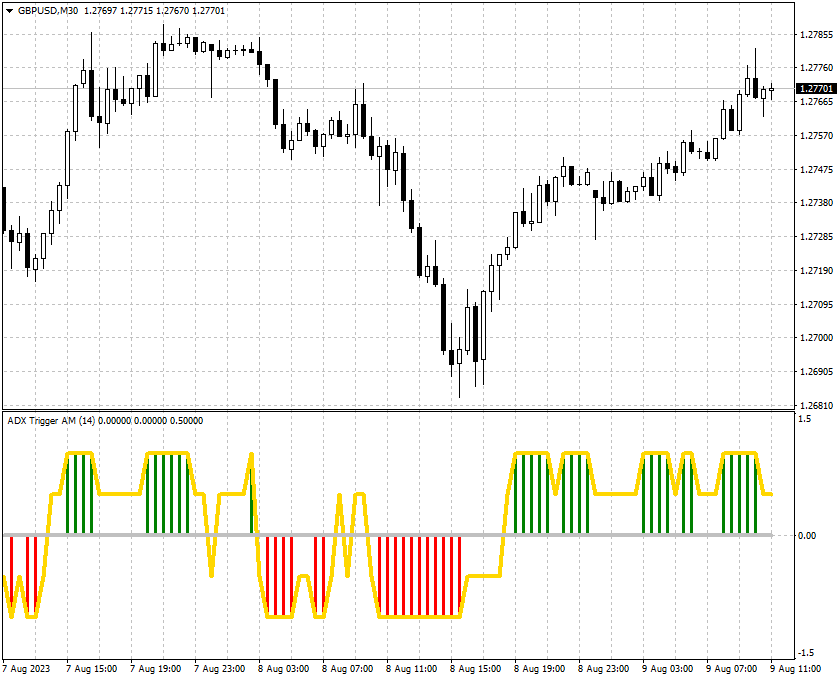
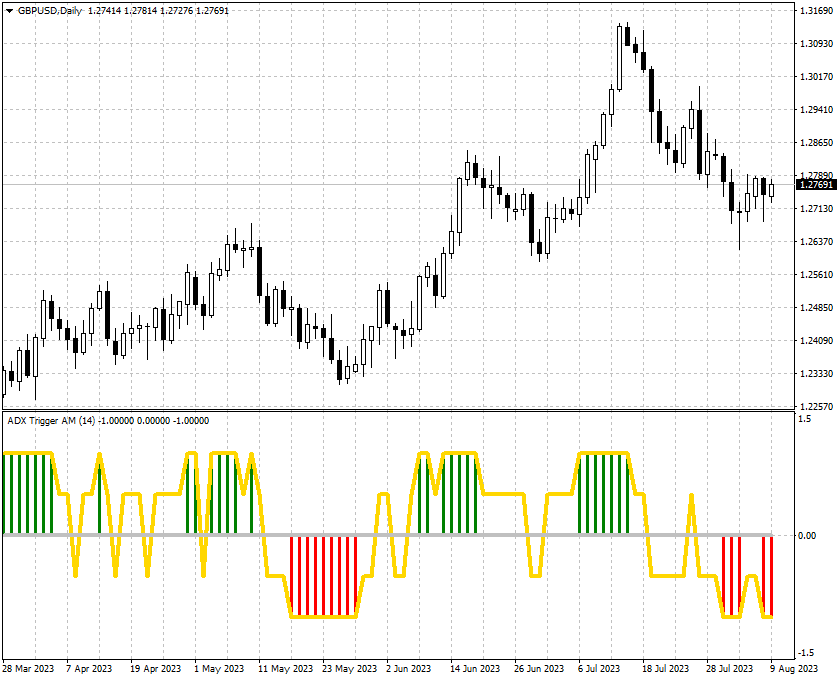
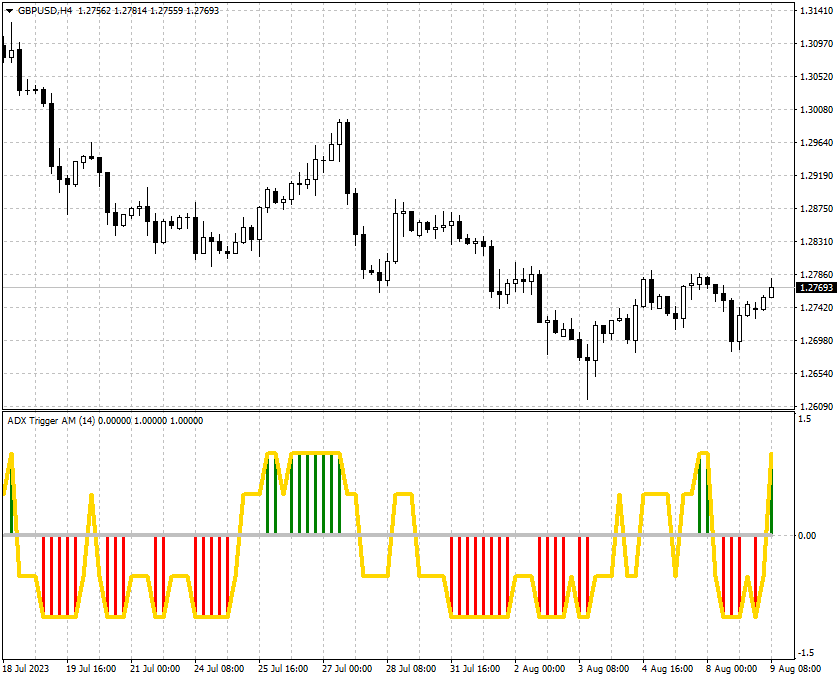
The indicator is an interpretation of the Average Directional Movement Index (ADX) allowing you to determine if there is a price trend. It was developed by Welles Wilder and described in his book "New concepts in technical trading systems".
The indicator determines entry points and uses crossing of ADX +/- lines and growth or fall of the main ADX line. When the indicator crosses the zero line, the trend is changed.
- If the oscillator's value is 1 - the price grows, the trend remains;
- If the oscillator's value is 0.5 - the price grows, the trend is absent;
- If the oscillator's value is -1 - the price falls, the trend remains;
- If the oscillator's value is -0.5 - the price falls, the trend is absent;
The best entry moment is crossing the High/Low of the bar where the indicator has crosses 0.
Settings:
- ADX_Period - ADX period
- ADX_Price - price used to calculate ADX
Really good indicator. I've only tried on strategy tester, but looks really good. I will update this review after I've tried it on the live market. Because of the type of indicator, I don't expect it to behave differently on the live market. I'm a scalper so I changed the settings to suite my needs. Also, I added a 0.5, and -0.5 level to help grab my attention when the value changes... An audible alert would be nice. Updated review. Very nice indicator. I've used on the live market now for a few days and it is very helpful. I continue to use stochastic as a confirmation, but still, very nice indicator in helping determine if the trend will continue.