Color Candles Identify the Major Trend
- Indicadores
- Ziheng Zhuang
- Versión: 4.20
- Actualizado: 23 marzo 2020
- Activaciones: 10
El indicador incluye dos partes.
Parte I: Las velas de colores muestran la tendencia principal
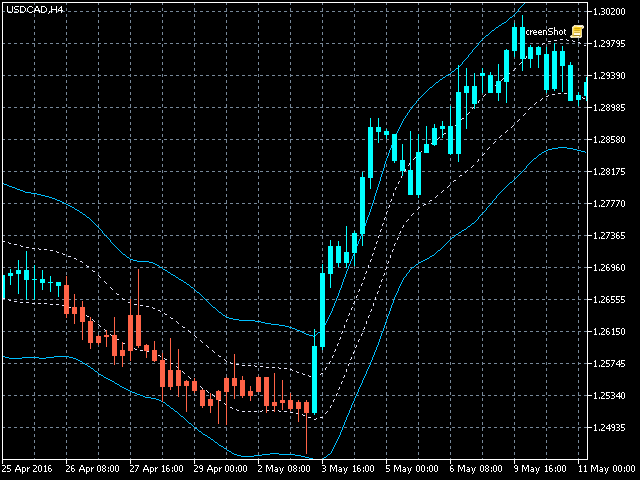
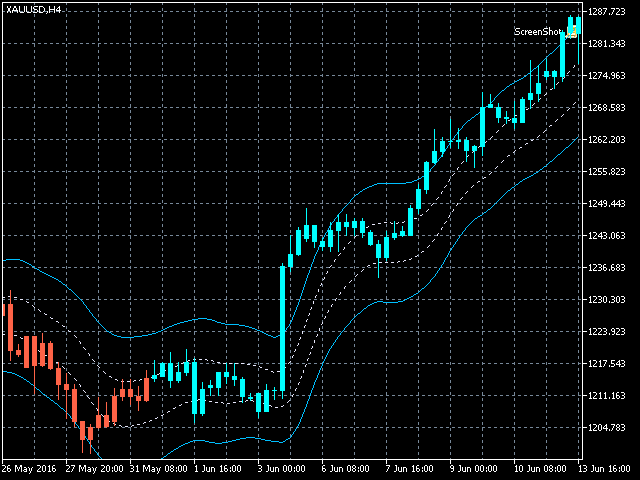
Las velas de colores sirven para identificar el estado del mercado mediante las velas de colores.
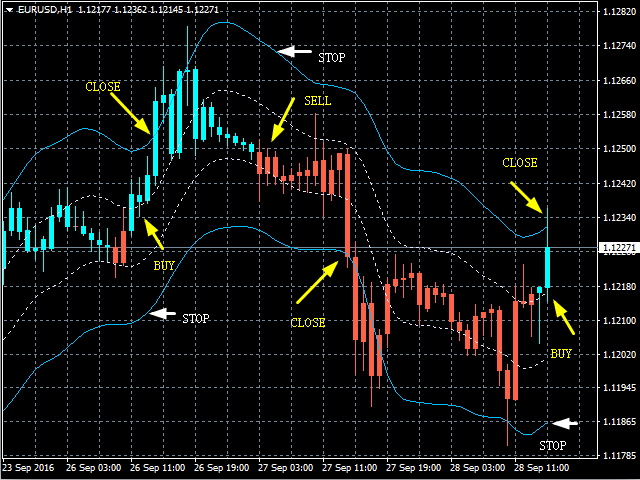
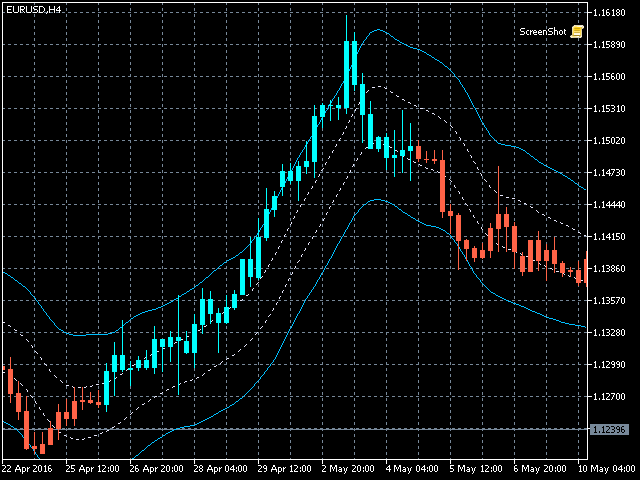
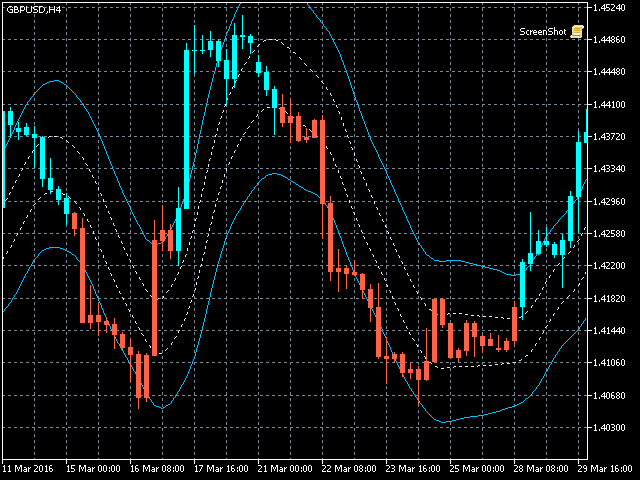
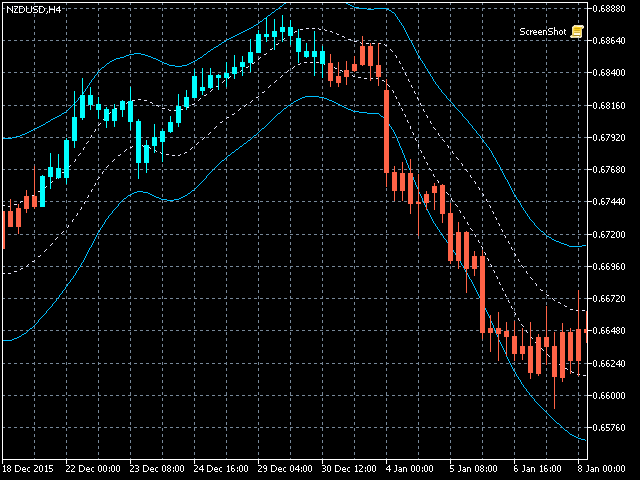
Como se muestra en las capturas de pantalla, si el color es Aqua, el mercado se encuentra en un estado en el que se deben realizar órdenes largas o salir de órdenes cortas. Si el color es Tomate, es el momento de realizar pedidos cortos o salir de pedidos largos.
Si el color cambia, es mejor esperar a que finalice (hasta que se cierre la barra actual).
Parte II: Dibujar bandas
Las bandas interiores se definen como zona segura y las bandas exteriores son para órdenes cerradas.
Estrategia comercial como se muestra a continuación:
- Si el color es Aqua y el precio está en las bandas internas, haga un pedido largo, cuando el precio cruce las bandas externas, es hora de cerrar el pedido.
- Si el color es tomate y el precio está en las bandas interiores, haga un pedido corto, cuando el precio cruce las bandas exteriores, será el momento de cerrar el pedido.
Parámetros de entrada
- ShowColorCandle - verdadero significa indicador dibujar vela de color.
- AlertColorChange - verdadero significa que habrá una alerta cuando finalice el cambio de color.
- EmailColorChange - verdadero significa que habrá un correo electrónico cuando finalice el cambio de color.
- ShowBands - indicador de medios verdaderos dibuja las bandas
- AlertCrossOuterBands - cierto hombre habrá alerta cuando el precio cruce las bandas exteriores
- AlertCrossOuttrBands - verdadero significa que habrá un correo electrónico cuando el precio cruce las bandas exteriores.
MT4 Version: https://www.mql5.com/es/market/product/10455

For my strategy a great EA-indicator !!!!