Robots comerciales e indicadores de pago para MetaTrader 4 - 33

Ever wondered why standard ADX is made unsigned and what if it would be kept signed? This indicator gives the answer, which allows you to trade more efficient. This indicator calculates ADX values using standard formulae, but excludes operation of taking the module of ADX values, which is forcedly added into ADX for some reason. In other words, the indicator preserves natural signs of ADX values, which makes it more consistent, easy to use, and gives signals earlier than standard ADX. Strictly s

Maximize Your Gold Trading Potential with Angelica AI EA – Your Premier Expert Advisor for Prop Firm Success Step into the realm of elite trading proficiency with Angelica AI EA, the pinnacle of Prop-Firm EA technology. Boasting a flawless 100% passing rate in prop firm challenges, Angelica AI EA is your key to unparalleled success. Equipped with state-of-the-art risk management tools and advanced filters, this expert advisor ensures a secure trading environment while delivering consistent resu

Indicator of tick volumes with the ability to monitor sudden and significant changes in the prices of bars relative to the specified coefficient - Change Factor. The color of the indicator's histogram characterizes the changes in volume of a bar relative to the previous session. By default, the indicator bars are colored in the following colors: Green - a slight increase in volume, not exceeding the Change Factor; Red - a slight decrease in volume, not exceeding the Change Factor; Purple - signi

Super Trend Bars is a trend finding indicator. It tries to find the trends that are most likely to trend. A set of indicators and a set of algorithms. Trend probability changes color when it finds a high trend. The red color represents the declining trend. The lime color represents the upward trend. Super Trend Bar changes color when it finds a trend.
Features This indicator is a trend indicator by itself. It can operate without the need for additional indicators. When you see the first lime c

The FFx Watcher PRO is a dashboard displaying on a single chart the current direction of up to 15 standard indicators and up to 9 timeframes. It has 2 different modes: 1. Watcher mode: Multi Indicators User is able to select up to 15 indicators to be displayed User is able to select up to 9 timeframes to be displayed
2. Watcher mode: Multi Pairs User is able to select any number of pairs/symbols User is able to select up to 9 timeframes to be displayed This mode uses one of the standard indica

LIVE SIGNAL Crazy RUN is a trading algorithm that can be used for both conservative and aggressive trading. The strategy of the Expert Advisor is based on the system of price rollback to the average value. Crazy Run opens a large number of orders, which maintains the necessary balance even when the price moves against the forecast of the trading algorithm.
Crazy Run :
- a system of deposit acceleration, which can multiply it several times in a short period of time
- conservative long term t
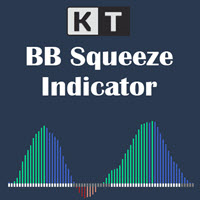
KT BB Squeeze measures the contraction and expansion of market volatility with a momentum oscillator, which can be used to decide a trading direction. It measures the squeeze in volatility by deducing the relationship between the Bollinger Bands and Keltner channels. Buy Trade: A white dot after the series of gray dots + Rising momentum above the zero line.
Sell Trade: A white dot after the series of gray dots + Rising momentum below the zero line. Markets tend to move from a period of low vol
The indicator measures the buying and selling force between the buyers and sellers in the form of a histogram/oscillator by using a BOP equation:
BOP = Moving Average of [close – open)/(high – low)]
Igor Levshin first introduced the Balance of power in the August 2001 issue of Technical Analysis of Stocks & Commodities magazine.
Features
Quickly find the buying and selling pressure among the traders. It comes with simple inputs and an interface. All Metatrader alerts included.
Appli
KT Pip Counter is a simple and informative indicator that shows some essential data and numbers on a real-time basis. Such critical information and data can benefit a trader during an intense trading session.
Features
Shows the current profit/loss in currency, pips, and percentage. Shows the current spreads. Shows the remaining time in the closing of the current bar. The different color schemes for profit/loss scenario. The text position and layout can be fully customized. It uses minimum

KT Trend Magic shows the trend depiction on chart using the combination of market momentum and volatility. A smoothing coefficient is used to smooth out the noise from the signal.It can be used to find out the new entries or confirm the trades produced by other EA/Indicators.
Usage
Drag n drop MTF scanner which scans for the new signals across multiple time-frames. Find new entries in the trend direction. Improve the accuracy of other indicators when used in conjunction. Can be used as a dyna

The KT Currency Strength Meter measures the individual currencies' strength and weakness by applying an aggregated mathematical formula over the major FX pairs. The strength is calculated using the bullish and bearish candles over a fixed period. After filling up the strength data, an algorithm sorts out the strongest and weakest currencies in a stack and updates their orders using the real-time incoming data.
Advantages
Improve your trading strategy instantly by filtering out the signals th
Tick Volume Chart — fixed volume bars for MetaTrader 4. The utility creates charts on which each candle has a fixed tick volume. Data sampling is carried out not by time but by the tick volume. Each bar contains a given (fixed) tick volume. Tick volume can be adjusted by changing the value of the Volume parameter. You can apply indicators, Expert Advisors and scripts to the tick chart. You get a fully functional chart, on which you can work just as well as on a regular chart. In the process of w
Tick Chart — full-featured chart for MetaTrader 4. A utility for creating and working with a tick chart in the MetaTrader 4 terminal. You can create a tick chart that works exactly the same as a regular chart. You can apply indicators, Expert Advisors and scripts to the tick chart. You get a fully functional tick chart on which you can work just as well as on a regular chart. You can enable the output of the Ask price data. The data are generated in the form of the upper shadow of a tick bar. Fr
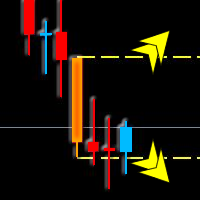
Masters Bars is an indicator that plots a line over High and Low of the last Master Bar. A Master Bar is defined as the decisive candle that exceeds the last decisive candle High-Low range. This helps traders to see if the chances for trend continuation improve or the chances for a trend reversal increase when Masters Bars range is broken. Masters Bars include an Alarm function that produces a sound, or even can send an email and/or push notification depending up what you have configured in your
KT Custom High Low shows the most recent highs/lows by fetching the data points from multi-timeframes and then projecting them on a single chart. If two or more highs/lows are found at the same price, they are merged into a single level to declutter the charts.
Features
It is built with a sorting algorithm that declutters the charts by merging the duplicate values into a single value. Get Highs/Lows from multiple timeframes on a single chart without any fuss. Provide alerts when the current

The indicator displays Renko bars on the chart, uses their data to calculate and display the moving average, PriceChannel and generates buy/sell signals. Renko is a non-trivial price display method. Instead of displaying each bar within a time interval, only the bars where the price moved a certain number of points are shown. Renko bars do not depend on a time interval, therefore the indicator works on any timeframe without losing its efficiency. The PriceChannel indicator displays the upper, lo

Ka Ching EA is a fully automatic robot that has the level of a professional trader. The robot uses a completely new and unknown strategy. During real trading, it does not look towards history and acts according to circumstances. The algorithm of the adviser is based on determining the strength of the market and the formation of pivot points. Orders are closed by Take Profit, Trailing or Stop Loss. Expert Advisor settings optimized for the Icmarket broker. Minor optimization of input parameter

Asesor Experto "MR BEAST MIN MAX Price Extremes Master": Potencia tu Trading con Precisión en Mínimos y Máximos El asesor experto "Price Extremes Master" redefine la toma de decisiones en el trading al basarse en los precios mínimos y máximos del mercado. Este innovador asesor utiliza algoritmos avanzados para identificar oportunidades estratégicas en los puntos extremos de precios, permitiendo a los traders capitalizar las fluctuaciones del mercado de manera eficaz. Características Destacadas:
KT Renko Live Chart utility creates the Renko charts on MT4 that can be further used for speculation or live trading. The Renko chart created by this utility supports most of the custom indicators and automated Expert Advisors. Fully compatible with our Renko Patterns indicator and Renko Patterns EA . To use an Expert Advisor on the generated Renko chart, make sure to untick the "Offline Chart" in the chart properties.
Features
A simple and straightforward Renko utility that provides the Ren

THIS EA IS DESING TO USED IN BTCUSD
Do you want to accompany Criptotrading to the next level of bitcoin trading?
You just have to download it and try it yourself. Also testing it is free. Are you not going to try them?
Criptotrading it is a Secure Automated Software for trade Forex market and indices.
The architecture is a Fully Automatic Autonomous Robot Expert capable of independently analyzing the market and making trading decisions
Criptotrading It is an advanced and profe

EA Safe Scalper is an advanced expert advisor for MT4 that based on WPR & Stochastic indicators. it determines overbought/oversold points and open safe & reliable orders. Our greatest effort in making this expert has been to protect your capital. There Is No Martingale No Grid! --- Contact me in messages for free gift after purchase! ---
Recommended Symbols: NQ100(Nasdaq) - XAUUSD
Recommended Timeframes: H1 - M5 Parameters:
slippage: max slippage magic number: unique number to determine

GG TrendBar Indicator - Your Multitimeframe ADX Trading Solution Experience the power of multi-timeframe trading with the "GG TrendBar Indicator." This versatile tool, built upon the ADX indicator, offers precise insights by considering multiple timeframes, ensuring you make well-informed trading decisions. Basic Details : Indicator Type : GG TrendBar Indicator (Multi-Timeframe ADX) Key Metrics : Real-time ADX analysis across multiple timeframes. Customization : Enable or disable specific timefr
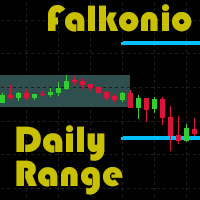
The indicator highlights the affected period taking the highest and the lowest prices into account. It is possible to choose any time period from 1 hour to 24 hours. It also optionally shows the target levels when trading at the breakout of the range in any direction. The target level value is given in percentages of the width of the previous range. The indicator is the improvement and extension of the free version . It works on timeframes from M1 to H1. It warns at the higher timeframes.
Sett

Reverse OCO is a utility shaped to trade the news. Given the eventuality of a rally related to an economic event, the user can schedule an OCO (one-cancel-other) order with automatically calculated TP/SL points. At scheduled time, Reverse OCO will check latest volatility (at current graph timeframe), and place an OCO order with lots and price channel calculated on the basis of the max loss acceptable for the user. It works with every product , every timeframe .
Parameters Event scheduling time

IceFX VelocityMeter Mini is a very unique indicator on MetaTrader 4 platform which measures the speed of the Forex market . It is not a normal volume or other measurement indicator because IceFX VelocityMeter Mini is capable to understand market speed movements which are hidden in ticks and those valuable information cannot be read in an ordinary way from the candles. The software monitors the received ticks (frequency, magnitude of change) within a specified time range, analyzes these info and

Support and Resistance Barry Indicator - Your Path to Precision Trading Explore the world of precision trading with the "Support and Resistance Barry Indicator" for MetaTrader 4. This robust tool is designed to help you identify key support and resistance levels with exceptional accuracy, enhancing your ability to make well-informed trading decisions. Basic Details : Indicator Type : Support and Resistance Barry Indicator Key Metrics : Real-time identification of crucial support and resistance l

Trendfinder SMA With Zone and Alert are Colored candlesticks showing the trend based on two SMA as Signal and two SMA as a Buy and Sell Zone and the slope of the slow moving average. This indicator will give you the color change on the next bar on the confirmation candle and will provide alert on Buy and sell signal, when it enters the buy and sell zone and when the market test the buy or sell zones as support or resistance and will never repaint . This indicator has the following: 2 SMA for th

Introducing Full Pro Shooter, an innovative Expert Advisor created for traders who are looking for a safer strategy in transacting on the forex market This EA combines of Hedging & Averaging strategy to deliver a robust and profitable trading system.
This EA has passed a 5++ year backtest
Key Features: Averaging : Full Pro Shooter maximizes profits while managing risk through an averaging. The take profit level for all positions will be adjusted to the averaging number of positions that ar
Brilliant Reversal Indicator - Your Ultimate Alert-Driven Trading Solution Unlock the potential for unparalleled trading success with the "Brilliant Reversal Indicator." This powerful tool has been meticulously designed to empower traders by identifying critical reversal opportunities with lightning-fast alerts. Key Features : Precise Reversal Detection : The Brilliant Reversal Indicator specializes in pinpointing potential trend reversals, helping you seize opportunities to enter or exit positi
Batman EA is a very simple expert system that works with ZigZag Indicator and using breakout strategy. It only opens trade when market actually breakout. It opens maximum 2 trades (1 buy and 1 sell if one of those does not close). It is very easy to use, does not need any complicated settings, just add it to a chart and it will run like clockwork for you. You can trade or test it on XAUUSD because we created this EA for this pair, but you can also trade or test FX, or any other currency pairs wi

Hola Traders. Lot - lot size for pending orders. Martingale - double lot size of pending orders. *(No Martingale = 1.00) TotalGridEachSide - unit each side of pending orders. ( 1 pip = 10 points for a 5-digit broker ) SpaceOfFirstOrder - distance for the first order in points. ( 1 pip = 10 points for a 5-digit broker ) Take Profit - profit in points. ( 1 pip = 10 points for a 5-digit broker ) Stop Loss - loss in points. ( 1 pip = 10 points for a 5-digit broker )
and you can open order BUYS

Barcode EA is a fully automated EA. It works using a combination of martingale and scalping. The Expert Advisor works on all available timeframes and is multi-currency. This EA has been programmed to provide 12-25% per month . Barcode Expert Advisor is protected from out-of-trade losses. It has built-in protection and position recalculation functions, which protect the Expert Advisor from excessive orders and the main grid building cycle failure during terminal restarts. The Barcode EA robot F

This indicator provides several drawing tools to assist in various methods of chart analysis.
The drawings will keep their proportions (according to their handle trendline) across different chart scales, update in real time, and multiple drawings are supported.
#
Drawing Option
Description
1 Grid box draggable boxed grid, user defines rows x colums, diagonal ray option 2 Grid partial or fullscreen grid, sized by handle line 3 Grid flex a diagonal grid, sized and sloped by handle line

Parabolic SAR strategies EA is a Parabolic SAR EA that can support multiple strategies. Purchasing this EA can save you the time taken to automate your existing PSAR strategy through coding a custom EA and it also helps you discover profitable Parabolic SAR strategies as its fully compatible with the strategy tester and all settings are editable. The EA supports both scalping, short term and long term strategies. The various supported settings are explained below: NOTE: The default settings in t

EA Setting, Common Common
1)Long & Short -allow EA open short and long position
Live Trading
1)Tick -Allow live trading
Safety
Tick All
1)Allow DLL import
2)Allow import of external experts
3)Allow modification Signal settings Inputs Variable Value Remarks Open new series true Make it default Trade BUY true Make it default Trade SELL true
Make it default Support manual order true
Make it default Max sell order 10 You may co
Indicator Rua Alert Line. This indicator will notify when the High-price of candle breaks any TrendLine or HorizontalLine on the chart. Notifications will be sent to the phone and on MT4. And it have ArrowBuy/ArrowSell on chart. It is very useful for those of you who use the TrendLine or HorizontalLine but do not have time to observe the chart. RuaCoder Zalo_Tel: 033.818.8914 Telegram : https://t.me/Ruacoder

A Bollinger Bands hedge strategy is a trading strategy that utilizes Bollinger Bands to make trading decisions and manage risk. Bollinger Bands are a technical analysis tool that consists of a middle band (usually a simple moving average) and two outer bands that are typically set at a certain number of standard deviations away from the middle band. These bands expand and contract based on market volatility. Here's a basic outline of a Bollinger Bands hedge strategy: Objective : The primary goal
SwS Scalping whit Stocastic: It is a scalping system that uses the stocastic signal as a reference to enter the market.
It is a very aggressive system so it needs volatile pairs with little spread.
The system detects turning points and operates small market corrections.
All orders have a stoploss. And it has a virtual trailing.
This system is suitable for small accounts and can be used with only $ 10 0 .
You can download the demo and test it yourself.
Very stable growth curve
This is a special edition of the On-Balance Volume indicator based on pseudo-real volumes emulated from tick volumes. It calculates a near to real estimation of trade volumes distribution for Forex instruments (where only tick volumes are available) and then applies conventional OBV formula to them. Volumes are calculated by the same algorithm that's used in the indicator TrueVolumeSurrogate . The indicator itself is not required but can be used for reference.
Parameters MAfast - fast moving a

Divergence is one of the vital signals that depicts the upcoming price reversal in the market. KT Stoch Divergence shows the regular and hidden divergences build between the price and stochastic oscillator.
Limitations of KT Stoch Divergence
Using the Stochastic divergence as a standalone entry signal can be risky. Every divergence can't be interpreted as a strong reversal signal. For better results, try to combine it with price action and trend direction.
Features
Marks regular and hidde

KT Heiken Ashi Alert plots the buy and sell arrows and generate alerts based on the standard Heiken Ashi candles. Its a must use tool for the traders who want to incorporate Heiken Ashi in their trading strategy. A buy arrow plotted when Heiken Ashi change to a bullish state from bearish state. A sell arrow plotted when Heiken Ashi change to a bearish state from bullish state. Mobile notifications, Email, Sound and Pop-up alerts included.
What exactly is Heiken Ashi? In Japanese, the term Hei
The Bollinger R (Bollinger Reversals) is designed to recognize short term high profitable counter trend patterns from the chart. This system combines both Bollinger Bands and mean reversion to define positions where the market could potentially reverse direction. Description Bollinger Bands are well known in the trading community. General concept with Bollinger method is selling when the price touches the upper band and buying when the price touches the lower band. Even though it works perfectly

Strategy quick description :
- Forex trading on H1 time unit
- The daily pivot point (DPP) defines the trend
- Buy or Sell when SMA15 cut with DPP regarding SMMA5 and RSI10 and the last candle values
- Close positions when SMA15 cut-reversed DDP
- Do not take position before the 02:00 AM
- Multiple positions are allowed, default = 5 positions
- Risk management, default Exposure = 1% for each order
- Use of a Stop Loss
- Positions can stay opened several days
- Do not take positi

Vizzion is a fully automated scalping Expert Advisor that can be run successfully using GBPJPY currency pair at H1 timeframe. Very Important
This Expert Advisor can not run with any EAs in the same account. As part of the money management plan, it calculates and monitors the Margin Level % and assumes that all open trades are created by it. If you want an Expert Advisor that trades in a daily basis, this EA is not for you because using this requires a patience to wait for a few days or weeks o

The original Ilan EA for MetaTrader 4 This is the original Ilan EA for the MetaTrader 4 trading terminal. The strategy needs no advertising as it is well known even to novice traders.
Settings of the Expert Advisor The Expert Advisor can easily be set, while allowing you to adjust any important parameters of the strategy. Available Features: Unique MagicNumber for identification of trades; Trade direction option ( Trade direction ): buy only, sell only, or both directions simultaneously; Ste
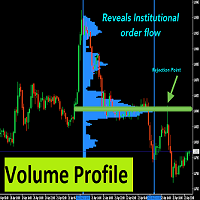
With Fixed Range Volume Profile,The traces left by the big players will not go unnoticed by you.
Professional Volume Profile Indicator reveals Institutional order flow. This advanced market indicator will teach you to spot the buying and selling. Dont want to say more because its well known by most professionals trader. This Indicator : - Quickly Identify the Strongest Institutional S/R Zones. - W orks with all Trading Instruments (Forex, Futures, Indexes, Commodities, Stocks, Cryptoc

RSI Dashboard is a great tool for quickest possible analysis of multiple currency pairs at the same time in terms of Oversold or Overbought .
All displayed and used by indicator symbols are freely to choose and are specified using a space separated list in parameters you're able to analyze not only predetermined ones, but everything that your broker offers, also commodities, equities, indices, ones with prefixes, suffixes etc.
There are 3 types of alerts: alert notifications in the MT4 term

The Trend PA indicator uses Price Action and its own filtering algorithm to determine the trend. This approach helps to accurately determine entry points and the current trend on any timeframe. The indicator uses its own algorithm for analyzing price changes and Price Action. Which gives you the advantage of recognizing, without delay, a new nascent trend with fewer false positives. Trend filtering conditions can be selected in the settings individually for your trading style. The indicator

Description Better version of RSI indicator which offer a complete visual trading strategy and realize an auto-optimization Support: We create great tools for the entire trading community. Most of them are free. If you believe in what we do Support Us Here. KEY LINKS: How to Install – Frequent Questions - All Products How is this indicator useful? NEVER repaints. Detect best parameters of RSI indicator, based on profit factor during the specified period. This indicator can be used as

This is an advanced multi-timeframe version of the popular Hull Moving Average (HMA). Features Graphical panel with HMA indicator data from all timeframes at the same time . If the HMA has switched its direction on any timeframe, a question mark or exclamation mark is displayed on the panel, accompanied by a text and audio message. The messages can be configured separately for each timeframe using the corresponding checkboxes.
The indicator is located in a separate window, so as not to overloa

PW Oscillator - индикатор предназначенный для поиска локальных экстремумов, определения текущей тенденции. В расчетах индикатора используется авторская методика. С помощью индикатора можно определять места возможного разворота цены желательно в направлении тенденции, но также с достаточной точностью и против нее. Также с помощью индикатора можно определять текущую тенденцию. Индикатор подходит для любых валютных пар, но для адекватного отображения показания необходимо, чтобы было достаточно ис
View and compare the swaps of all symbols in the Market Watch in one dashboard. A helpful tool for traders who like to use the swap to their advantage, or simply avoid trading against punishing swap rates. Choose whether you want to view the unedited swaps; adjust the swaps to show as a percentage of the Average True Range (ATR); or show the amount of currency you will get each day for trading the symbol using a given lot size. Sort the symbols by Name, or by their long or short swap value, by c
The FX AlgoTrader Advanced Moving Average Crossover Alert System is a highly configurable MT4 indicator which incorporates a fully automated alert system for monitoring two trader defined moving averages. Automatic display of fast and slow moving averages Integration with Alerts Pro package - Voice synthesized alerts system - allows complete freedom from the screen (requires Alerts Pro package) Simple, Exponential, Smoothed and Weighted Moving Average options. Configurable calculation price i.e

Fixed SL TP Simple EA use Breakout Strategy on Range to enter into the trade. This is my first design for a fixed risk trading system. So profit gain will be not that great.
Check out this new EA with better profit on fixed SL - Trend Following Expert Advisor
You will either make money on a trade or lose money on it. Be a man and simply move on to the nest trade setup.
This EA DO NOT USE any kind of risky money management like (Martingale or Grid) system to recover your losses.
The EA
YOU ARE PUCHASING A FOREX INDICATOR THAT WAS CUSTOM BUILT IN 2021 THIS INDICATOR WILL HELP YOU FIND PRECISE ENTRIES FOR TRADES. SO HOW DOES IT WORK? 1) It looks for engulfing candlestick pattern. (It can tell if there is a bullish or bearish engulfing pattern which is a typically a reversal signal) 2) It will also look to see if price is near a short term extreme by using Bollinger Bands. 3) It combines the engulfing candle stick pattern along with Bollinger Bands to give signal 4) If price has
This EA you can automatically act on trend lines of your choice. You only need to draw a line and then press the buy or sell button. Suitable for traders the chart pattern (triangles, channels, spikes ...) act. The tool is also suited for quick and easy to set Pending Orders.
Input parameters Magic - Choose magic number MoneyManagement - Automatically calculated lot size, values are displayed on the lines RiskMode - Choose risk model RiskPercent or RiskMoney RiskPercent - In percent when money

The "Spread Monitor" indicator allows you to analyze the spread change during the day, control the expansion of the spread by your broker and has a number of interesting additional features Choosing a broker with a minimum spread value is very important for the work of night advisors, scalping and intraday trading.
However, the MT4 terminal does not store spread data, so the multifunctional "Spread Monitor" indicator will be useful for any intraday trader. Features:
The indicator shows the cu
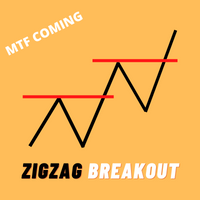
MTF Update will be soon
Price Increase Soon, It just Off price only for first 10 copies. ZigZag Breakout Arrow Very high accurate buy and sell signals provide , you can also use as market reverse signal or Trend change alert Features. ZigZag Parameters changeable. Alerts. Buy and Sell Signal. ZigZag Breakout on candle close or candle high price. and MTF Update will coming soon.

BreakEven Line is a very useful and easy to use indicator. In case of multiple positions opened on the same instrument, the indicator shows the breakeven point where it is possible to close the positions. Its graphic simplicity makes it an unobtrusive and customizable tool. You can enable/disable a line on a chart, so you can make the indicator invisible. Inputs Show cumulative BE (line on/off) Breakeven line color (to change the line color) Breakeven line style Breakeven line width Show short B

El 'Grid Master Trend' es un Asesor Experto fácil de configurar. Las 'configuraciones' más importantes son gestionar el riesgo correctamente. El riesgo se puede gestionar a través del número de lotes, aumento de lote por operación, distancia por operación, stop loss, trailing stop, ganancias, niveles para órdenes, delta y órdenes pendientes por límite o por stop individualmente o haciendo un trailing de cuadrícula / grid. Puedes usar una cuenta de céntimos . Bajo spread y ejecución rápida deseab
TRACKINGLEVELS (SOPORTES Y RESISTENCIAS)
TrackingLevels es un indicador de niveles de seguimiento. Es un indicador muy útil ya que supone un ahorro considerable de tiempo a la hora de enfrentarse y analizar un gráfico. Los niveles de resistencia y soporte son muy importantes, definen zonas donde puede haber una acumulación considerable de órdenes de venta o compra. Son zonas clave y que todo trader debe conocer y tener presente en todo momento. Este indicador ayuda al trader a no despis

DoublePower Gold is a fully automated Forex trading Expert Advisor. The robot runs on XAUUSD H1.
Expert Advisor Advantages The EA does not use such systems as Martin, hedging, etc. Good testing results with 99.9% of simulation quality. Need only to set lot size or risk and Magic number.
Settings OnlyClose - only close positions. True False Risk - risk money managment. Use Lot Small Midle Max Lot - fixed lot value. Magic - magic number.

There are only a limited number of copies left, priced at 135 USD . After that, the price will be raised to 250 USD. All backtests were done with a modelling quality of 99.90%. For comfortable trading, you need to reduce the Stop Loss (SL) in the settings.
The "Monika EA" advisor processes a large amount of data and uses it efficiently to make the right decision. The algorithm does not depend on market weather.
The EA must be installed on all supported currency pairs on the M15 timeframe
CECCONIS L42 004 It's 7 modules make this EA very Dynamic to say the least. Specifically designed and tested using EURUSD we recommend using this pair as a default.This EA will show high drawdown at times which is mainly a result of its ability to bring the action outside the safe realm of its equity. This is not to say there's no risk to your equity, but our use of this EA recoommends the default settings (download here) to stay on the safer side. Run extensive tests to see for yourself. VERY I

Parabolic SAR is one of the most popular indicators allowing you to determine in a timely manner the trend reversal, get an early entry point and accurately define the place of profit taking. Parabolic SAR is very efficient in case of a trendy market but often gives false signals during a flat. In order to sort such signals out, it is possible to use the same indicator on higher timeframes. This eliminates the main drawback of the indicator during a flat, while retaining its advantage of early e
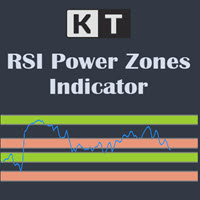
The KT RSI Power Zones divides and shows the movement of RSI into four different power zones to identify the potential support and resistance zones using the RSI.
Bull Support The bull support ranges from 40 to 50. The price is expected to reverse to the upside from this zone.
Bull Resistance The bull resistance ranges from 80 to 90. The price is expected to reverse to the downsize from this zone.
Bear Support The bear support ranges from 20 to 30. The price is expected to reverse to the

With the MACD Multi Time Frame indicator you can spot divergences of higher timeframes while you are searching for pinpointed entries on lower timeframes. This blog post gives you real-time MACD Divergence Analysis for free and tips how to trade the divergences: Real-Time MACD Divergence Analysis The MACD Multi Time Frame gives you an very good overview of what is happening on higher timeframes without the need of switching to the higher timeframe. You will e.g. always see the MACD value of the

Overview A One-Cancels-the-Other Order (OCO) is a pair of orders stipulating that if one order is executed, then the other order is automatically cancelled. Verdure OCO EA brings this functionality to MT4. This EA is a robust implementation of the popular One-Cancels-the-Other Order (OCO) but with added benefits, features and options. It is an EA that helps with trade management and especially useful for traders who use stop and reverse trading systems, traders who look for opportunities around
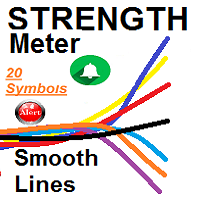
SMOOTH STRENGTH METER INDICATOR (SMOOTH LINE) it draws Currencies TREND Volatility Power / Strength lines : - Detects the 2 highly TRENDED Volatile pairs ( will be the Bold Lines ) - A very Helpful Indicator - It draws smooth lines for up to 20 currencies pairs representing Volatility strength and power - First it indicates the most powerful trended direction pairs : Strongest / Weaker - MAIN FUNCTION :it gives indication of the UP trend most Volatile Line and the
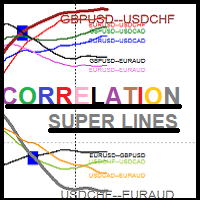
SUPER Correlation Lines for Symbols Multi timeframes Multi Currencies Indicator Each line indicates 2 symbols correlation based on Multi timeframes symbols strength calculations
5 symbols -> 10 correlation indicator lines Strategy:1 is based on selecting the NEW weaker/stronger correlation line : *****New Weaker Line Crossing DOWN the old weaker line : SELL SYMBOL1 && BUY SYMBOL2 *****New Stronger Line Crossing UP the old weaker line : BUT SYMBOL1 && SELL SYMBOL2
You close trades when
El Mercado MetaTrader es una plataforma única y sin análogos en la venta de robots e indicadores técnicos para traders.
Las instrucciones de usuario MQL5.community le darán información sobre otras posibilidades que están al alcance de los traders sólo en nuestro caso: como la copia de señales comerciales, el encargo de programas para freelance, cuentas y cálculos automáticos a través del sistema de pago, el alquiler de la potencia de cálculo de la MQL5 Cloud Network.
Está perdiendo oportunidades comerciales:
- Aplicaciones de trading gratuitas
- 8 000+ señales para copiar
- Noticias económicas para analizar los mercados financieros
Registro
Entrada
Si no tiene cuenta de usuario, regístrese
Para iniciar sesión y usar el sitio web MQL5.com es necesario permitir el uso de Сookies.
Por favor, active este ajuste en su navegador, de lo contrario, no podrá iniciar sesión.