Indicadores técnicos de pago para MetaTrader 4 - 66
Tired of looking at indicator cluttered charts? Are you a trend trader? I have just the solution for you. Trend Boss.
This indicator allows you to choose some of the most popular trend identifiers such as CCI(Supertrend) or Ichimoku and pair them with some of the most popular entries such as Kijun/Tenkan cross or MACD zero cross. You can now keep your charts clean by hiding all those oscillators and moving averages. Only arrows will be displayed depending on your entry criteria.
Trend filt

The use of indicators is extremely simple and does not contain future functions.
The use of indicators is divided into the following simple parts:
1. The indicator is blue (upward trend) -> only buy orders
2. The indicator is pink (downtrend) -> only sell orders
3. The indicator is white (consolidation trend) -> only wait and see without send orders
4. The price is above the indicator -> Only buy orders can be made
5. The price is below the indicator -> only sell orders
To sum

This indicator needs to be used in conjunction with the " Souline Honma Surf " indicator to achieve a higher winning rate.
The use of indicators is extremely simple and does not contain future functions.
The use of Souline honma wave indicators is divided into the following simple parts:
1. The indicator is blue (upward trend) -> only buy orders
2. The indicator is pink (down trend) -> only sell orders
The use of the Souline Honma Surf indicator is divided into the following parts

FOREX KISS is an indicator that picks out reversal/turning points , it is a combination of levels , clusters and volumes , works on all time frame and all instruments. While doing the paper works which took me 5 years, my aim was to build something that will give me consistent profit all over again while keeping it simple and stupid. My hope that this indicator will bring you confidence and precision.

Los modelos de regresión describen la relación entre variables ajustando una línea a los datos observados. Los modelos de regresión lineal usan una línea recta, mientras que los modelos de regresión logística y no lineal usan una línea curva. La regresión le permite estimar cómo cambia una variable dependiente a medida que cambian las variables independientes.
La regresión lineal simple se utiliza para estimar la relación entre dos variables cuantitativas.
Este indicador calcula la diferenc
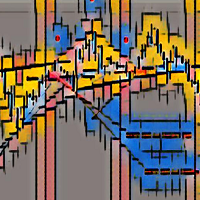
This is the one and only chart pattern indicator you need in your MT4 arsenal to for detection, showcasing and alerting for the following well-known chart patterns:
Bullish Flag Bearish Flag Bullish Pennant Bearish Pennant Bullish Cup With Handle Bearish Cup With Handle Bullish Ascending Triangle Bearish Descending Triangle Bullish Symmetrical Triangle Bearish Symmetrical Triangle Bullish Measured Move Up Bearish Measured Move Down Bullish Ascending Scallop Bearish Descending Scallop Bullish 3

Trend formation channel is a set of lines. The two central lines of the indicator represent moving averages of the specified type and period, they also form a small channel. The large channel is formed - the central lines of the indicator plus / minus the standard deviation estimate, multiplied by the coefficient selected by the user. The basic rule for plotting is that about 5% of prices should be outside these lines, and 95% - inside. If the price crosses the upper or lower line too often, th

We are an analytics company that believe in solving complicated problems with simple solutions using data. To minimize the complexities of trading, we have created a range of trading advisory products from the essence of our proprietary STAR System to enhance trading aptitude and to guide users into becoming proficient traders.
Our innovative products capitalizes on 3 core functions – Big Data, Artificial Intelligence, and Technical Expertise and it is with this core, we reshape the world
Operar en la dirección de una tendencia fuerte reduce el riesgo y aumenta el potencial de ganancias. En general, el índice direccional promedio (ADX) se usa para determinar cuándo el precio tiene una tendencia fuerte. En muchos casos, ¡es el indicador de tendencias definitivo! Después de todo, la tendencia puede ser tu amiga, pero seguro que ayuda saber quiénes son tus amigos.
ADX se utiliza para cuantificar la fuerza de la tendencia. Los cálculos de ADX se basan en un promedio móvil de expan

The Progressing Indicator is a trend indicator . The indicator is simple and clear to use. The strategy of determining trend movements is based on the author's method of market analysis. The indicator will help you as an independent trading tool. It can also serve as an addition to your trading system. Progressive indicator accurately identifies entry points. Non-profit deals are few, but if they happen, the loss on them is comparable to the commission for opening a transaction. Summary of the P

Fibonacci retracements can be used to draw support lines, identify resistance levels, place stop-loss orders and set target prices. The Advanced Automatic Fibonacci retracements draws automatically all the levels. You have a lot of options to choose. For exemple you can use the tracements of another time frame (MTF) in the current chart, you can also choose between the closest level or less close to draw the retracements. You can also add 2 levels of your choice. You can add levels extensions o

¿Qué es un pivote?
Un pivote es un nivel de precio significativo conocido de antemano que los operadores consideran importante y pueden tomar decisiones comerciales en torno a ese nivel. Como indicador técnico, un precio pivote es similar a un nivel de resistencia o soporte. Si se excede el nivel de pivote, se espera que el precio continúe en esa dirección. O el precio podría revertirse en o cerca de ese nivel.
¿Qué te dice un pivote?
Hay pivotes y puntos de pivote. Estos términos pueden
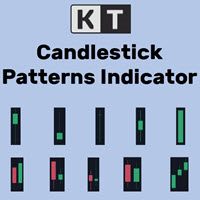
KT Candlestick Patterns finds and marks the 24 most dependable Japanese candlestick patterns in real-time. Japanese traders have been using the candlestick patterns to predict the price direction since the 18th century.
It's true that not every candlestick pattern can be equally trusted to predict the price direction reliably. However, when combined with other technical analysis methods like Support and Resistance, they provide an exact and unfolding market situation. KT Candlestick Patterns

The StatZigZag indicator looks like a regular ZigZag , but is built on the basis of completely different algorithms. The StatZigZag indicator is a broken line built from segments of regression lines of different lengths, the beginning of each of which comes from the end of the previous segment. Each regression segment is built until the variance or spread of price around it begins to exceed a certain critical value, after which the construction of this segment ends and the constr

Трендовый стрелочный индикатор. Для анализа использует несколько скользящих средних на разных таймфреймах и соотносит их с важными уровнями цены. Не перерисовывает стрелку, т.к. использует для расчета фиксированное количество исторических данных.
Пример работы индикатора приведен на скриншотах.
Лучше работает на трендовых участках рынка и показывает подтвержденное изменение направления цены. Не требует оптимизации.

El indicador IndicateMe ha sido especialmente creado para eliminar la mayor cantidad de ruido posible de las señales que emite.
El indicador se ha combinado con varios otros indicadores bien conocidos. Indicadores que se han utilizado: "Media móvil, indicador estocástico, índice de fuerza relativa, móvil".
Todos los indicadores que se utilizan pueden ser ajustados por usted mismo. La configuración predeterminada se establece en los valores que me gusta usar.
Configure alertas fácilmen
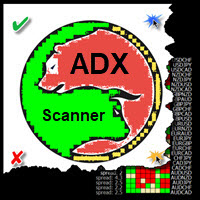
Operar en la dirección de una tendencia fuerte reduce el riesgo y aumenta el potencial de ganancias. En general, el índice direccional promedio (ADX) se usa para determinar cuándo el precio tiene una tendencia fuerte. En muchos casos, ¡es el indicador de tendencias definitivo! Después de todo, la tendencia puede ser tu amiga, pero seguro que ayuda saber quiénes son tus amigos.
ADX se utiliza para cuantificar la fuerza de la tendencia. Los cálculos de ADX se basan en un promedio móvil de expan
LordCandleSignal is an indicator for META TRADER 4, using by default ENVELOPES, STOCHASTIC, RSI techniques with Lord strategies in its source code.
LordCandleSignal issues a new buy / sell signal through its strategy before the action, that is, the signal comes before it happens.
Difficult to make mistakes, each signal sent, it is possible to close profitably even before the next signal, or using the Lord strategy, closing profitably every 20-50 pips in a comprehensive and safe way.
LordC

Signals are sent only to Buy The indicator is designed for binary options The signal is given when a new candle appears; signals for 1-2 minutes is recommended Use the expiration time and no more than one candle of the used timeframe and possibly more depending on the market and session It is recommended to trade during the American session During the testing period of the product, no redrawing was found if any, please contact us, a test version for 2 days is possible, because due to the specifi

The indicator shows entry points with Risk-Reward-Ratio 1 to 5. Main timeframe H1. Works on every pair. The main logic - is to find a reversal level, and then track the price reaction to this level. Doesn't need any settings. As a standard, it paint 5 levels of the same take-profit (red / blue for sellers and buys) and 1 stop-loss level - orange. ATTENTION! The full version of indicator. You can t est full work of indicator free only on the USDCAD pair here https://www.mql5.com/en/market/produ
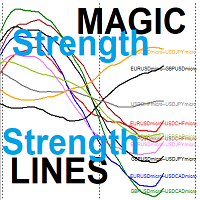
the MAGIC Smooth Strength lines for Currencies couples Each line represents the relative strength of two couples out of 5 user input symbols -> 10 indicator lines Your Strategy is based on selecting the weaker strength line and wait for a reversal sign OR Your Strategy is based on selecting the stronger strength line and wait for a reversal sign When reversal occurs you will trade on the two symbols represented by this line like the strength relative line for EURUSD and USDCAD when it is th

Vous pouvez par exemple surveiller le croisement MA en D1, pour la tendance de fond, les niveaux de surachat et de survente du RSI en H4 et du Stochastique en H4.
Cet indicateur surveille: les croisement de moyennes mobiles le niveau de surachat / survente du RSI le niveau de surachat / survente du stochastique IL vous alerte quand les trois filtres correspondent à vos paramètres (push, pop, mail) Vous pouvez choisir de l’utiliser sur un graphique pour une seule unité ou suivre plusieurs

Description Candle Power Color indicator that shows when the market is trending and when it is in a sideway movement Here you can access our discord community for more information about our tools and benefits. KEY LINKS: How to Install - Discord Server – Frequent Questions - All Products How is this indicator useful? It allow to detect trend and sideway movements in market NEVER repaints. It adapts to any market and asset. It can support any other trading strategy. Note 1: This indi

A top-quality from the famous XSuper Trend indicator. It is completely loyal to the original algorithm, and implements many useful features Which includes Trend Indicators as Filters like MACD,CCI and Alligator. The Chefs Super Trend Plus Indicator is a great way to identify the current market trend. The indicator shows a clear distinction between uptrends and downtrends. The indicators has optional filters for sound signal. Suitable for the following trending pairs: EUR/USD, GBP/USD, USD/JPY,
This indicators when combine with its master version can help you a better view in backtesting visual mode. https://www.mql5.com/en/market/product/61572 They will help you in developing a multi time frame trading strategy.
1) Run backtest in visual mode
2) Add the master indicator to the backtesting chart
3) Add the slave indicators to other charts of the same symbol with different time frames.
Run the backtest and you will see all the charts auto scrolling.
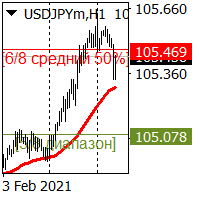
The indicator accurately displays support and resistance levels. Visualizes important strong levels and average strength levels on the chart.
It is important that the indicator does not redraw depending on the time frame change.
The indicator can be used for any form of trading, scalping, mid-range trading.. on any currency pair.
For medium-term trading, we recommend using the default parameters.
All parameters in the indicator are configurable. The indicator lines are displayed in the
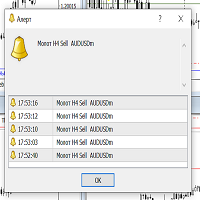
The indicator is useful for experienced traders and beginners. Displays the HAMMER candle pattern.
Simultaneously scans H1, H4, D1 and displays the corresponding alert on the screen, accompanied by an audible signal.
The alert displays information about the timeframe of the pattern and the trading symbol on which the pattern appeared.
Only you can make a decision about entering the market based on the pattern. Since it is better to enter the market from the support and resistance levels,

Description
Bitcoin Manager is the best indicator for trading Bitcoin cryptocurrency. It is calculated based on the price deviation from the moving average line channel. Ascending and descending arrows indicate potential points and levels for opening buy and sell positions.
How to use?
We strongly recommend using this indicator on the H1 timeframe. An up arrow indicates a buy level. Down Arrow - Sell Level.
Parameters
Maximum History Bars - maximum count of history bars to calculate
Binary options are the markets where the selected assets are traded according to the estimates in which direction they will move in a certain period. What is called active; are investment tools such as stocks, foreign exchange and gold.
For example; You think one of these instruments will move up in 10 minutes. You have purchased one of the suitable options. When your expectation comes true at this expiry, you will earn almost double your money.
The logic of the market; to make predictions
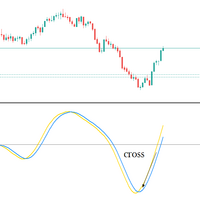
Upgraded version 1.5 , Arrow added on to indicate Buy and Sell Signal, The indicator is an ossicaltor that targets the highest buying and lowest selling levels , the signal indicated by the two lines crossing above and below zero line 0 HOW IT WORKS? Buying : you want to place your buy Entry when the yellow line is above the blue line ; stop loss just a few pips below the swing low , take profit when the lines cross again - A Buy arrow will also appear when the crossing appears Selling: yo

This strategy is best used for Trend based trading. While market is trending, price still makes smaller ranges. Darvas boxes show breakouts from these small ranges, while still following the original market trend. Detailed Description:
https://www.mql5.com/en/blogs/post/747919
Features:
- Check Darvas Box Breakout - Check Price Above/Below MA or Darvas Box has crossed MA - Min, Max Box Height - Max Distance Between Entry Price and Darvas Box - NRTR Trend Check - Heiken Trend Check - MA Slo
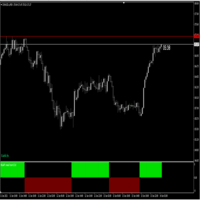
Follow Trend indicator , indicator works on Currencies , Indices ,Stocks Gold etc , good for follwoing trend on the markets suitable for scalping Buy Rules; When the histo changes to Blue you place buy order ,stop loss just below the previous swing low Sell Rules; When the histo changes to Red you place sell order ,stop loss just below the previous swing high Trade on a timeframe which best suits your trading style
This indicator calculates Correlation among currency pairs (Selected by user) to find the least and/or most correlated symbols in real time. Correlation ranges from -100% to +100%, where -100% represents currencies moving in opposite directions (negative correlation) and +100% represents currencies moving in the same direction.
Note The Correlation more than 80 (Adjustable) between two currency pairs, Shows that they are quite similar in the kind of movement and side. The Correlation less than
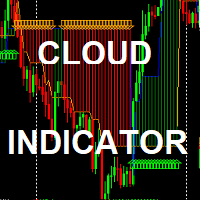
The Simple Cloud Indicator : (FREE limited time for evaluation) Strategy: Strategy is based on moving averages indicator in addition to support /resistance levels crossing *It works on any timeframe *it works on any symbols *it generates alerts *it draws uptrend / Downtrend clouds and BUY/SELL arrows inputs : *drawn start point ( in bars): not affecting strategy - it just gives you indicator history depth *alerting enable/disable

Day Trades Resistance and Support (daytradesSR) is an indicator composed of 1. The main line (support/resistance line), which shows i. either UP or DOWN trend ii. levels of dynamic support or resistance 2. A specific range defined by a line for range high and another line for range low. These lines serve as weak secondary support or resistance . 3. When the main line (support/resistance line) is first hit by the price after a detected trend reversal , either an UP ARROW (sup

Are you unhappy with the size of the main chart when using oscillators? You can add MACD, RSI, Stochastic, ATR and Momentum indicators using Main Chart Oscillators. Vertical Size : Vertical size of indicator's window Drawing Mode : Add Oscillators on same section or create a new section for any of them Draw Top Line : Draws a line in the top of indicator's section to separate it Top Line Style : Style of top line Top Line Color : Color of top line Top Line Width : Width of top line Show Indicat
Any Moving Average draws a moving average of * any indicator in a sub-window. Many Indicators included with MT4 are supported by default. You can add custom indicators as well. Settings Name Description Timeframe Select timeframe for calculation Source Indicator Select Indicator Custom Indicator Name Enter Custom Indicator Name ( when Source Indicator is set to Custom) Indicator Settings Source Indicator parameters ( separated by comma ) Moving Average Settings Moving Average parameters (

Hello Traders, A very simple but useful tool for an automatic traders. An indicator that allows you to adjust the speed of the strategy tester in a very simple way. Just drag the indicator into the chart before launching the strategy tester and adjust the speed manually, and that's all! Buttons can be located in any part of the chart as you like, just enter the x and y coordinates --------------------------------------------------------------------------------------------------------------------

Perfect Entry Spotter Indicator with Alert is based on a combination of Support Resistance, Fractals, Alligator and Moving Average indicators, based on an intense research. It has alert included with option to enable/disable it. You can trade based on it with high accuracy. Recommended trading rules: 1. Buy - Wait for the Lime arrow to appear and trade in the direction of the trend (trend going up). 2. Sell - Wait for the Red arrow to appear and trade in the direction of the trend (trend going d

This indicator is customizable to whatever settings you preferred
you only buy above the ema, and sell only under the ema using the stochastic as an entry and the ema to filter bad trades DEFAULT SETTINGS: Stochastic(8,3,3) EMA (200) *Non-Repainting
*For Desktop MT4 Only
*Great For Scalping
*Great For Swing Trading
*Arrow Entry Alerts
*Mobile Alerts
*Works On Any Timeframe
*Works On Any Mt4 Pair
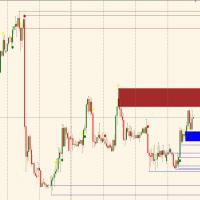
It automatically tracks the supply and demand zones and indicates the current trend. Once you have identified the trend on the main time frame just wait for the price on the operating time frame to arrive in the near future of a demand (buy) or supply (sell) zone and execute the trade. It is recommended to wait for the higher time frame trend and operational time frame to be aligned and operate exclusively on the areas indicated by the. Developed the right awareness you can achieve more and more
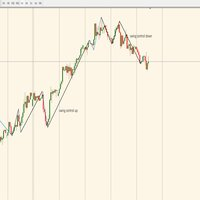
Indicator automatically translates control swings (trend-dominated market) and correction swings (retracing market); It is a simple indicator to be combined with your strategies in order to improve them and enter the market only when the trend is in control; Check on the largest time frame how the market is moving (swing black color control or swing blue color correction) from here, going down from time frame to set its operation in the direction of the trend. OPERATIONAL EXAMPLE: LOCATE DOWNWAR

We Trade Live Trend Max Our team of engineers have programmed a great tool which we have used to success and will aid you in making better decisions when placing a trade, we believe it is better than anything available on the market at the moment! try & Test Against other products and see for yourself how amazing this is. Our Main Objective is to help you as traders discover how you can take a simple trading setup and make consistent profits. We provide the fundamentals needed to trade the marke

We Trade Live Trend Levels This indicator is a fantastic addition to the We Trade Live Trend Max this helps filter out noise and helps with better entries into a trade this add on is a must have and we use it all the time along side We Trade Live Trend Max this is a fantastic tool to help with entering a trade and exiting a trade, This indicator Calculates Volume strength indicating levels of support and resistance for a trade, measures momentum in a market making buying or selling into the

This indicator identifies the major and minor swing high and low points on a chart. It then takes the most recent swing and draws a fibonacci pattern of retracement and extension levels to give you an idea of where price may move next. It allow allows you to set a pair of moving averages to help identify the direction of the overall trend. There are configuration parameters for the major and minor swing and the moving averages.
indicator for binary options the signal appears along with the opening of a new candle and signals it complete lack of redrawing recommendations buy signal blue arrow pointing up sell signal red arrow pointing down expiration time and recommended 1 candle of the timeframe used if the trade turns out to be unprofitable, you can increase the amount and open the trade again on the next signal the instrument is easy to set up, only two periods Optimal settings are already set by default the indicato

LinearRegressionDecomposition ( LRD ) Linear Regression Decomposition has been calculated using a very complex method.
Basically, by examining the retractions of the price movements of the instruments on the Metatrader platform, it is aimed to decompose these movements linearly.
The indicator is shown on the graph with two separate lines.
The red line is our main indicator and handles the price divergence.
The blue line filters the red signal.
For example, for a buy signal to occur: the red

After Purchase, Please Contact
t.me/hakimsann
These Indicator are Mixed on All Logical Value Such As
Trend
Support and Resistance
Candle Pattern
Price Action
we Combine
2 Bollinger Band
6 Zigzag Periods
4 Relative Strength Index Period
1 MACD Trend
Support and Resistance
Price Action
Pattern Candle
Avoiding Doji On Market Can Be Applied On Every Market
24-7
Maksimum Martingale lv 5.
First stake 0.4% Balance

Murrey Math Multi Timeframe Indicator Support/Resistance
Murrey Math Lines are strong tools to plot the support and resistance levels.
Murrey Math Multi Timeframe Indicator draws multi timeframe MM lines on a smaller tf chart.
General Information: According to Gann, prices move in 1/8's, these 1/8's act as points of price support and resistance as an entity's price changes in time. Given this 1/8 characteristic of price action, Murrey assigns properties to each of the MML's in an a given

We Trade Live Trend Entry & Exit is another fantastic addition to the the We trade Live trend Indicator collection This Indicator works fantastically well with our other Indicators. This Indicator is primarily used to enter a trade & Exit a Trade , and to alert you when you could possibly take a short or long on a current trend , it provides alerts on when there is a change in direction on the trend you are trading but please make sure you take into account all variables, before entering a trade

The Velocity of price change ( VP ) indicator shows the average rate of price change at those characteristic time intervals where this rate was approximately constant. The robust algorithm used in VP to smooth out the price from its random jumps, ensures the reliability of the indicator reading, which does not react to simple price volatility and its insignificant movements. The indicator allows you to track trends and the moments of their reversals , during which t

Introducción a Koala Trend Line: Creé este indicador para ayudar a los operadores a encontrar mejor la tendencia. Este indicador puede mostrarle la línea de tendencia actual. Como sabe, la línea de tendencia debe estar entre los dos puntos más altos o más bajos. Entonces, la lógica básica es encontrar los puntos más altos y más bajos. El indicador busca todos los puntos más altos y más bajos del historial y los muestra con puntos rojos y azules. Estos puntos más altos y más bajos se calculan se

The ATR Levels Indicator For MT4 is an indicator that is built specifically for traders who use the Meta Trader 4 for their trading analysis, charting of different currency pairs and trading assets, doing their technical analysis and making trading decisions all through the trading day as they work.
One of the first major advantages of using the ATR Levels Indicator For MT4 is that it automatically helps the trader to spot very important levels in the markets based on the Average True Range In
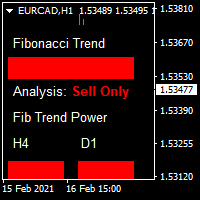
buy and sell indicator It will show you the exact entry where to buy and sell along with the indicator that will tell you the bias of the trend. For it has the ability to make your drawdowns less painful and your winning % higher, as you are following with the trend. Entries will be indicated via blue and red boxes right beside with the candles, if blue boxes will show in the charts it means buy and for the red it means sell, you follow it up with the secondary indicator which is the fib trends.
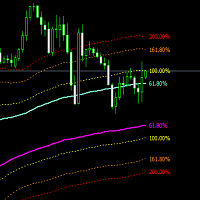
DYNAMIC CHANNEL Forex is a Metatrader 4 (MT4 (MT4)) indicator and the essence of this technical indicator is to transform the accumulated historical data. Forex DYNAMIC CHANNEL Indicator provides for an opportunity to detect various peculiarities and trends in price dynamics which are invisible to the naked eye. Based on this information, traders can assume further price movements and adjust their strategy accordingly.
Dynamic channel, which is calculated based on the maximum distance between

What Is Currency StrengtT Indicator?
A currency strengthT indicator is a graphical tool that shows the strength of a currency. Common indicators usually show the strength of a currency in relation to another currency, however, with some calculations it is possible to find the absolute strength of each individual currency.
Therefore, a currency strength matrix indicator (or meter) is a tool that tries to express the absolute strength of a currency, so that you can compare this strength with
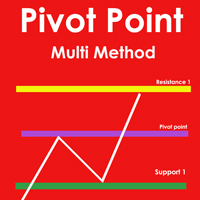
Pivot Point Multi Method is a fully automatic pivot point indicator and indicate support and resistances (S1,S2,S3,S4,R1,R2,R3,R4) based on four Methods that you can select on of them Pivot point detection and drawing support resistances Methods( Classic ,Camarilla ,Woodie ,Fibonacci)
Pivot Point Multi Method is working on all time frames and all currency pairs and gold silver and crypto currencies .
Recommended Setting : Pivot_Method select one of the methods ( Classic ,Camarilla ,Woodi

The trading system is designed to work with gold on time periods: 30M, 1H. The indicator allows you to adjust to the market situation.
Parameters for 1H : PERIOD=9F , FILTER=300 .
Parameters for 30M : PERIOD=22B , FILTER=450 .
A small adjustment to a specific broker is allowed .
If you change the amount of history displayed, you may also need to adjust the parameters.
The indicator is not redrawn.
"Gold n XAU" uses different rules for entering a trade and different ru
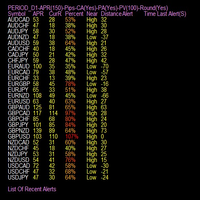
Indicator is able to alert by pop and acoustic alarm the achievement of the average price range of the last periods so as to be able to set our operation. It allows different percentage variables reached and periods of variation according to the parameters entered. Apply your reverse strategies to achieving that threshold so you get higher success rates. Indispensabile per le strategie reverse intraday.
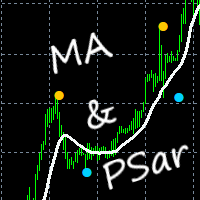
This indicator gives you PSar crossings in the form of blue and yellow dots on the chart, as well as a Moving Average. Parameters: MAPeriod (Change to your preference) Alerts PSarStep PSarShift PSarMaximum How to use: Simply attach to any chart with default settings. Sell on yellow dots, with white MA line above price. Buy on blue dots, with white MA line below price. Best results when checking the higher time frames before entering trades. Best results on Major Pairs, but can also be used on o

La distribución de Cauchy es un ejemplo clásico de distribución de cola gruesa. Las colas gruesas indican que la probabilidad de que una variable aleatoria se desvíe de la tendencia central es muy alta. Entonces, para una distribución normal, la desviación de una variable aleatoria de su expectativa matemática en 3 o más desviaciones estándar es extremadamente rara (la regla de 3 sigma), y para la distribución de Cauchy, las desviaciones del centro pueden ser arbitrariamente grandes. Esta propi

!!!!UPDATED VERSION!!!!
Multi Currency Strength Indicator is the ultimate simple multi-currency strength dash meter that consists of Signal provider and automated labelled levels, that is effective for beginners and seasoned traders to enhance their strategies. The Author coded the program for the aim of bringing simplicity yet effective indicator that is user-friendly for all who use it. Try it out , its worth a try. INDICATOR INCLUDES: 1.Push Notification to get notifications on MT4 App o

This indicator XX Power indicator.Indicator displays trend movement. Indicator helps to buy and sell.In dicator displays arrow and line. Features
FiltPer - displays indicator period.
How to understand the status: If the Trend color is green, trend is up. I f the Trend color is red, trend is down.
//////////////////////////////////////////////////////////////////////////////////////////////////////////////////////////////////////////////////// ///////////////////////////////////////
Start Signal is one of the most reliable tools for trading in the financial markets With the help of Start Signal, you can trade both Bnary Options and other markets Such as Forex Initially, Start Signal was developed for Binary Options But during the trading, it was decided that it is also well suited for scalping Moreover, it provides good accuracy Perfect for both beginners and experienced traders The signals are extremely simple and straightforward You don't need to analyze a lot of infor

the indicator is designed for trading in financial markets for scalping, pipsing the tool uses support and maintenance levels in its algorithm own strategy and unique development signals up arrow buy down arrow sale recommended for use on timeframes up to 15 m you can trade from signal to signal pay attention to the transaction no more than 2% of the deposit.
A good and reliable tool if you follow the rules of money management Developed according to its own strategy on a unique algorithm The indicator is completely sharpened for binary options Binary Luck is very easy to use, nothing needs to be configured Just add to the chart and you can start trading Perfect for both beginners and experienced traders Signals are simple and straightforward Up arrow buy Down arrow sale Recommended time of expiration and 1 candle For one deal no more than 3% of the d
We Trade Live Trend Candle Stick can help identify potential trend in the market when trading, spot market trends and predict future prices. We Trade Live Trend Candle Stick has a smoother look, as it is essentially taking an average of the movement. candles will stay RED during a downtrend and Green during an uptrend . We believe It's useful for making candlestick charts more readable and trends easier to analyse. As a breakout trader you are looking for trades that are ‘breaking out’ of
As a trader you are looking for to enter trades at the perfect time. This indicator takes advantage of any price action and indicates when a certain level has been made and a potential break out is going to be made. Check LTF (Check Long time frame) feature added to 5mins , 15mins, 30mins 1hr & 4Hr chart which will check the trend on all frames times in particular the 4hr trend. so if a alert is received to buy or sell and the trend is not correlating to long term 4hr trend . you will receive a

Back testing can't; get indicator full performance
Trading the currency markets is a complex business. With so many pairs and multiple timeframes it is almost impossible to monitor them all – but with with the Currency Heatmap you can. The Currency Heatmap indicator delivers the information you need to base your trading decisions on the entire spectrum of currency pairs derived from the 8 major currencies; namely the US dollar, the Euro, the British Pound, the Swiss Franc, the Japanese Yen,

Fibonacci Magic Pivot Levels The Fibonacci Magic Pivot Levels is a powerful yet easy to use indicator . It continuously monitor s intra-day price action and uses complex algorithms to calculate and detect key support, resistance and pivot levels, using the D1 timeframe as a filter. The Fibonacci Magic Pivot Levels is optimized for H4, H1, M30, M15, M5 & M1 timeframes and can be used on ALL Currencies, Indices, Commodities, and Cryptocurrency pairs . Trade with improved confidence an
¿Sabe usted por qué MetaTrader Market es el mejor lugar para vender estrategias comerciales e indicadores técnicos? Con nosotros, el desarrollador no tiene que perder tiempo y fuerzas en publicidad, protección del programa y ajustes de cuentas con los compradores. Todo eso ya está hecho.
Está perdiendo oportunidades comerciales:
- Aplicaciones de trading gratuitas
- 8 000+ señales para copiar
- Noticias económicas para analizar los mercados financieros
Registro
Entrada
Si no tiene cuenta de usuario, regístrese
Para iniciar sesión y usar el sitio web MQL5.com es necesario permitir el uso de Сookies.
Por favor, active este ajuste en su navegador, de lo contrario, no podrá iniciar sesión.