Guía práctica de MQL5: Desarrollo de un indicador de volatilidad multisímbolo en MQL5
Anatoli Kazharski | 7 mayo, 2014
Introducción
En este artículo, trataremos el desarrollo de un indicador de volatilidad multisímbolo. El desarrollo de los indicadores multisímbolo puede presentar algunas dificultades para los desarrolladores novatos de MQL5 que este artículo ayudará a aclarar. Los temas importantes que aparecerán a lo largo del desarrollo de un indicador multisímbolo tendrán que ver con la sincronización de otros símbolos respecto al símbolo actual, la falta de algunos datos de los indicadores y la identificación del principio de las barras "true" (verdaderas) en un periodo de tiempo determinado. Se tendrán en cuenta de cerca todas estas cuestiones en este artículo.
Conseguiremos los valores del indicador Promedio del rango verdadero (ATR de sus siglas en inglés) calculado para cada símbolo en función del controlador. Para fines ilustrativos, habrá seis símbolos cuyos nombres se pueden ajustar en los parámetros externos del indicador. Se comprobará si los nombres introducidos son correctos. En caso de que un determinado símbolo especificado en los parámetros no esté disponible en la lista general, no se realizarán sus cálculos. Se añadirán todos los símbolos disponibles a la ventana de Observación del Mercado, a menos que ya estén disponibles allí.
En el artículo anterior "Guía práctica de MQL5: Controles de la subventana del indicador: Barra de desplazamiento" ya habíamos mencionado el lienzo donde puede representar textos e incluso dibujar. Esta vez, no vamos a utilizar el lienzo para dibujar si no que lo vamos a utilizar para mostrar mensajes acerca de los procesos actuales del programa que permitan al usuario saber lo que sucede en un punto dado del tiempo.
Desarrollo del Indicador
Empecemos con el desarrollo del programa. Usando MQL5 Wizard, cree una plantilla de indicadores personalizada. Después de algunas modificaciones, debe conseguir el siguiente código fuente:
//+------------------------------------------------------------------+
//|                                               MultiSymbolATR.mq5 |
//|                        Copyright 2010, MetaQuotes Software Corp. |
//|                                              http://www.mql5.com |
//+------------------------------------------------------------------+
//--- Indicator properties
#property copyright "Copyright 2010, MetaQuotes Software Corp."
#property link      "http://www.mql5.com"
#property version   "1.00"
#property indicator_separate_window // Indicator is in a separate subwindow
#property indicator_minimum 0       // Minimum value of the indicator
#property indicator_buffers 6       // Number of buffers for indicator calculation
#property indicator_plots   6       // Number of plotting series
//+------------------------------------------------------------------+
//| Custom indicator initialization function                         |
//+------------------------------------------------------------------+
int OnInit()
  {
//--- Initialization completed successfully
   return(INIT_SUCCEEDED);
  }
//+------------------------------------------------------------------+
//| Deinitialization                                                 |
//+------------------------------------------------------------------+
void OnDeinit(const int reason)
  {
  }
//+------------------------------------------------------------------+
//| Custom indicator iteration function                              |
//+------------------------------------------------------------------+
int OnCalculate(const int      rates_total,     // Size of input time series
                const int      prev_calculated, // Bars processed at the previous call
                const datetime &time[],         // Opening time
                const double   &open[],         // Open prices
                const double   &high[],         // High prices
                const double   &low[],          // Low prices
                const double   &close[],        // Close prices
                const long     &tick_volume[],  // Tick volumes
                const long     &volume[],       // Real volumes
                const int      &spread[])       // Spread
  {
//--- Return the size of the data array of the current symbol
   return(rates_total);
  }
//+------------------------------------------------------------------+
//| Timer function                                                   |
//+------------------------------------------------------------------+
void OnTimer()
  {
  }
//+------------------------------------------------------------------+
Para poner en marcha nuestra idea, llenaremos aún más esta plantilla con todo lo que se solicita. Más adelante en este artículo, se explicará la necesidad de un temporizador. Agreguemos constantes al principio, justo después de las propiedades específicas del indicador:
//--- Constants
#define RESET           0 // Returning the indicator recalculation command to the terminal
#define LEVELS_COUNT    6 // Number of levels
#define SYMBOLS_COUNT   6 // Number of symbols
La constante LEVELS_COUNT contiene el valor del número de niveles representados por objetos gráficos del tipo "Horizontal Line" (línea horizontal) (OBJ_HLINE). Se pueden especificar los valores de estos niveles en los parámetros externos del indicador.
Incluyamos en el proyecto un archivo con la clase para trabajar con gráficos personalizados:
//--- Include the class for working with the canvas
#include <Canvas\Canvas.mqh>
En los parámetros externos, especificaremos el período promedio de iATR, los nombres de símbolos cuya volatilidad hay que mostrar y los valores del nivel horizontal. Los símbolos se enumeran empezando desde el 2 ya que el indicador al cual está conectado el gráfico se considera como el primer símbolo.
//--- External parameters
input  int              IndicatorPeriod=14;       // Averaging period
sinput string dlm01=""; //- - - - - - - - - - - - - - - - - - - - - - - - - - -
input  string           Symbol02       ="GBPUSD"; // Symbol 2
input  string           Symbol03       ="AUDUSD"; // Symbol 3
input  string           Symbol04       ="NZDUSD"; // Symbol 4
input  string           Symbol05       ="USDCAD"; // Symbol 5
input  string           Symbol06       ="USDCHF"; // Symbol 6
sinput string dlm02=""; //- - - - - - - - - - - - - - - - - - - - - - - - - - -
input  int              Level01        =10;       // Level 1
input  int              Level02        =50;       // Level 2
input  int              Level03        =100;      // Level 3
input  int              Level04        =200;      // Level 4
input  int              Level05        =400;      // Level 5
input  int              Level06        =600;      // Level 6
Más adelante, en el código deberíamos crear todas las variables y matrices para trabajar con ellas después. Se proporcionan todas en el siguiente código con comentarios detallados:
//--- Global variables and arrays
CCanvas           canvas;                 // Loading the class
//--- Variables/arrays for copying data from OnCalculate()
int               OC_rates_total     =0;  // Size of input time series
int               OC_prev_calculated =0;  // Bars processed at the previous call
datetime          OC_time[];              // Opening time
double            OC_open[];              // Open prices
double            OC_high[];              // High prices
double            OC_low[];               // Low prices
double            OC_close[];             // Close prices
long              OC_tick_volume[];       // Tick volumes
long              OC_volume[];            // Real volumes
int               OC_spread[];            // Spread
//--- Structure of buffers for drawing indicator values
struct buffers {double data[];};
buffers           atr_buffers[SYMBOLS_COUNT];
//--- Structure of time arrays for data preparation
struct temp_time {datetime time[];};
temp_time         tmp_symbol_time[SYMBOLS_COUNT];
//--- Structure of arrays of the ATR indicator values for data preparation
struct temp_atr {double value[];};
temp_atr          tmp_atr_values[SYMBOLS_COUNT];
//--- For the purpose of storing and checking the time of the first bar in the terminal
datetime          series_first_date[SYMBOLS_COUNT];
datetime          series_first_date_last[SYMBOLS_COUNT];
//--- Time of the bar from which we will start drawing
datetime          limit_time[SYMBOLS_COUNT];
//--- Indicator levels
int               indicator_levels[LEVELS_COUNT];
//--- Symbol names
string            symbol_names[SYMBOLS_COUNT];
//--- Symbol handles
int               symbol_handles[SYMBOLS_COUNT];
//--- Colors of indicator lines
color             line_colors[SYMBOLS_COUNT]={clrRed,clrDodgerBlue,clrLimeGreen,clrGold,clrAqua,clrMagenta};
//--- String representing the lack of the symbol
string            empty_symbol="EMPTY";
//--- Indicator subwindow properties
int               subwindow_number        =WRONG_VALUE;              // Subwindow number
int               chart_width             =0;                        // Chart width
int               subwindow_height        =0;                        // Subwindow height
int               last_chart_width        =0;                        // Last saved chart width
int               last_subwindow_height   =0;                        // Last saved subwindow height
int               subwindow_center_x      =0;                        // Horizontal center of the subwindow
int               subwindow_center_y      =0;                        // Vertical center of the subwindow
string            subwindow_shortname     ="MS_ATR";                 // Short name of the indicator
string            prefix                  =subwindow_shortname+"_";  // Prefix for objects
//--- Canvas properties
string            canvas_name             =prefix+"canvas";          // Canvas name
color             canvas_background       =clrBlack;                 // Canvas background color
uchar             canvas_opacity          =190;                      // Opacity
int               font_size               =16;                       // Font size
string            font_name               ="Calibri";                // Font
ENUM_COLOR_FORMAT clr_format              =COLOR_FORMAT_ARGB_RAW;    // Color components should be correctly set by the user
//--- Canvas messages
string            msg_invalid_handle      ="Invalid indicator handle! Please wait...";
string            msg_prepare_data        ="Preparing data! Please wait...";
string            msg_not_synchronized    ="Unsynchronized data! Please wait...";
string            msg_load_data           ="";
string            msg_sync_update         ="";
string            msg_last                ="";
//--- Maximum number of bars specified in the terminal settings
int               terminal_max_bars=0;
Al cargar el indicador en el gráfico, la función OnInit() realizará las acciones siguientes:
- configurar las propiedades del indicador;
- determinar las matrices para la elaboración de series de dibujo;
- inicializar las matrices;
- agregar símbolos especificados en los parámetros externos a la ventana Observación del Mercado;
- comprobar que los parámetros con correctos y hacer el primer intento para conseguir los controladores del indicador.
Se tratarán todas estas acciones de una forma más conveniente si se organizan en funciones separadas. Como consecuencia, el código fuente de la función OnInit() será muy fácil de comprender como se muestra a continuación:
//+------------------------------------------------------------------+
//| Custom indicator initialization function                         |
//+------------------------------------------------------------------+
int OnInit()
  {
//--- Check input parameters for correctness
   if(!CheckInputParameters())
      return(INIT_PARAMETERS_INCORRECT);
//--- Set the timer at 1-second intervals
   EventSetTimer(1);
//--- Set the font to be displayed on the canvas
   canvas.FontSet(font_name,font_size,FW_NORMAL);
//--- Initialization of arrays
   InitArrays();
//--- Initialize the array of symbols
   InitSymbolNames();
//--- Initialize the array of levels
   InitLevels();
//--- Get indicator handles
   GetIndicatorHandles();
//--- Set indicator properties
   SetIndicatorProperties();
//--- Get the number of bars specified in the terminal settings
   terminal_max_bars=TerminalInfoInteger(TERMINAL_MAXBARS);
//--- Clear the comment
   Comment("");
//--- Refresh the chart
   ChartRedraw();
//--- Initialization completed successfully
   return(INIT_SUCCEEDED);
  }
Echemos un vistazo más de cerca a las funciones personalizadas utilizadas en el código antes mencionado. En la función CheckInputParameters(),comprobamos si los parámetros externos son correctos. En nuestro caso, sólo comprobamos un parámetro; el período del indicador ATR. He puesto 500 como valor de restricción. Es decir, si pone el valor del período más alto que el valor especificado, el indicador dejará de funcionar e imprimirá el mensaje sobre el motivo de la finalización del programa para el registro y los comentarios del gráfico. El código de la función CheckInputParameters() se proporciona a continuación.
//+------------------------------------------------------------------+
//| Checking input parameters for correctness                        |
//+------------------------------------------------------------------+
bool CheckInputParameters()
  {
   if(IndicatorPeriod>500)
     {
      Comment("Decrease the indicator period! Indicator Period: ",IndicatorPeriod,"; Limit: 500;");
      printf("Decrease the indicator period! Indicator Period: %d; Limit: %d;",IndicatorPeriod,500);
      return(false);
     }
//---
   return(true);
  }
Luego tenemos tres funciones para inicializar las matrices: InitArrays(), InitSymbolNames() e InitLevels(). Se proporcionan sus respectivos códigos fuente a continuación:
//+------------------------------------------------------------------+
//| First initialization of arrays                                   |
//+------------------------------------------------------------------+
void InitArrays()
  {
   ArrayInitialize(limit_time,NULL);
   ArrayInitialize(series_first_date,NULL);
   ArrayInitialize(series_first_date_last,NULL);
   ArrayInitialize(symbol_handles,INVALID_HANDLE);
//---
   for(int s=0; s<SYMBOLS_COUNT; s++)
      ArrayInitialize(atr_buffers[s].data,EMPTY_VALUE);
  }
//+------------------------------------------------------------------+
//| Initializing array of symbols                                    |
//+------------------------------------------------------------------+
void InitSymbolNames()
  {
   symbol_names[0]=AddSymbolToMarketWatch(_Symbol);
   symbol_names[1]=AddSymbolToMarketWatch(Symbol02);
   symbol_names[2]=AddSymbolToMarketWatch(Symbol03);
   symbol_names[3]=AddSymbolToMarketWatch(Symbol04);
   symbol_names[4]=AddSymbolToMarketWatch(Symbol05);
   symbol_names[5]=AddSymbolToMarketWatch(Symbol06);
  }
//+------------------------------------------------------------------+
//| Initializing array of levels                                     |
//+------------------------------------------------------------------+
void InitLevels()
  {
   indicator_levels[0]=Level01;
   indicator_levels[1]=Level02;
   indicator_levels[2]=Level03;
   indicator_levels[3]=Level04;
   indicator_levels[4]=Level05;
   indicator_levels[5]=Level06;
  }
En la función InitSymbolNames(), utilizamos otra función personalizada; AddSymbolToMarketWatch(). Recibe el nombre del símbolo y si este símbolo está disponible en la lista general, se añadirá a la ventana Observación del Mercado y la función devolverá la cadena con el nombre del símbolo. Si ese símbolo no está disponible, la función volverá a la cadena "EMPTY" y no se realizará ninguna acción más para este elemento en la matriz de símbolos al ejecutar comprobaciones en otras funciones.
//+------------------------------------------------------------------+
//| Adding the specified symbol to the Market Watch window           |
//+------------------------------------------------------------------+
string AddSymbolToMarketWatch(string symbol)
  {
   int      total=0; // Number of symbols
   string   name=""; // Symbol name
//--- If an empty string is passed, return the empty string
   if(symbol=="")
      return(empty_symbol);
//--- Total symbols on the server
   total=SymbolsTotal(false);
//--- Iterate over the entire list of symbols
   for(int i=0;i<total;i++)
     {
      //--- Symbol name on the server
      name=SymbolName(i,false);
      //--- If this symbol is available,
      if(name==symbol)
        {
         //--- add it to the Market Watch window and
         SymbolSelect(name,true);
         //--- return its name
         return(name);
        }
     }
//--- If this symbol is not available, return the string representing the lack of the symbol
   return(empty_symbol);
  }
GetIndicatorHandles() es otra función a la que se llama en la inicialización del indicador. Procura conseguir los controladores del indicador ATR para cada símbolo especificado. Si no se ha obtenido el controlador para algún símbolo, la función devolverá falso pero esto no se va a procesar de ninguna forma en OnInit() ya que la disponibilidad del controlador será comprobada en otras partes del programa.
//+------------------------------------------------------------------+
//| Getting indicator handles                                        |
//+------------------------------------------------------------------+
bool GetIndicatorHandles()
  {
//--- An indication of all handles being valid
   bool valid_handles=true;
//--- Iterate over all symbols in a loop and ...
   for(int s=0; s<SYMBOLS_COUNT; s++)
     {
      //--- If the symbol is available
      if(symbol_names[s]!=empty_symbol)
        {
         // And if the handle of the current symbol is invalid
         if(symbol_handles[s]==INVALID_HANDLE)
           {
            //--- Get it
            symbol_handles[s]=iATR(symbol_names[s],Period(),IndicatorPeriod);
            //--- If the handle could not be obtained, try again next time
            if(symbol_handles[s]==INVALID_HANDLE)
               valid_handles=false;
           }
        }
     }
//--- Print the relevant message if the handle for one of the symbols could not be obtained
   if(!valid_handles)
     {
      msg_last=msg_invalid_handle;
      ShowCanvasMessage(msg_invalid_handle);
     }
//---
   return(valid_handles);
  }
La función ShowCanvasMessage() será comprobada poco después junto con otras funciones para trabajar con el lienzo.
Se ajustan las propiedades del indicador en la función SetIndicatorProperties(). Dado que las propiedades para cada serie de trazado son similares, es más conveniente ajustarlas utilizando bucles:
//+------------------------------------------------------------------+
//| Setting indicator properties                                     |
//+------------------------------------------------------------------+
void SetIndicatorProperties()
  {
//--- Set the short name
   IndicatorSetString(INDICATOR_SHORTNAME,subwindow_shortname);
//--- Set the number of decimal places
   IndicatorSetInteger(INDICATOR_DIGITS,_Digits);
//--- Define buffers for drawing
   for(int s=0; s<SYMBOLS_COUNT; s++)
      SetIndexBuffer(s,atr_buffers[s].data,INDICATOR_DATA);
//--- Set labels for the current symbol
   for(int s=0; s<SYMBOLS_COUNT; s++)
      PlotIndexSetString(s,PLOT_LABEL,"ATR ("+IntegerToString(s)+", "+symbol_names[s]+")");
//--- Set the plotting type: lines
   for(int s=0; s<SYMBOLS_COUNT; s++)
      PlotIndexSetInteger(s,PLOT_DRAW_TYPE,DRAW_LINE);
//--- Set the line width
   for(int s=0; s<SYMBOLS_COUNT; s++)
      PlotIndexSetInteger(s,PLOT_LINE_WIDTH,1);
//--- Set the line color
   for(int s=0; s<SYMBOLS_COUNT; s++)
      PlotIndexSetInteger(s,PLOT_LINE_COLOR,line_colors[s]);
//--- Empty value for plotting where nothing will be drawn
   for(int s=0; s<SYMBOLS_COUNT; s++)
      PlotIndexSetDouble(s,PLOT_EMPTY_VALUE,EMPTY_VALUE);
  }
Después de inicializar el programa con éxito, debemos hacer la primera llamada a la función OnCalculate(). El valor de la variable prev_calculated es cero en la primera llamada de la función. También se pone a cero por el terminal cuando se carga un historial más profundo o se llenan los vacíos en el historial. En tales casos, los buffers del indicador se calculan de nuevo completamente. Si este valor de parámetro no es cero, es decir el resultado anteriormente devuelto por la misma función, que es el tamaño de las series cronológicas de entrada, es suficiente para actualizar solamente los últimos valores de los buffers.
No siempre se logra hacer todos los cálculos correctamente en el primer intento. En este caso, para el retorno utilizaremos la constante RESET que contiene el valor cero. En la siguiente llamada de OnCalculate() (por ejemplo en el siguiente punto), el parámetro prev_calculated contendrá el valor cero, que significa que deberemos hacer un intento más para hacer todos los cálculos necesarios antes de mostrar las series gráficas del indicador en el gráfico.
Pero el gráfico se quedará vacío cuando el mercado esté cerrado y no haya nuevos puntos o cálculos posteriores fallidos. En este caso, puede intentar una forma sencilla de dar una orden para hacer otro intento; cambiando manualmente el gráfico del periodo de tiempo. Pero utilizaremos un enfoque diferente. Es por eso que al principio añadimos el temporizador, la función OnTimer(), a nuestra plantilla del programa y pusimos el intervalo de tiempo de 1 segundo en la función OnInit().
Cada segundo, comprobará el temporizador si la función OnCalculate() ha devuelto a cero. Para este fin, escribiremos una función CopyDataOnCalculate() que copiará todos los parámetros de OnCalculate() a las variables globales con los correspondientes nombres y matrices con el prefijo OC_.
//+------------------------------------------------------------------+
//| Copying data from OnCalculate                                    |
//+------------------------------------------------------------------+
void CopyDataOnCalculate(const int      rates_total,
                         const int      prev_calculated,
                         const datetime &time[],
                         const double   &open[],
                         const double   &high[],
                         const double   &low[],
                         const double   &close[],
                         const long     &tick_volume[],
                         const long     &volume[],
                         const int      &spread[])
  {
   OC_rates_total=rates_total;
   OC_prev_calculated=prev_calculated;
   ArrayCopy(OC_time,time);
   ArrayCopy(OC_open,open);
   ArrayCopy(OC_high,high);
   ArrayCopy(OC_low,low);
   ArrayCopy(OC_close,close);
   ArrayCopy(OC_tick_volume,tick_volume);
   ArrayCopy(OC_volume,volume);
   ArrayCopy(OC_spread,spread);
  }
Esta función se debería llamar al principio del cuerpo del código de la función OnCalculate(). Además, al principio también, deberíamos agregar otra función personalizada, ResizeCalculatedArrays(), que establecerá el tamaño de las matrices para preparar los datos antes de colocarlos en los buffers del indicador. El tamaño de estas matrices debe ser igual al tamaño de las series de tiempo de entrada.
//+------------------------------------------------------------------+
//| Resizing the size of arrays to the size of the main array        |
//+------------------------------------------------------------------+
void ResizeCalculatedArrays()
  {
   for(int s=0; s<SYMBOLS_COUNT; s++)
     {
      ArrayResize(tmp_symbol_time[s].time,OC_rates_total);
      ArrayResize(tmp_atr_values[s].value,OC_rates_total);
     }
  }
Además, vamos a crear la función ZeroCalculatedArrays() que inicializa las matrices para preparar la puesta a cero de los datos antes de su representación en el gráfico.
//+------------------------------------------------------------------+
//| Zeroing out arrays for data preparation                          |
//+------------------------------------------------------------------+
void ZeroCalculatedArrays()
  {
   for(int s=0; s<SYMBOLS_COUNT; s++)
     {
      ArrayInitialize(tmp_symbol_time[s].time,NULL);
      ArrayInitialize(tmp_atr_values[s].value,EMPTY_VALUE);
     }
  }
Se requiere la misma función para los buffers de indicadores preliminares con salida cero. La vamos a llamar ZeroIndicatorBuffers().
//+------------------------------------------------------------------+
//| Zeroing out indicator buffers                                    |
//+------------------------------------------------------------------+
void ZeroIndicatorBuffers()
  {
   for(int s=0; s<SYMBOLS_COUNT; s++)
      ArrayInitialize(atr_buffers[s].data,EMPTY_VALUE);
  }
El código correspondiente a la función OnCalculate() es el siguiente. También he proporcionado comentarios para las principales operaciones para que se llenen más tarde (comentarios y puntos suspensivos).
//+------------------------------------------------------------------+
//| Custom indicator iteration function                              |
//+------------------------------------------------------------------+
int OnCalculate(const int      rates_total,     // Size of input time series
                const int      prev_calculated, // Bars processed at the previous call
                const datetime &time[],         // Opening time
                const double   &open[],         // Open prices
                const double   &high[],         // High prices
                const double   &low[],          // Low prices
                const double   &close[],        // Close prices
                const long     &tick_volume[],  // Tick volumes
                const long     &volume[],       // Real volumes
                const int      &spread[])       // Spread
  {
//--- For the purpose of determining the bar from which the calculation shall be made
   int limit=0;
//--- Make a copy of the OnCalculate() parameters
   CopyDataOnCalculate(rates_total,prev_calculated,
                       time,open,high,low,close,
                       tick_volume,volume,spread);
//--- Set the size to arrays for data preparation
   ResizeCalculatedArrays();
//--- If this is the first calculation or if a deeper history has been loaded or gaps in the history have been filled
   if(prev_calculated==0)
     {
      //--- Zero out arrays for data preparation
      ZeroCalculatedArrays();
      //--- Zero out indicator buffers
      ZeroIndicatorBuffers();
      //--- Other checks
      // ...
      //--- If you reached this point, it means that OnCalculate() will return non-zero value and this needs to be saved
      OC_prev_calculated=rates_total;
     }
//--- If only the last values need to be recalculated
   else
      limit=prev_calculated-1;

//--- Prepare data for drawing
// ...
//--- Fill arrays with data for drawing
// ...

//--- Return the size of the data array of the current symbol
   return(rates_total);
  }
El código de la función de OnTimer() es:
//+------------------------------------------------------------------+
//| Timer function                                                   |
//+------------------------------------------------------------------+
void OnTimer()
  {
//--- If for some reason calculations have not been completed or
//    a deeper history has been loaded or
//    gaps in the history have been filled,
//    then make another attempt without waiting for the new tick
   if(OC_prev_calculated==0)
     {
      OnCalculate(OC_rates_total,OC_prev_calculated,
                  OC_time,OC_open,OC_high,OC_low,OC_close,
                  OC_tick_volume,OC_volume,OC_spread);
     }
  }
Ahora, consideremos otras funciones que se van a utilizar cuando la variable prev_calculated sea igual a cero. Estas funciones:
- cargarán y generarán la cantidad necesaria de datos (barras);
- comprobarán la disponibilidad de todos los controladores;
- comprobarán la preparación de la cantidad necesaria de datos;
- sincronizarán los datos con el servidor;
- determinarán las barras a partir de las cuales se dibujarán las series de trazado.
Además, identificaremos la primera barra "true" (verdadera) para cada símbolo. Este término conciso ha sido acuñado para hacerlo más conveniente más tarde. Esto es lo que significa. Todos los periodos de tiempo en MetaTrader 5 se construyen a partir de los datos de los minutos. Pero si, por ejemplo, los datos diarios en el servidor están disponibles desde 1993, mientras que los datos del minuto están sólo disponibles desde el 2000, entonces si seleccionamos, digamos, el periodo de tiempo del gráfico a cada hora, las barras se construirán comenzando desde la fecha a partir de la cual están disponibles los das datos del minuto, es decir desde el año 2000. Todo lo anterior al 2000 o será representado por los datos diarios o por los datos más cercanos al periodo de tiempo actual. Por lo tanto, para evitar la confusión no, debería mostrar los datos del indicador para los datos que no estén relacionados con el periodo de tiempo actual. Este es el motivo por el que vamos a identificar la primera barra "verdadera" del periodo de tiempo actual y la marcaremos con una línea vertical del mismo color como la del buffer del indicador del símbolo.
La identificación de barras "verdaderas" es también importante cuando se desarrolle el Asesor Experto, puesto que si se optimizan los parámetros para un cierto periodo de tiempo, los datos de otros periodos de tiempo en este caso serían inapropiados.
Antes de ejecutar las comprobaciones antes mencionadas, agregaremos el lienzo a la subventana del indicador. De modo que primero deberíamos escribir todas las funciones que necesitaremos para controlar el lienzo. Antes de añadir el lienzo a la subventana, debemos determinar su tamaño, así como las coordenadas basadas en los mensajes de texto que se mostrarán en el lienzo. Para este fin, escribiremos una función GetSubwindowGeometry():
//+------------------------------------------------------------------+
//| Getting geometry of the indicator subwindow                      |
//+------------------------------------------------------------------+
void GetSubwindowGeometry()
  {
//--- Get the indicator subwindow number
   subwindow_number=ChartWindowFind(0,subwindow_shortname);
//--- Get the subwindow width and height
   chart_width=(int)ChartGetInteger(0,CHART_WIDTH_IN_PIXELS);
   subwindow_height=(int)ChartGetInteger(0,CHART_HEIGHT_IN_PIXELS,subwindow_number);
//--- Calculate the center of the subwindow
   subwindow_center_x=chart_width/2;
   subwindow_center_y=subwindow_height/2;
  }
Una vez obtenidas las propiedades de la subventana, puede añadir el lienzo. Su fondo será 100% transparente (opacidad igual a 0), sólo llega a ser visible al cargar y generar los datos para permitir que el usuario sepa lo que sucede actualmente. Cuando esté visible, la opacidad del fondo será igual a 190. Puede asignar cualquier valor entre 0 y 255 a la opacidad. Para más información, consulte la descripción de la función ColorToARGB() disponible en la Ayuda.
Para establecer el lienzo, vamos a escribir la función SetCanvas():
//+------------------------------------------------------------------+
//| Setting canvas                                                   |
//+------------------------------------------------------------------+
void SetCanvas()
  {
//--- If there is no canvas, set it
   if(ObjectFind(0,canvas_name)<0)
     {
      //--- Create the canvas
      canvas.CreateBitmapLabel(0,subwindow_number,canvas_name,0,0,chart_width,subwindow_height,clr_format);
      //--- Make the canvas completely transparent
      canvas.Erase(ColorToARGB(canvas_background,0));
      //--- Redraw the canvas
      canvas.Update();
     }
  }
También necesitaremos una función que compruebe si la subventana del indicador ha sido redimensionada. Si lo ha sido, el tamaño del lienzo se ajustará automáticamente al nuevo tamaño de la subventana. Llamemos a esta función OnSubwindowChange():
//+------------------------------------------------------------------+
//| Checking the subwindow size                                      |
//+------------------------------------------------------------------+
void OnSubwindowChange()
  {
//--- Get subwindow properties
   GetSubwindowGeometry();
//--- If the subwindow size has not changed, exit
   if(!SubwindowSizeChanged())
      return;
//--- If the subwindow height is less than one pixel or if the center has been calculated incorrectly, exit
   if(subwindow_height<1 || subwindow_center_y<1)
      return;
//--- Set the new canvas size
   ResizeCanvas();
//--- Show the last message
   ShowCanvasMessage(msg_last);
  }
Se pueden examinar a continuación las funciones resaltadas en el código anterior. Por favor tome nota de las clases de comprobaciones que funcionan antes de redimensionar la subventana. Si cualquier propiedad es incorrecta, la función se detiene.
El código de la función SubwindowSizeChanged() es el siguiente:
//+------------------------------------------------------------------+
//| Checking if the subwindow has been resized                       |
//+------------------------------------------------------------------+
bool SubwindowSizeChanged()
  {
//--- If the subwindow size has not changed, exit
   if(last_chart_width==chart_width && last_subwindow_height==subwindow_height)
      return(false);
//--- If the size has changed, save it
   else
     {
      last_chart_width=chart_width;
      last_subwindow_height=subwindow_height;
     }
//---
   return(true);
  }
El código de la función ResizeCanvas() es el siguiente:
//+------------------------------------------------------------------+
//| Resizing canvas                                                  |
//+------------------------------------------------------------------+
void ResizeCanvas()
  {
//--- If the canvas has already been added to the indicator subwindow, set the new size
   if(ObjectFind(0,canvas_name)==subwindow_number)
      canvas.Resize(chart_width,subwindow_height);
  }
Y por último, a continuación está el código de la función ShowCanvasMessage() que hemos usado anteriormente para conseguir el controlador del indicador:
//+------------------------------------------------------------------+
//| Displaying message on the canvas                                 |
//+------------------------------------------------------------------+
void ShowCanvasMessage(string message_text)
  {
   GetSubwindowGeometry();
//--- If the canvas has already been added to the indicator subwindow
   if(ObjectFind(0,canvas_name)==subwindow_number)
     {
      //--- If the string passed is not empty and correct coordinates have been obtained, display the message
      if(message_text!="" && subwindow_center_x>0 && subwindow_center_y>0)
        {
         canvas.Erase(ColorToARGB(canvas_background,canvas_opacity));
         canvas.TextOut(subwindow_center_x,subwindow_center_y,message_text,ColorToARGB(clrRed),TA_CENTER|TA_VCENTER);
         canvas.Update();
        }
     }
  }
Se borrará el lienzo con un efecto que hace que vaya desapareciendo poco a poco. Para implementarlo, justo antes de borrar el lienzo, tenemos que cambiar gradualmente la opacidad en un bucle de su valor actual a cero, mientras se actualiza el lienzo en cada repetición.
El código de la función DeleteCanvas() es el siguiente:
//+------------------------------------------------------------------+
//| Deleting canvas                                                  |
//+------------------------------------------------------------------+
void DeleteCanvas()
  {
//--- Delete the canvas if it exists
   if(ObjectFind(0,canvas_name)>0)
     {
      //--- Before deleting, implement the disappearing effect
      for(int i=canvas_opacity; i>0; i-=5)
        {
         canvas.Erase(ColorToARGB(canvas_background,(uchar)i));
         canvas.Update();
        }
      //--- Delete the graphical resource
      canvas.Destroy();
     }
  }
A continuación, echemos un vistazo a las funciones necesarias para comprobar la disponibilidad de los datos antes de colocarlos en buffers de indicadores y mostrarlos en el gráfico. Empecemos con la función LoadAndFormData(). La utilizamos para comparar el tamaño de la matriz actual del símbolo con los datos disponibles para otros símbolos. Si fuera necesario, se cargarán los datos del servidor. Se proporciona el código de la función con comentarios detallados para su estudio.
//+------------------------------------------------------------------+
//| Loading and generating the necessary/available amount of data    |
//+------------------------------------------------------------------+
void LoadAndFormData()
  {
   int bars_count=100; // Number of loaded bars
//---
   for(int s=0; s<SYMBOLS_COUNT; s++)
     {
      int      attempts          =0;    // Counter of data copying attempts
      int      array_size        =0;    // Array size
      datetime firstdate_server  =NULL; // Time of the first bar on the server
      datetime firstdate_terminal=NULL; // Time of the first bar in the terminal base
      //--- Get the first date by the symbol/time frame in the terminal base
      SeriesInfoInteger(symbol_names[s],Period(),SERIES_FIRSTDATE,firstdate_terminal);
      //--- Get the first date of the symbol/time frame on the server
      SeriesInfoInteger(symbol_names[s],Period(),SERIES_SERVER_FIRSTDATE,firstdate_server);
      //--- Print the message
      msg_last=msg_load_data="Loading and generating data: "+
               symbol_names[s]+"("+(string)(s+1)+"/"+(string)SYMBOLS_COUNT+") ... ";
      ShowCanvasMessage(msg_load_data);
      //--- Load/generate data.
      //    If the array size is smaller than the maximum number of bars in the terminal, and if
      //    the number of bars between the first date of the series in the terminal and the first date of the series on the server is more than specified
      while(array_size<OC_rates_total &&
            firstdate_terminal-firstdate_server>PeriodSeconds()*bars_count)
        {
         datetime copied_time[];
         //--- Get the first date by the symbol/time frame in the terminal base
         SeriesInfoInteger(symbol_names[s],Period(),SERIES_FIRSTDATE,firstdate_terminal);
         //--- Load/copy the specified number of bars
         if(CopyTime(symbol_names[s],Period(),0,array_size+bars_count,copied_time)!=-1)
           {
            //--- If the time of the first bar in the array, excluding the number of the bars being loaded, is earlier
            //    than the time of the first bar in the chart, terminate the loop
            if(copied_time[0]-PeriodSeconds()*bars_count<OC_time[0])
               break;
            //--- If the array size hasn't increased, increase the counter
            if(ArraySize(copied_time)==array_size)
               attempts++;
            //--- Otherwise get the current size of the array
            else
               array_size=ArraySize(copied_time);
            //--- If the array size hasn't increased over 100 attempts, terminate the loop
            if(attempts==100)
              {
               attempts=0;
               break;
              }
           }
         //--- Check the subwindow size once every 2000 bars
         //    and if the size has changed, adjust the canvas size to it
         if(!(array_size%2000))
            OnSubwindowChange();
        }
     }
  }
Después del intento para cargar la cantidad necesaria de datos, comprobamos una vez los controladores del indicador. Para ello, utilizamos la función GetIndicatorHandles() vista antes.
Una vez comprobado el controlador, el programa comprueba la disponibilidad de los datos especificados de los símbolos y los valores del indicador para cada símbolo que utiliza la función CheckAvailableData(). A continuación puede ver más de cerca cómo se hace esto:
//+------------------------------------------------------------------+
//| Checking the amount of available data for all symbols            |
//+------------------------------------------------------------------+
bool CheckAvailableData()
  {
   for(int s=0; s<SYMBOLS_COUNT; s++)
     {
      //--- If this symbol is available
      if(symbol_names[s]!=empty_symbol)
        {
         double   data[]; // Array for checking the amount of indicator data
         datetime time[]; // Array for checking the number of bars
         int      calculated_values =0;    // Amount of indicator data
         int      available_bars    =0;    // Number of bars of the current period
         datetime firstdate_terminal=NULL; // First date of the current time frame data available in the terminal
         //--- Get the number of calculated values of the indicator
         calculated_values=BarsCalculated(symbol_handles[s]);
         //--- Get the first date of the current time frame data in the terminal
         firstdate_terminal=(datetime)SeriesInfoInteger(symbol_names[s],Period(),SERIES_TERMINAL_FIRSTDATE);
         //--- Get the number of available bars from the date specified
         available_bars=Bars(symbol_names[s],Period(),firstdate_terminal,TimeCurrent());
         //--- Check the readiness of bar data: 5 attempts to get values
         for(int i=0; i<5; i++)
           {
            //--- Copy the specified amount of data
            if(CopyTime(symbol_names[s],Period(),0,available_bars,time)!=-1)
              {
               //--- If the required amount has been copied, terminate the loop
               if(ArraySize(time)>=available_bars)
                  break;
              }
           }
         //--- Check the readiness of indicator data: 5 attempts to get values
         for(int i=0; i<5; i++)
           {
            //--- Copy the specified amount of data
            if(CopyBuffer(symbol_handles[s],0,0,calculated_values,data)!=-1)
              {
               //--- If the required amount has been copied, terminate the loop
               if(ArraySize(data)>=calculated_values)
                  break;
              }
           }
         //--- If the amount of data copied is not sufficient, one more attempt is required
         if(ArraySize(time)<available_bars || ArraySize(data)<calculated_values)
           {
            msg_last=msg_prepare_data;
            ShowCanvasMessage(msg_prepare_data);
            OC_prev_calculated=0;
            return(false);
           }
        }
     }
//---
   return(true);
  }
La función CheckAvailableData() no permitirá hacer cálculos adicionales hasta que estén listos los datos para todos los símbolos. El funcionamiento de todas las funciones de comprobación sigue una pauta similar.
La siguiente función es necesaria para supervisar el caso de la carga de un historial de cotizaciones más profundo. La llamaremos ZeroIndicatorBuffers(). Si se carga una cantidad más grande de datos, habrá que volver a calcular el indicador por completo. El código fuente de esta función se proporciona a continuación:
//+------------------------------------------------------------------+
//| Checking the event of loading a deeper history                   |
//+------------------------------------------------------------------+
bool CheckLoadedHistory()
  {
   bool loaded=false;
//---
   for(int s=0; s<SYMBOLS_COUNT; s++)
     {
      //--- If this symbol is available
      if(symbol_names[s]!=empty_symbol)
        {
         //--- If the series need to be updated
         if(OC_prev_calculated==0)
           {
            //--- Get the first date by the symbol/time frame
            series_first_date[s]=(datetime)SeriesInfoInteger(symbol_names[s],Period(),SERIES_FIRSTDATE);
            //--- If this is the first time (no value is available), then
            if(series_first_date_last[s]==NULL)
               //--- Store the first date by the symbol/time frame for further comparison
               //    in order to determine if a deeper history has been loaded
               series_first_date_last[s]=series_first_date[s];
           }
         else
           {
            //--- Get the first date by the symbol/time frame
            series_first_date[s]=(datetime)SeriesInfoInteger(symbol_names[s],Period(),SERIES_FIRSTDATE);
            //--- If the dates are different, i.e. the date in the memory is later than the one we have just obtained,
            //     this means that a deeper history has been loaded
            if(series_first_date_last[s]>series_first_date[s])
              {
               //--- Print the relevant message to the log
               Print("(",symbol_names[s],",",TimeframeToString(Period()),
                     ") > A deeper history has been loaded/generated: ",
                     series_first_date_last[s]," > ",series_first_date[s]);
               //--- Store the date
               series_first_date_last[s]=series_first_date[s];
               loaded=true;
              }
           }
        }
     }
//--- If a deeper history has been loaded/generated, then
//    send the command to refresh the plotting series of the indicator
   if(loaded)
      return(false);
//---
   return(true);
  }
Escribamos otra función para comprobar la sincronización entre los datos en el terminal y en el servidor. Esta comprobación sólo funcionará si se establece la conexión con el servidor. El código de la función CheckSymbolIsSynchronized() se proporciona a continuación:
//+------------------------------------------------------------------+
//| Checking synchronization by symbol/time frame                    |
//+------------------------------------------------------------------+
bool CheckSymbolIsSynchronized()
  {
//--- If the connection to the server is established, check the data synchronization
   if(TerminalInfoInteger(TERMINAL_CONNECTED))
     {
      for(int s=0; s<SYMBOLS_COUNT; s++)
        {
         //--- If the symbol is available
         if(symbol_names[s]!=empty_symbol)
           {
            //--- If the data are not synchronized, print the relevant message and try again
            if(!SeriesInfoInteger(symbol_names[s],Period(),SERIES_SYNCHRONIZED))
              {
               msg_last=msg_not_synchronized;
               ShowCanvasMessage(msg_not_synchronized);
               return(false);
              }
           }
        }
     }
//---
   return(true);
  }
La función para la conversión del periodo de tiempo a una cadena se cogerá de los artículos anteriores de la serie "Guía práctica de MQL5":
//+------------------------------------------------------------------+
//| Converting time frame to a string                                |
//+------------------------------------------------------------------+
string TimeframeToString(ENUM_TIMEFRAMES timeframe)
  {
   string str="";
//--- If the value passed is incorrect, take the current chart time frame
   if(timeframe==WRONG_VALUE || timeframe== NULL)
      timeframe= Period();
   switch(timeframe)
     {
      case PERIOD_M1  : str="M1";  break;
      case PERIOD_M2  : str="M2";  break;
      case PERIOD_M3  : str="M3";  break;
      case PERIOD_M4  : str="M4";  break;
      case PERIOD_M5  : str="M5";  break;
      case PERIOD_M6  : str="M6";  break;
      case PERIOD_M10 : str="M10"; break;
      case PERIOD_M12 : str="M12"; break;
      case PERIOD_M15 : str="M15"; break;
      case PERIOD_M20 : str="M20"; break;
      case PERIOD_M30 : str="M30"; break;
      case PERIOD_H1  : str="H1";  break;
      case PERIOD_H2  : str="H2";  break;
      case PERIOD_H3  : str="H3";  break;
      case PERIOD_H4  : str="H4";  break;
      case PERIOD_H6  : str="H6";  break;
      case PERIOD_H8  : str="H8";  break;
      case PERIOD_H12 : str="H12"; break;
      case PERIOD_D1  : str="D1";  break;
      case PERIOD_W1  : str="W1";  break;
      case PERIOD_MN1 : str="MN1"; break;
     }
//---
   return(str);
  }
Y por último, debemos identificar y guardar la primera barra verdadera para cada símbolo marcándola en el gráfico con una línea vertical. Para hacer esto, escribamos una función DetermineFirstTrueBar() y una función auxiliar GetFirstTrueBarTime() que devuelve el tiempo de la primera barra verdadera.
//+-----------------------------------------------------------------------+
//| Determining the time of the first true bar for the purpose of drawing |
//+-----------------------------------------------------------------------+
bool DetermineFirstTrueBar()
  {
   for(int s=0; s<SYMBOLS_COUNT; s++)
     {
      datetime time[];           // Bar time array
      int      available_bars=0; // Number of bars
      //--- If this symbol is not available, move to the next one
      if(symbol_names[s]==empty_symbol)
         continue;
      //--- Get the total number of bars for the symbol
      available_bars=Bars(symbol_names[s],Period());
      //--- Copy the bar time array. If this action failed, try again.
      if(CopyTime(symbol_names[s],Period(),0,available_bars,time)<available_bars)
         return(false);
      //--- Get the time of the first true bar corresponding to the current time frame
      limit_time[s]=GetFirstTrueBarTime(time);
      //--- Place a vertical line on the true bar
      CreateVerticalLine(0,0,limit_time[s],prefix+symbol_names[s]+": begin time series",
                          2,STYLE_SOLID,line_colors[s],false,TimeToString(limit_time[s]),"\n");
     }
//---
   return(true);
  }
//+-----------------------------------------------------------------------+
//| Returning the time of the first true bar of the current time frame    |
//+-----------------------------------------------------------------------+
datetime GetFirstTrueBarTime(datetime &time[])
  {
   datetime true_period =NULL; // Time of the first true bar
   int      array_size  =0;    // Array size
//--- Get the array size
   array_size=ArraySize(time);
   ArraySetAsSeries(time,false);
//--- Check each bar one by one
   for(int i=1; i<array_size; i++)
     {
      //--- If the bar corresponds to the current time frame
      if(time[i]-time[i-1]==PeriodSeconds())
        {
         //--- Save it and terminate the loop
         true_period=time[i];
         break;
        }
     }
//--- Return the time of the first true bar
   return(true_period);
  }
El tiempo de la primera barra verdadera está marcado en el gráfico con una línea vertical mediante la función CreateVerticalLine():
//+------------------------------------------------------------------+
//| Creating a vertical line at the specified time point             |
//+------------------------------------------------------------------+
void CreateVerticalLine(long            chart_id,           // chart id
                        int             window_number,      // window number
                        datetime        time,               // time
                        string          object_name,        // object name
                        int             line_width,         // line width
                        ENUM_LINE_STYLE line_style,         // line style
                        color           line_color,         // line color
                        bool            selectable,         // cannot select the object if FALSE
                        string          description_text,   // text of the description
                        string          tooltip)            // no tooltip if "\n"
  {
//--- If the object has been created successfully
   if(ObjectCreate(chart_id,object_name,OBJ_VLINE,window_number,time,0))
     {
      //--- set its properties
      ObjectSetInteger(chart_id,object_name,OBJPROP_TIME,time);
      ObjectSetInteger(chart_id,object_name,OBJPROP_SELECTABLE,selectable);
      ObjectSetInteger(chart_id,object_name,OBJPROP_STYLE,line_style);
      ObjectSetInteger(chart_id,object_name,OBJPROP_WIDTH,line_width);
      ObjectSetInteger(chart_id,object_name,OBJPROP_COLOR,line_color);
      ObjectSetString(chart_id,object_name,OBJPROP_TEXT,description_text);
      ObjectSetString(chart_id,object_name,OBJPROP_TOOLTIP,tooltip);
     }
  }
Las funciones de revisión están listas. Como resultado, la parte del código de la función OnCalculate(), cuando la variable prev_calculated es igual a cero, será la siguiente:
//--- If this is the first calculation or if a deeper history has been loaded or gaps in the history have been filled
   if(prev_calculated==0)
     {
      //--- Zero out arrays for data preparation
      ZeroCalculatedArrays();
      //--- Zero out indicator buffers
      ZeroIndicatorBuffers();
      //--- Get subwindow properties
      GetSubwindowGeometry();
      //--- Add the canvas
      SetCanvas();
      //--- Load and generate the necessary/available amount of data
      LoadAndFormData();
      //--- If there is an invalid handle, try to get it again
      if(!GetIndicatorHandles())
         return(RESET);
      //--- Check the amount of data available for all symbols
      if(!CheckAvailableData())
         return(RESET);
      //--- Check if a deeper history has been loaded
      if(!CheckLoadedHistory())
         return(RESET);
      //--- Check synchronization by symbol/time frame at the current moment
      if(!CheckSymbolIsSynchronized())
         return(RESET);
      //--- For each symbol, determine the bar from which we should start drawing
      if(!DetermineFirstTrueBar())
         return(RESET);
      //--- If you reached this point, it means that OnCalculate() will return non-zero value and this needs to be saved
      OC_prev_calculated=rates_total;
     }
Ahora, cada vez que una determinada comprobación falla, el programa dará un paso atrás para hacer otro intento en el próximo tick o evento del temporizador. En el temporizador, debemos ejecutar también la comprobación para cargar un historial más profundo fuera de la función OnCalculate():
//+------------------------------------------------------------------+
//| Timer function                                                   |
//+------------------------------------------------------------------+
void OnTimer()
  {
//--- If a deeper history has been loaded
   if(!CheckLoadedHistory())
      OC_prev_calculated=0;
//--- If for some reason calculations have not been completed or
//    a deeper history has been loaded or
//    gaps in the history have been filled,
//    then make another attempt without waiting for the new tick
   if(OC_prev_calculated==0)
     {
      OnCalculate(OC_rates_total,OC_prev_calculated,
                  OC_time,OC_open,OC_high,OC_low,OC_close,
                  OC_tick_volume,OC_volume,OC_spread);
     }
  }
Ahora, sólo debemos escribir dos bucles principales para colocarlos en la función OnCalculate():
- El primer bucle preparará los datos basados en el principio de "conseguir el valor por todos los medios" para evitar huecos en las series de indicadores. La idea es sencilla: en caso de no obtener el valor se llevará a cabo un número determinado de intentos para conseguirlo. En este bucle, los valores del tiempo de los símbolos y el indicador de volatilidad (ATR) se guardarán en matrices independientes.
- En el segundo bucle principal, al llenar los buffers del indicador, se requerirán las matrices de tiempo de otros símbolos para compararlas con el tiempo del símbolo actual y la sincronización de todas las series del trazado.
Se proporciona a continuación el código del primer bucle:
//--- Prepare data for drawing
   for(int s=0; s<SYMBOLS_COUNT; s++)
     {
      //--- If the symbol is available
      if(symbol_names[s]!=empty_symbol)
        {
         double percent=0.0; // For the purpose of calculating the progress percentage
         msg_last=msg_sync_update="Preparing data ("+IntegerToString(rates_total)+" bars) : "+
                      symbol_names[s]+"("+(string)(s+1)+"/"+(string)(SYMBOLS_COUNT)+") - 00% ... ";
         //--- Print the message
         ShowCanvasMessage(msg_sync_update);
         //--- Control every value of the array
         for(int i=limit; i<rates_total; i++)
           {
            PrepareData(i,s,time);
            //--- Refresh the message once every 1000 bars
            if(i%1000==0)
              {
               //--- Progress percentage
               ProgressPercentage(i,s,percent);
               //--- Print the message
               ShowCanvasMessage(msg_sync_update);
              }
            //--- Check the subwindow size once every 2000 bars
            //    and if the size has changed, adjust the canvas size to it
            if(i%2000==0)
               OnSubwindowChange();
           }
        }
     }
La función principal para copiar y guardar valores, PrepareData(), está resaltada en el código anterior. Hay también una nueva función que todavía no se ha tenido en cuenta; ProgressPercentage(). Calcula el porcentaje de progreso del funcionamiento actual para permitir que el usuario sepa cuánto tiempo durará.
El código de la función PrepareData() es el siguiente:
//+------------------------------------------------------------------+
//| Preparing data before drawing                                    |
//+------------------------------------------------------------------+
void PrepareData(int bar_index,int symbol_number,datetime const &time[])
  {
   int attempts=100; // Number of copying attempts
//--- Time of the bar of the specified symbol and time frame
   datetime symbol_time[];
//--- Array for copying indicator values
   double atr_values[];
//--- If within the area of the current time frame bars
   if(time[bar_index]>=limit_time[symbol_number])
     {
      //--- Copy the time
      for(int i=0; i<attempts; i++)
        {
         if(CopyTime(symbol_names[symbol_number],0,time[bar_index],1,symbol_time)==1)
           {
            tmp_symbol_time[symbol_number].time[bar_index]=symbol_time[0];
            break;
           }
        }
      //--- Copy the indicator value
      for(int i=0; i<attempts; i++)
        {
         if(CopyBuffer(symbol_handles[symbol_number],0,time[bar_index],1,atr_values)==1)
           {
            tmp_atr_values[symbol_number].value[bar_index]=atr_values[0];
            break;
           }
        }
     }
//--- If outside the area of the current time frame bars, set an empty value
   else
      tmp_atr_values[symbol_number].value[bar_index]=EMPTY_VALUE;
  }
Este es el código de la función ProgressPercentage():
//+------------------------------------------------------------------+
//| Calculating progress percentage                                  |
//+------------------------------------------------------------------+
void ProgressPercentage(int bar_index,int symbol_number,double &percent)
  {
   string message_text="";
   percent=(double(bar_index)/OC_rates_total)*100;
//---
   if(percent<=9.99)
      message_text="0"+DoubleToString(percent,0);
   else if(percent<99)
      message_text=DoubleToString(percent,0);
   else
      message_text="100";
//---
   msg_last=msg_sync_update="Preparing data ("+(string)OC_rates_total+" bars) : "+
            symbol_names[symbol_number]+
            "("+(string)(symbol_number+1)+"/"+(string)SYMBOLS_COUNT+") - "+message_text+"% ... ";
  }
Los buffers del indicador se llenan en el segundo bucle principal de la funciónOnCalculate():
//--- Fill indicator buffers
   for(int s=0; s<SYMBOLS_COUNT; s++)
     {
      //--- If the specified symbol does not exist, zero out the buffer
      if(symbol_names[s]==empty_symbol)
         ArrayInitialize(atr_buffers[s].data,EMPTY_VALUE);
      else
        {
         //--- Generate a message
         msg_last=msg_sync_update="Updating indicator data: "+
                      symbol_names[s]+"("+(string)(s+1)+"/"+(string)SYMBOLS_COUNT+") ... ";
         //--- Print the message
         ShowCanvasMessage(msg_sync_update);
         //--- Fill indicator buffers with values
         for(int i=limit; i<rates_total; i++)
           {
            FillIndicatorBuffers(i,s,time);
            //--- Check the subwindow size once every 2000 bars
            //    and if the size has changed, adjust the canvas size to it
            if(i%2000==0)
               OnSubwindowChange();
           }
        }
     }
La cadena resaltada del código anterior contiene la función FillIndicatorBuffers(). Esto es donde se llevan a cabo las operaciones finales antes de mostrar el trazado del indicador en el gráfico:
//+------------------------------------------------------------------+
//| Filling indicator buffers                                        |
//+------------------------------------------------------------------+
void FillIndicatorBuffers(int bar_index,int symbol_number,datetime const &time[])
  {
//--- For the purpose of checking the obtained indicator value
   bool check_value=false;
//--- Counter of the current time frame bars
   static int bars_count=0;
//--- Zero out the counter of the current time frame bars at the beginning of the symbol's time series
   if(bar_index==0)
      bars_count=0;
//--- If within the area of current time frame bars and the counter is smaller
//    than the specified indicator period, increase the counter
   if(bars_count<IndicatorPeriod && time[bar_index]>=limit_time[symbol_number])
      bars_count++;
//--- If within the indicator area and the time of the current symbol coincides with the time of the specified symbol
   if(bars_count>=IndicatorPeriod &&
      time[bar_index]==tmp_symbol_time[symbol_number].time[bar_index])
     {
      //--- If the value obtained is not empty
      if(tmp_atr_values[symbol_number].value[bar_index]!=EMPTY_VALUE)
        {
         check_value=true;
         atr_buffers[symbol_number].data[bar_index]=tmp_atr_values[symbol_number].value[bar_index];
        }
     }
//--- Set an empty value in case of failure to set a higher value
   if(!check_value)
      atr_buffers[symbol_number].data[bar_index]=EMPTY_VALUE;
  }
Al final de la función OnCalculate(), tenemos que borrar el lienzo, ajustar los niveles, poner a cero las variables de los mensajes y actualizar el gráfico. Por último, se devolverá el tamaño de la matriz rates_total, después del cual sólo se recalculará el último valor en cada tick o evento del temporizador en OnCalculate().
Estas son las cadenas de código que hay que insertar entre el segundo bucle principal y el valor devuelto por la función:
//--- Delete the canvas
   DeleteCanvas();
//--- Set indicator levels
   SetIndicatorLevels();
//--- Zero out variables
   msg_last="";
   msg_sync_update="";
//--- Refresh the chart
   ChartRedraw();
El código de la función SetIndicatorLevels() para ajustar los niveles horizontales es el siguiente:
//+------------------------------------------------------------------------+
//| Setting indicator levels                                               |
//+------------------------------------------------------------------------+
void SetIndicatorLevels()
  {
//--- Get the indicator subwindow number
   subwindow_number=ChartWindowFind(0,subwindow_shortname);
//--- Set levels
   for(int i=0; i<LEVELS_COUNT; i++)
      CreateHorizontalLine(0,subwindow_number,
                            prefix+"level_0"+(string)(i+1)+"",
                            CorrectValueBySymbolDigits(indicator_levels[i]*_Point),
                            1,STYLE_DOT,clrLightSteelBlue,false,false,false,"\n");
  }
//+------------------------------------------------------------------------+
//| Adjusting the value based on the number of digits in the price (double)|
//+------------------------------------------------------------------------+
double CorrectValueBySymbolDigits(double value)
  {
   return(_Digits==3 || _Digits==5) ? value*=10 : value;
  }
El código de la función CreateHorizontalLine() para ajustar un nivel horizontal con las propiedades especificadas es el siguiente:
//+------------------------------------------------------------------+
//| Creating a horizontal line at the price level specified          |
//+------------------------------------------------------------------+
void CreateHorizontalLine(long            chart_id,      // chart id
                          int             window_number, // window number
                          string          object_name,   // object name
                          double          price,         // price level
                          int             line_width,    // line width
                          ENUM_LINE_STYLE line_style,    // line style
                          color           line_color,    // line color
                          bool            selectable,    // cannot select the object if FALSE
                          bool            selected,      // line is selected
                          bool            back,          // background position
                          string          tooltip)       // no tooltip if "\n"
  {
//--- If the object has been created successfully
   if(ObjectCreate(chart_id,object_name,OBJ_HLINE,window_number,0,price))
     {
      //--- set its properties
      ObjectSetInteger(chart_id,object_name,OBJPROP_SELECTABLE,selectable);
      ObjectSetInteger(chart_id,object_name,OBJPROP_SELECTED,selected);
      ObjectSetInteger(chart_id,object_name,OBJPROP_BACK,back);
      ObjectSetInteger(chart_id,object_name,OBJPROP_STYLE,line_style);
      ObjectSetInteger(chart_id,object_name,OBJPROP_WIDTH,line_width);
      ObjectSetInteger(chart_id,object_name,OBJPROP_COLOR,line_color);
      ObjectSetString(chart_id,object_name,OBJPROP_TOOLTIP,tooltip);
     }
  }
Funciones para borrar objetos gráficos:
//+------------------------------------------------------------------+
//| Deleting levels                                                  |
//+------------------------------------------------------------------+
void DeleteLevels()
  {
   for(int i=0; i<LEVELS_COUNT; i++)
      DeleteObjectByName(prefix+"level_0"+(string)(i+1)+"");
  }
//+------------------------------------------------------------------+
//| Deleting vertical lines of the beginning of the series           |
//+------------------------------------------------------------------+
void DeleteVerticalLines()
  {
   for(int s=0; s<SYMBOLS_COUNT; s++)
      DeleteObjectByName(prefix+symbol_names[s]+": begin time series");
  }
//+------------------------------------------------------------------+
//| Deleting the object by name                                      |
//+------------------------------------------------------------------+
void DeleteObjectByName(string object_name)
  {
//--- If such object exists
   if(ObjectFind(0,object_name)>=0)
     {
      //--- If an error occurred when deleting, print the relevant message
      if(!ObjectDelete(0,object_name))
         Print("Error ("+IntegerToString(GetLastError())+") when deleting the object!");
     }
  }
Hay que añadir el siguiente código a la función OnDeinit():
Ahora todo está listo y se puede probar completamente. El número máximo de barras en la ventana se puede ajustar en la pestaña Gráficos de la configuración del terminal. La velocidad el indicador a la cual estará listo para funcionar está condicionada al número de barras en la ventana.

Fig. 1. Configuración del número máximo de barras en la configuración del terminal
Al cargar el indicador en el gráfico, puede ver el progreso de la preparación de los datos para todos los símbolos:

Fig. 2. El mensaje en el lienzo durante la preparación de los datos
A continuación, puede ver una captura de pantalla mostrando el indicador con un período de tiempo de 20 minutos:

Fig. 3. Indicador multisímbolo ATR en un periodo de tiempo de 20 minutos
El principio de barras "verdaderas" se marca en el gráfico con las líneas verticales. La siguiente captura de pantalla muestra que las barras verdaderas para NZDUSD (línea amarilla) empiezan desde el 2000 (servidor MetaQuotes-Demo), mientras que todos los otros pares de monedas de barras verdaderas aparecen desde principios de 1999, que es por lo que sólo se muestra una línea (todas están en la misma fecha). También podemos observar que los separadores del período tienen un intervalo más pequeño antes de 1999 y si analiza el tiempo de las barras, podrá ver que éstas son barras diarias.
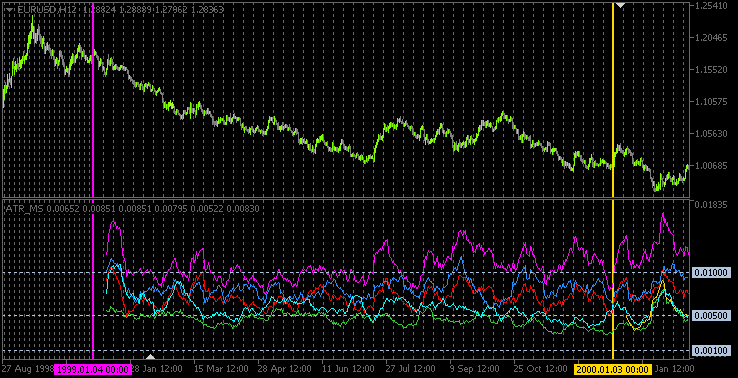
Fig. 4. Las líneas verticales marcan el principio de las barras verdaderas para cada símbolo
Conclusión
Ya se puede dar por finalizado el artículo. El código fuente está adjunto al artículo para su descarga. En alguno de los siguientes artículos, trataremos de aplicar un sistema de trading que pueda analizar la volatilidad y ver lo que surge de la misma.