Kit del trader: Indicadores para el diseño
TheXpert | 10 mayo, 2016
Introducción
¿Qué es un indicador? Es una herramienta que sirve para visualizar un determinado tipo de informaciones. Son a menudo informaciones sobre una serie de propiedades del precio y es justamente el tipo de indicadores que vamos a ver más adelante.
Cada indicador tiene sus propias propiedades y características: por ejemplo, el rango de valores, zonas de sobrecompra y sobreventa, intersección de líneas, máximos y mínimos, etc. Son muchas y se pueden utilizar perfectamente con los valores del indicador principal. Sin embargo, estas propiedades no se ven siempre claramente. Esto puede tener varias causas: la ventana del indicador es pequeña, el contraste es bajo, etc.
El objetivo de este artículo es ayudarle a mejorar el aspecto y el contenido de la información de los indicadores, así como la automatización parcial y la simplificación del proceso de implementación del código. Espero que tanto los programadores experimentados como los principiantes puedan utilizar el siguiente código con facilidad.
Este artículo está dirigido a aquellos que tengan un mínimo de conocimientos en MQL4 y que sepan implementar conceptos y algoritmos sencillos en un código, además de conocer la estructura de almacenamiento del código en el terminal y poder utilizar las librerías (experts/libraries) y los archivos de cabecera (experts/include).
1. Establecer una tarea
Entre las características de todos los indicadores, quiero destacar las más informativas y las que se usan más a menudo:
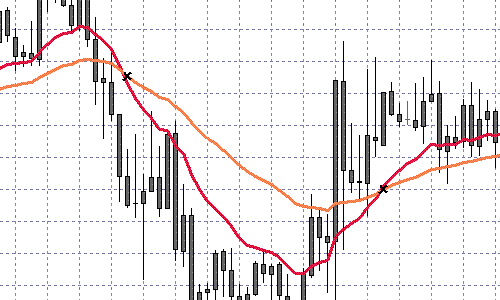
- Intersección de líneas.
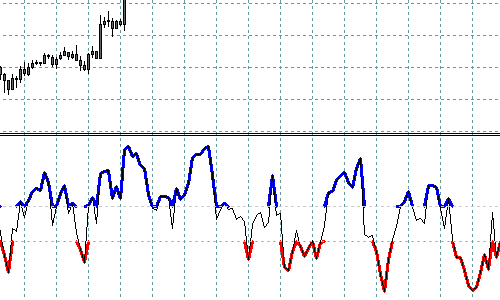
Nivel; no se marcarán sólo los puntos de intersección con el nivel, sino el nivel entero.
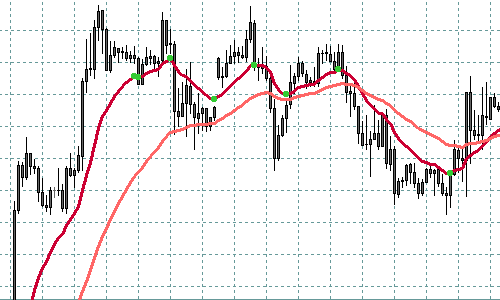
Interpretación sencilla de los máximos y mínimos.
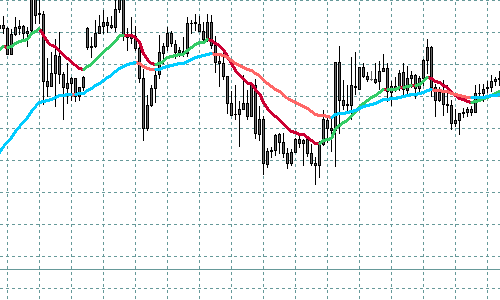
Colores distintos para las direcciones hacia arriba y hacia abajo.
Vamos a comentarlas.
2. Nociones básicas
Con el fin de evitar posibles malentendidos, vamos a dedicar un poco de tiempo a analizar la estructura del indicador.
#property indicator_separate_window

// number of visible buffers of the indicator
#property indicator_buffers 3

// setting the range of indicator values
#property indicator_minimum 0
#property indicator_maximum 100

// setting indicator colors
#property indicator_color1  White
#property indicator_color2  Red
#property indicator_color3  Blue

// external settings
extern int RSIPeriod       = 9;
extern int AppliedPrice    = 0;
extern int MAPeriod        = 5;

// declaring indicator buffers. Here they can be declared in any order.
// Any names can be given to buffers, though better meaningful

double Values[];           // Values
double SmoothedValues[];   // Smoothed values
double Crosses[];          // intersections

// Significant number of digits after a decimal point in indicator values
int DigitsUsed = 5;

// Used empty value. In MQL4 there are two empty values -- EMPTY (-1)
// -- used as an empty parameter when calling functions
// EMPTY_VALUE (0x7FFFFFFF) -- used as an unacceptable value
// (or default value) of a variable in indicators and function calls.
// The fact is, most built-in indicators return 0 if there is no value
// Besides, in custom (iCustom) indicators the empty value can be
// set as any, this must be noted.
int EmptyValueUsed = 0;

// Initialization function.
int init()
{
   // Number of used buffers can be larger than that of displayed ones; some
   // may contain intermediate calculations and additional information. The total
   // number of buffers including additional ones is displayed here.
   // If there are no additional buffers,
   // this line is not needed. Total number must not exceed 8
   // IndicatorBuffers(3);

   // associate buffers. Indexes must go from 0 till the declared number (not including)
   // buffers are drawn in the order of index growing, this is important and can be
   // used when righting indicators further.
   // It means that a buffer with a larger index is drawn above the buffer with lower one
   SetIndexBuffer(0, Values);
   SetIndexBuffer(1, SmoothedValues);
   SetIndexBuffer(2, Crosses);
   // besides, it is important that additional buffers are located after displayed ones
   // (i.e. they must have higher index) otherwise problems may occur displaying buffers,
   // and sometimes the error can be hardly found

   // This function sets an empty value for the buffer with the preset index
   // I do not recommend to use this function in order to avoid possible difficulties
   // Default empty value for buffers -- EMPTY_VALUE.
   // Empty buffer values are not drawn in a chart (except for DRAW_ZIGZAG)

   // SetIndexEmptyValue(0, EMPTY_VALUE);

   // Set parameters for buffers
   SetIndexStyle(0, DRAW_LINE);     // The main signal is a solid line
   SetIndexStyle(1, DRAW_LINE, STYLE_DASH); // Smoothed -- dotted line
   SetIndexStyle(2, DRAW_ARROW, STYLE_SOLID, 2); // Intersections -- crosses of the size 2

   SetIndexArrow(2, 251); // cross code in Wingdings

   IndicatorDigits(DigitsUsed); // set number of significant digits after point

   // Setting the starting plotting point for each indicator. If in terms of the current index
   // the history depth
   // is lower than the value written here, the buffer value with this index will not be drawn.
   SetIndexDrawBegin(0, RSIPeriod);
   SetIndexDrawBegin(1, RSIPeriod + MAPeriod);
   SetIndexDrawBegin(2, RSIPeriod + MAPeriod + 1);

   return(0);
}

int start()
{
   // counting number of bars for re-calculation
   int toCount = Bars - IndicatorCounted();

   // Calculating values
   // counting from history start till the current moment
   for (int i = toCount - 1; i >=0; i--)
   {
      // I understood its convenience only when I started to use it
      // I recommend to conduct the normalization of data at once,
      // so that later comparison could be easily made
      Values[i] = NormalizeDouble(iRSI(Symbol(), 0, RSIPeriod, AppliedPrice, i), DigitsUsed);
   }

   // Counting smoothed values
   for (i = toCount - 1; i >=0; i--)
   {
      SmoothedValues[i] = NormalizeDouble(iMAOnArray(Values, 0, MAPeriod, 0, MODE_EMA, i), DigitsUsed);
   }

   // ...

   return(0);
}
3. Características
Veamos estas características en detalle.
3.1. Intersección de líneas
Es posible que todos los desarrolladores hayan intentado implementar un algoritmo de trading mediante la intersección de dos MA (promedios móviles) o la intersección de la línea de base y la línea de la señal del mismo MACD. Vamos a tratar de visualizarlo y ponerlo en evidencia mostrando el punto de intersección en el indicador.
A modo de ejemplo, vamos a utilizar el RSI (índice de fuerza relativa) a lo largo del artículo, así que nuestro objetivo es desarrollar un RSI mejorado con algunas nuevas ventajas.
3.1.1 Realización de la tarea
Hay que marcar las barras que cruzan la línea en otro buffer.
3.1.2 Problemas
Parece que todo es sencillo y claro. La tarea no es muy difícil y se puede resolver con un par de líneas.
Tenemos que describir una intersección de líneas como esta:
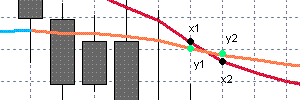
if ((x1 > y1 && x2 < y2) || (x1 < y1 && x2 > y2))
{
    // line crossing here
}
O podemos simplificarlo:
if ((x1 - y1)*(x2 - y2) < 0)
{
    // line crossing here
}
Pero veamos el siguiente caso:
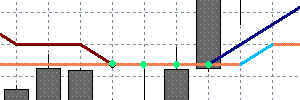
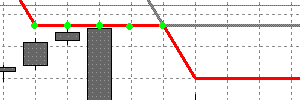
Los puntos verdes tienen el mismo valor. En este caso, las líneas no se cruzan, sólo se tocan.
Pero aquí:
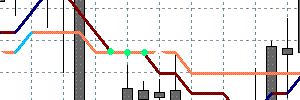
No es tan sencillo determinar la intersección, este caso es muy posible.
También hay que distinguir correctamente un toque de una intersección, teniendo en cuenta que al hacer la búsqueda, podemos encontrar un valor nulo en el buffer o el historial.
3.1.3 Solución
De aquí en adelante, ya no se tendrá en cuenta la función init(), al no ser necesaria. El código completo está adjunto al archivo.
Esta es la solución para los valores sencillos y suavizados el indicador RSI.
//|                                 RSI_Crosses_Sample.mq4 |

extern int RSIPeriod       = 9;
extern int AppliedPrice    = 0;
extern int MAPeriod        = 5;

// buffers
double Values[];           // Values
double SmoothedValues[];   // Smoothed values
double Crosses[];          // Crosses

int DigitsUsed = 5;
int EmptyValueUsed = 0;

int start()
{
   int toCount = Bars - IndicatorCounted();

   // Reading the values and normalizing them
   // Mark the crosses
   for (i = toCount - 1; i >=0; i--)
   {
      // i+1 must be greater or equal bars count in the history
      if (i + 1 >= Bars)
      {
         continue;
      }

      // if some of the values are empty, it is not necessary to check
      if (
            Values[i]               == EmptyValueUsed ||
            Values[i + 1]           == EmptyValueUsed ||
            SmoothedValues[i]       == EmptyValueUsed ||
            SmoothedValues[i + 1]   == EmptyValueUsed ||
            Values[i]               == EMPTY_VALUE    ||
            Values[i + 1]           == EMPTY_VALUE    ||
            SmoothedValues[i]       == EMPTY_VALUE    ||
            SmoothedValues[i + 1]   == EMPTY_VALUE
      )
      {
         continue;
      }

      // clear the current value
      Crosses[i] = EMPTY_VALUE;

      // crossing check (simple case)
      if ((Values[i] - SmoothedValues[i])*(Values[i + 1] - SmoothedValues[i + 1]) < 0)
      {
         Crosses[i] = SmoothedValues[i];
         continue;
      }

      // the crossing condition for a complicated case -
      // when crossing contain several bars with the same values
      //
      if (Values[i + 1] == SmoothedValues[i + 1] && Values[i] != SmoothedValues[i])
      {
         // there is potential crossing - checking it
         // lets find the second end

         int index = i + 1;
         bool found = false;
         while (
               index < Bars &&    // out of range
               Values[index] != EmptyValueUsed &&   // check for empty
               Values[index] != EMPTY_VALUE &&      // check for empty
               SmoothedValues[index] != EmptyValueUsed &&  // check for empty
               SmoothedValues[index] != EMPTY_VALUE)       // check for empty
         {
            if (Values[index] != SmoothedValues[index])
            {
               // ok, we have found the second end
               found = true;
               break;
            }

            index++;
         }

         if (!found)
         {
            // the case of the end of history or empty value
            // anyway, we mean that there is no crossing
            continue;
         }

         // checking the ends for crossing
         if ((Values[i] - SmoothedValues[i])*(Values[index] - SmoothedValues[index]) < 0)
         {
            // crossing found
            Crosses[i] = SmoothedValues[i];
         }  // else we have a touching - do not mark it

      }
   }

   return(0);
}
3.1.4 Automatización
Vamos tratar de solucionar el problema en esta parte mediante la librería Indicator_Painting.
//|                                 RSI_Crosses_Lib_Sample.mq4 |

#include <Indicator_Painting.mqh>

extern int RSIPeriod       = 9;
extern int AppliedPrice    = 0;
extern int MAPeriod        = 5;

// buffers
double Values[];           // Values
double SmoothedValues[];   // Smoothed values
double Crosses[];          // Crosses

int DigitsUsed = 5;
int EmptyValueUsed = 0;

int start()
{
   // Reading values
   // ...

   // Mark crosses
   MarkCrosses
   (
      Values,            // the fast buffer with values to check
      SmoothedValues,    // the slow buffer with values to check
      Crosses,           // the crosses buffer
      toCount - 1,       // start check index
      0,                 // final check index
      CROSS_ALL,         // use CROSS_UP for up crosses CROSS_DOWN for down crosses CROSS_ALL for all
      0);                // used empty value

   return(0);
}
3.2. Nivel de referencia
Algunos de los osciladores con un conjunto de valores muy limitado y bien definido (RSI, Stochastic Oscillator, DeMarker, Money Flow Index, Williams' Percent Range) requieren a menudo marcar zonas o niveles. Por ejemplo, las zonas planas, las zonas de sobrecompra o sobreventa, las zonas de tendencia... Vamos a tratar de perfilar el nivel establecido mediante un color distinto.
3.2.1 Realización de la tarea
Hay que marcar las barras con valores fuera de los niveles establecidos en otro buffer.
3.2.2 Problemas
No es tan sencillo como parece a primera vista.
El primer problema es dibujar las barras en las que se cruza el nivel establecido. Esta es la solución:
//|                                 RSI_Cut_Levels_Sample.mq4 |

extern int RSIPeriod       = 9;
extern int AppliedPrice    = 0;

extern int HigherLevel     = 70;
extern int LowerLevel      = 30;

// buffers
double Higher[];           // Overbought
double Lower[];            // Oversold
double Values[];           // Values

int DigitsUsed = 5;
int EmptyValueUsed = 0;

int start()
{
   int toCount = Bars - IndicatorCounted();

   // Reading values
   // ...

   // Mark levels - upper
   for (i = toCount - 1; i >=0; i--)
   {
      // check for empty values
      if (Values[i] == EMPTY_VALUE || Values[i] == EmptyValueUsed)
      {
         continue;
      }

      // empty current value
      Higher[i] = EMPTY_VALUE;

      // greater than high
      if (Values[i] >= HigherLevel)
      {
         Higher[i] = Values[i];
      }
   }

   // for the levels mark - the code is same
   // ...

   return(0);
}
Este código soluciona el problema, pero tiene un inconveniente:
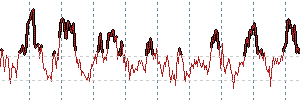
Es muy difícil hacer un análisis visual puesto que el dibujo de la señal empieza a partir del valor superior (o inferior) al nivel. Por lo tanto, no se pueden analizar algunas barras de la señal a causa de algunas peculiaridades del dibujo debidas a los cambios bruscos de las barras colindantes.
La solución consiste en marcar no sólo las barras superiores (inferiores) al nivel establecido, sino también las barras anteriores y posteriores a la barra marcada. Además, no hay que marcarlas con sus propios valores, sino con los valores del nivel.
Surge un segundo problema al solucionar el primero; como consecuencia de la complejidad del algoritmo, el buffer tiene pseudo marcas de las "falsas" disminuciones del nivel.
Es decir que el precio estaba fuera del nivel durante la formación de las barras, sin embargo, el valor de la barra final está dentro del nivel. Debido a esto, podemos obtener una figura como esta:
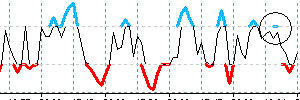
El problema surge únicamente si usamos un indicador en las cotizaciones en tiempo real. La solución es sencilla; se comprueban dos barras (0 y 1) durante el proceso, y sólo se comprueba el resto si es necesario.
Después de esto, tendremos la siguiente figura para el RSI:
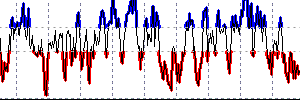
3.2.3 Solución
Así que vamos a escribirlo todo en un código:
//|                                 RSI_Levels_Sample.mq4 |

extern int RSIPeriod       = 9;
extern int AppliedPrice    = 0;

extern int HigherLevel     = 70;
extern int LowerLevel      = 30;

// buffers
double Higher[];           // Overbought
double Lower[];            // Oversold
double Values[];           // Values

int DigitsUsed = 5;
int EmptyValueUsed = 0;

// looking at least two bars - 0 and 1.
int Depth = 2;

int start()
{
   int toCount = Bars - IndicatorCounted();

   // Reading values
   // ...

   toCount = MathMax(toCount, Depth);

   // Marking levels - upper
   for (i = toCount - 1; i >=0; i--)
   {
      if (Values[i] == EMPTY_VALUE || Values[i] == EmptyValueUsed) continue;

      Higher[i] = EMPTY_VALUE;

      // greater than level
      if (Values[i] >= HigherLevel)
      {
         Higher[i] = Values[i];

         // if previous is lower
         if (Values[i + 1] < HigherLevel && Values[i + 1] != EmptyValueUsed)
         {
         // mark it also but with the level value
            Higher[i + 1] = HigherLevel;
         }
      }
      // if current lower
      else
      {
         // if previous is greater
         if (Values[i + 1] >= HigherLevel && Values[i + 1] != EMPTY_VALUE)
         {
            // mark it also but with the level value
            Higher[i] = HigherLevel;
         }
      }
   }

   // Mark levels - the code is the same
   // ...

   return(0);
}
3.2.4 Automatización
La solución del mismo problema mediante la librería Indicator_Painting.
//|                                 RSI_Levels_Lib_Sample.mq4 |

#include <Indicator_Painting.mqh>

extern int RSIPeriod       = 9;
extern int AppliedPrice    = 0;

extern int HigherLevel     = 70;
extern int LowerLevel      = 30;

// buffers
double Higher[];           // Overbought
double Lower[];            // Oversold
double Values[];           // Values

int DigitsUsed = 5;
int EmptyValueUsed = 0;
int Depth = 2;

int start()
{
   int toCount = Bars - IndicatorCounted();

   // Read values
   for (int i = toCount - 1; i >= 0; i--)
   {
      Values[i] = NormalizeDouble(iRSI(Symbol(), 0, RSIPeriod, AppliedPrice, i), DigitsUsed);
   }

   // Mark levels - upper
   MarkLevel(Values, Higher, 0, toCount - 1, HigherLevel, GREATER_THAN, EmptyValueUsed);
   // Mark levels - lower
   MarkLevel(Values, Lower, 0, toCount - 1, LowerLevel, LESS_THAN, EmptyValueUsed);

   return(0);
}
3.3. Máximos y mínimos
Se pueden utilizar los extremos del indicador como señales. En este artículo, se entiende el término "extremo" en su forma más simple; si el valor de la barra es superior (inferior) a los valores de las barras colindantes, se considera un extremo.
3.3.1 Realización de la tarea
Hay que marcar las barras con valores extremos en otro buffer.
3.3.2 Problemas
Vamos a considerar algunos ejemplos:
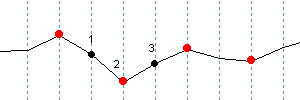
Se marcan los valores obvios de los extremos con líneas de color rojo:
if ((x1 > x2 && x3 > x2) || (x1 < x2 && x3 < x2))
{
    // x2 is extremal
}
O podemos simplificarlo:
if ((x1 - x2)*(x2 - x3) < 0)
{
    // x2 is extremal
}
Pero veamos este caso:
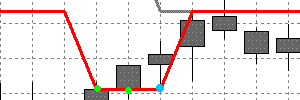
Los puntos marcados tienen el mismo valor. El punto azul es un extremo. Va a resultar difícil determinarlo. Y en el siguiente caso:
no hay ningún extremo, suponemos que se trata de una inflexión.
Al igual que en los casos de la intersección, la solución consiste en encontrar un segundo valor extremo.
3.3.3 Solución
Este es el código:
//|                                 RSI_Extremums_Sample.mq4 |

extern int RSIPeriod       = 9;
extern int AppliedPrice    = 0;

// buffers
double Values[];           // Values
double Extremums[];        // Extremums

int DigitsUsed = 5;
int EmptyValueUsed = 0;

int start()
{
   int toCount = Bars - IndicatorCounted();
   for (int i = toCount - 1; i >=0; i--)
   {
      Values[i] = NormalizeDouble(iRSI(Symbol(), 0, RSIPeriod, AppliedPrice, i), DigitsUsed);
   }

   for (i = toCount - 1; i >=0; i--)
   {
      // check the values relative to the current index.
      if (i + 2 >= Bars)
      {
         continue;
      }

      // check for empty values, if there are, it is not necessary to check
      if (
            Values[i]      == EmptyValueUsed ||
            Values[i + 1]  == EmptyValueUsed ||
            Values[i + 2]  == EmptyValueUsed
      )
      {
         continue;
      }

      // fill the current value of the mark buffer
      Extremums[i + 1] = EMPTY_VALUE;

      // cross condition - the simple case
      if ((Values[i] - Values[i + 1])*(Values[i + 1] - Values[i + 2]) < 0)
      {
         // we have found the cross
         Extremums[i + 1] = Values[i + 1];
         continue;
      }

      // the cross condition in a complicated case -
      // when top contain several bars with the same value
      if (Values[i + 1] == Values[i + 2] && Values[i] != Values[i + 1])
      {
         // there is possible extremum - to check it
         // we have to find the second end

         int index = i + 2;
         bool found = false;
         while (index < Bars && Values[index] != EmptyValueUsed && Values[index] != EMPTY_VALUE)
         {
            if (Values[i + 2] != Values[index])
            {
               // ok, we have found the second end
               found = true;
               break;
            }

            index++;
         }

         if (!found)
         {
            // we are at the end of the history or have an empty value
            // for the both cases we assume that there is no extremum
            continue;
         }

         // checking the ends for a cross
         if ((Values[i] - Values[i + 1])*(Values[i + 1] - Values[index]) < 0)
         {
            // there is a cross
            Extremums[i + 1] = Values[i + 1];
         }  // else -- there is a bend point, do not mark it
      }
   }

   return(0);
}
3.3.4 Automatización
La solución al mismo problema mediante la librería Indicator_Painting.
//|                                 RSI_Extremums_Lib_Sample.mq4 |

#include <Indicator_Painting.mqh>

extern int RSIPeriod       = 9;
extern int AppliedPrice    = 0;

// buffers
double Values[];           // Values
double Extremums[];        // Extremal points

int DigitsUsed = 5;
int EmptyValueUsed = 0;

int start()
{
   int toCount = Bars - IndicatorCounted();

   for (int i = toCount - 1; i >=0; i--)
   {
      Values[i] = NormalizeDouble(iRSI(Symbol(), 0, RSIPeriod, AppliedPrice, i), DigitsUsed);
   }

   MarkExtremums(Values, Extremums, toCount - 1, 0, DIR_ALL, EmptyValueUsed);

   return(0);
}
3.4. Colorear en función de la dirección
Se usa este método de visualización en algunos indicadores comunes y puede resultar muy útil.
3.4.1 Realización de la tarea
Hay que dibujar algunos conjuntos de valores del indicador (por ejemplo, si se dirigen hacia arriba o hacia abajo) con distintos colores. Se entiende la dirección en su forma más sencilla; si el valor actual es superior al anterior, la dirección es ascendente, de lo contrario, es descendente.
3.4.2 Problemas
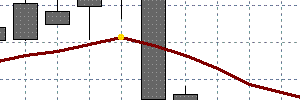
Vamos a empezar. Se supone que tenemos un buffer principal de datos y el buffer que vamos a dibujar. Si no es así, hay que hacerlo ya que necesitamos por lo menos dos colores y dos buffers para colorear las direcciones. Ahora el truco. Si dibujamos una de las direcciones sobre el buffer principal, no hará falta colorear la otra dirección; es la parte sin pintar del buffer principal.
El buffer principal:
Representación del buffer principal con su parte ascendente coloreada:
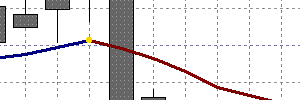
Por lo tanto, más adelante, sólo vamos a tener en cuenta el dibujo de una sola dirección, por ejemplo la ascendente. Vamos a ver los problemas que pueden surgir.
A continuación tenemos una implementación simple del código:
//|                                 RSI_Simple_Directions_Sample.mq4 |

extern int RSIPeriod       = 9;
extern int AppliedPrice    = 0;

// buffers
double Values[];           // Values
double Growing[];          // Growing buffer

int DigitsUsed = 5;
int EmptyValueUsed = 0;

int start()
{
   int toCount = Bars - IndicatorCounted();

   // Reading values
   for (int i = toCount - 1; i >=0; i--)
   {
      Values[i] = NormalizeDouble(iRSI(Symbol(), 0, RSIPeriod, AppliedPrice, i), DigitsUsed);
   }

   // Mark the growing levels - we will get the falling levels as a result
   for (i = toCount - 1; i >=0; i--)
   {

      // check for empty value, if there are, the further check is not necessary
      // ...

      // filling the current values with empty values
      Growing[i] = EMPTY_VALUE;

      // if growing
      if (Values[i] > Values[i + 1])
      {
         Growing[i] = Values[i];
         Growing[i + 1] = Values[i + 1];
      }
   }

   return(0);
}
Compilamos, añadimos al gráfico y... vemos los resultados de ejecución del código:
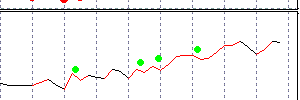
Hay algunos problemas, están marcados con puntos. Vamos a tratar de entender por qué ocurre esto. Mientras se colorea una sola dirección, se genera un efecto al dejar valores nulos (EMPTY_VALUE) en otras partes.
Veamos el siguiente caso:
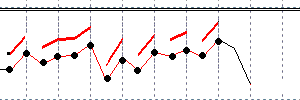
Los datos del buffer adicional que no debe tener valores nulos están marcados con puntos negros. Para evitar el dibujo de la línea recta entre los puntos (usando el estilo DRAW_LINE) hay que tener por lo menos un valor no nulo entre ellos. No hay valores nulos en todo el intervalo dibujado, es por ello que se dibuja el buffer principal en las áreas de "dientes de sierra".
La solución a este problema no es tan obvia; por ejemplo, el suavizado o el uso de condiciones adicionales complicarían el problema mucho más. Como resultado, se podrán redibujar varias barras o algo complejo.
La solución consiste en utilizar dos buffers adicionales. Así que es posible alternar las áreas pintadas; de este modo se obtienen los valores nulos necesarios en cada buffer.
Vamos a asignar distintos colores a los buffers adicionales y veamos el resultado:
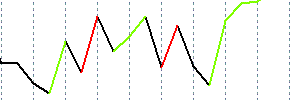
Se ha resuelto el problema principal, pero hay otro pequeño problema con la barra cero. Se redibuja cada vez, y en algunos casos hay que eliminar el dibujo de la dirección ascendente si cambia la dirección.
Veamos la implementación.
3.4.3 Solución
//|                                 RSI_Directions_Sample.mq4 |

extern int RSIPeriod       = 9;
extern int AppliedPrice    = 0;

// buffers
double Values[];           // Values
double Growing1[];         // First growing buffer
double Growing2[];         // Second growing buffer

int DigitsUsed = 5;
int EmptyValueUsed = 0;

int start()
{
   int toCount = Bars - IndicatorCounted();

   // Reading values
   for (int i = toCount - 1; i >=0; i--)
   {
      Values[i] = NormalizeDouble(iRSI(Symbol(), 0, RSIPeriod, AppliedPrice, i), DigitsUsed);
   }

   // Mark for the growing levels - we will get the falling levels as a resut
   for (i = toCount - 1; i >=0; i--)
   {
      // check of an empty values
      // ...

      // assume that the current values are empty
      Growing1[i] = EMPTY_VALUE;
      Growing2[i] = EMPTY_VALUE;

      // if it growing
      if (Values[i] > Values[i + 1])
      {
         // if it growing on the previous bar
         if (Values[i + 1] > Values[i + 2])
         {
            // writing to the current growing buffer
            if (Growing1[i + 1] != EMPTY_VALUE) Growing1[i] = Values[i];
            else                                Growing2[i] = Values[i];
         }
         // if the previous bar was not increasing
         else
         {
            // write to the buffer which it was not used the last 2 bars
            // we must have at least one such bar

            if (Growing2[i + 2] == EMPTY_VALUE)
            {
               Growing2[i] = Values[i];
               Growing2[i + 1] = Values[i + 1];
            }
            else
            {
               Growing1[i] = Values[i];
               Growing1[i + 1] = Values[i + 1];
            }
         }
      }
      // if the last value does not grow, remove it
      else if (i == 0)
      {
         if (Growing1[i + 1] != EMPTY_VALUE && Growing1[i + 2] == EMPTY_VALUE)
         {
            Growing1[i + 1] = EMPTY_VALUE;
         }

         if (Growing2[i + 1] != EMPTY_VALUE && Growing2[i + 2] == EMPTY_VALUE)
         {
            Growing2[i + 1] = EMPTY_VALUE;
         }
      }
   }

   return(0);
}
3.4.4 Automatización
La solución al mismo problema mediante la librería Indicator_Painting.
Hay una implementación similar para la dirección descendente en la librería.
//|                                 RSI_Directions_Lib_Sample.mq4 |

#include <Indicator_Painting.mqh>

extern int RSIPeriod       = 9;
extern int AppliedPrice    = 0;

// buffers
double Values[];           // Values
double Growing1[];         // First growing buffer
double Growing2[];         // Second growing buffer

int DigitsUsed = 5;
int EmptyValueUsed = 0;

int start()
{
   int toCount = Bars - IndicatorCounted();

   // Reading values
   for (int i = toCount - 1; i >=0; i--)
   {
      Values[i] = NormalizeDouble(iRSI(Symbol(), 0, RSIPeriod, AppliedPrice, i), DigitsUsed);
   }

   // Mark the growing levels - we will get the falling levels automatically
   MarkGrowing(Values, Growing1, Growing2, toCount - 1, 0, EmptyValueUsed);

   return(0);
}
4. La librería Indicator_Painting
La librería Indicator_Painting es el resultado de todo el trabajo realizado anteriormente.
Se ha diseñado específicamente para automatizar las operaciones mencionadas, con algunos añadidos.
Esta es la lista de las funciones disponibles:
// ====================================================
// Mark for tops and bottoms
// ====================================================
void MarkExtremums(
      double values[],        // Indicator values
      double& extremums[],    // Buffer for extremums
      int startIndex,         // Start index for check (it included)
      int endIndex,           // End index for check (it included)
      int direction,          // DIR_TOP for tops, DIR_BOTTOM for bottoms, DIR_ALL for tops an bottoms
      double emptyValueUsed); // The value used for "empty" mark


// ====================================================
// Mark for crosses
// ====================================================
void MarkCrosses(
      double values1[],       // Values of the first indicator
      double values2[],       // Values of the second indicator
      double& crosses[],      // Buffer for their crosses
      int startIndex,         // Start index for check (it included)
      int endIndex,           // End index for check (it included)
      int direction,          // CROSS_UP for up crosses,CROSS_DOWN for down crosses, CROSS_ALL for all crosses
      double emptyValueUsed); // The value used for "empty" mark


// ====================================================
// Mark for level crosses
// ====================================================
void MarkLevelCrosses(
      double values[],        // Values of the indicator
      double level,           // Level value for a cross check
      double& crosses[],      // Buffer for the crosses
      int startIndex,         // Start index for check (it included)
      int endIndex,           // End index for check (it included)
      int direction,          // CROSS_UP for up crosses,CROSS_DOWN for down crosses, CROSS_ALL for all crosses
      double emptyValueUsed); // The value used for "empty" mark


// ====================================================
// Mark for levels
// ====================================================
void MarkLevel(
      double values[],        // Values of the indicator
      double& level[],        // Buffer for the crosses
      int startIndex,         // Start index for check (it included)
      int endIndex,           // End index for check (it included)
      double levelValue,      // Level value
      int condition,          // Mark condition (LESS_THAN = -1, GREATER_THAN = 1)
      double emptyValueUsed); // The value used for "empty" mark

// ====================================================
// Mark for dynamic levels
// ====================================================
void MarkDynamicLevel(
      double values[],        // Values of the indicator
      double dynamicLevel[],  // Dynamical level values for check
      double& level[],        // Buffer for the crosses
      int startIndex,         // Start index for check (it included)
      int endIndex,           // End index for check (it included)
      int condition,          // меньше (LESS_THAN = -1) или больше уровня (GREATER_THAN = 1)
      double emptyValueUsed); // The value used for "empty" mark

// ====================================================
// Mark for direction (upward)
// ====================================================
void MarkGrowing(
      double values[],        // Values of the indicator
      double& growing1[],     // The first buffer to mark the direction
      double& growing2[],     // The second buffer to mark the direction
      int startIndex,         // Start index for check (it included)
      int endIndex,           // End index for check (it included)
      double emptyValueUsed); // The value used for "empty" mark

// ====================================================
// Mark for direction (downward)
// ====================================================
void MarkReducing(
      double values[],        // Values of the indicator
      double& reducing1[],    // The first buffer to mark the direction
      double& reducing2[],    // The second buffer to mark the direction
      int startIndex,         // Start index for check (it included)
      int endIndex,           // End index for check (it included)
      double emptyValueUsed); // The value used for "empty" mark
Estos son algunos ejemplos de uso de la librería:
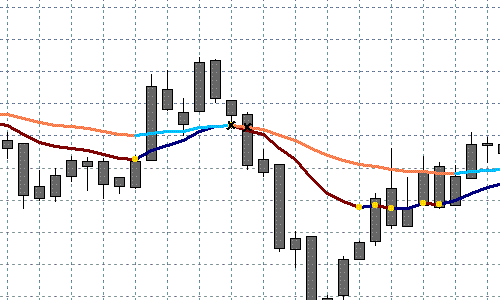
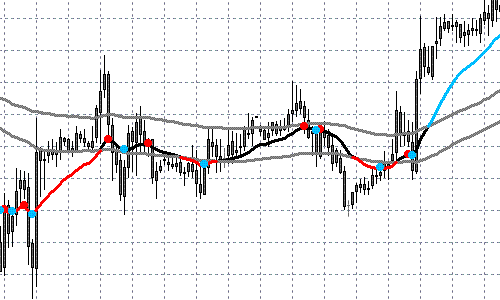
Hay que hacer lo siguiente para utilizar la librería:
1. Copiar el archivo "Indicator_Painting.mq4" en la carpeta "experts/libraries"
2. Copiar el archivo "Indicator_Painting.mqh" en la carpeta "experts/include"
3. Añadir la siguiente cadena al código del indicador:
#include <Indicator_Painting.mqh>
Ahora puede utilizar todas las funciones de la librería. Consulte el archivo "Indicator_Painting.mqh" para más detalles.
Puede encontrar los ejemplos en los archivos adjuntos al artículo.
Conclusión
Espero que este artículo pueda ayudar y facilitar el trabajo de muchas personas. Creo que se ha logrado el objetivo.
Agradecimientos
Quiero dar las gracias al Sr. Viktor Rustamov (granit77) por haber sugerido la tarea y por su ayuda y comentarios que sirvieron para mejorar el artículo.