Lenguaje MQL4 para principiantes. Indicadores personalizados (Segunda parte)
Antoniuk Oleg | 30 marzo, 2016
Introducción
Este es el quinto artículo de la serie "El lenguaje MQL4 para principiantes". Hoy vamos a aprender a utilizar los objetos gráficos; una poderosa herramienta de desarrollo que nos permite ampliar significativamente las posibilidades de uso de los indicadores. Además, se pueden utilizar en los scripts y en los Asesores Expertos. Vamos a aprender a crear objetos, cambiar sus parámetros y comprobar los errores. Obviamente, no puedo describir detalladamente todos los objetos, hay demasiados. Pero le proporcionaré todos los conocimientos necesarios para que pueda entenderlos por sí mismo. Este artículo contiene también un guía paso a paso para crear un indicador de señales compuestas. En base a ello, podrá crear cualquier indicador de señales que mostrará las señales de las operaciones en todos los periodos y con distintos indicadores al mismo tiempo. A su vez, se podrán ajustar muchos parámetros de la configuración, lo que permitiría cambiar fácilmente el aspecto del indicador.
¿Qué son los objetos gráficos?
Los encuentra a menudo cuando trabaja en el terminal de MetaTrader 4. Y se pueden utilizar con diversos propósitos. Los traders colocan los niveles de soporte y resistencia, los puntos de giro, los niveles de Fibonacci, etc. Veamos un sencillo ejemplo de uso de los objetos gráficos:
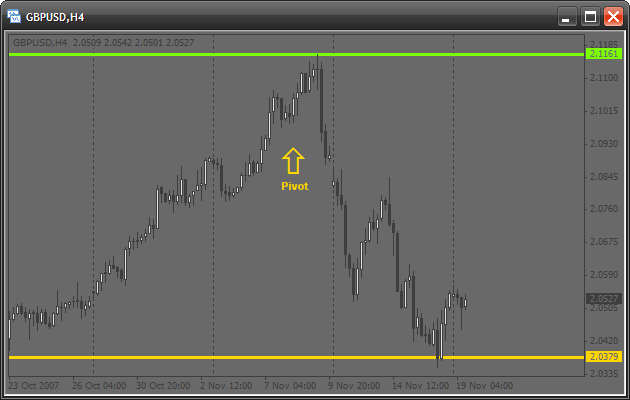
Hay cuatro objetos en este gráfico:
- 2 líneas horizontales
- un objeto de texto
- un objeto símbolo (una flecha)
Hoy vamos a aprender a añadir estos objetos mediante MQL4. ¡Imagínese cuántas operaciones manuales se pueden automatizar usando los objetos! Por ejemplo, ¿ha tenido alguna vez que calcular los puntos de giro, los niveles de soporte y resistencia y luego dibujarlos manualmente? Es verdad, no es mucho trabajo, pero si se automatiza este proceso en MQL4, el terminal se encargará de calcular y dibujar los niveles correspondientes por sí mismo. Sólo tiene que hacer un doble clic encima del nombre del script que lo hará todo. Además, se pueden implementar indicadores de señales muy útiles mediante los objetos gráficos.
El concepto de trabajar con objetos
Los pasos para trabajar con cualquier objeto gráfico en MQL4 son los siguientes:
- crear un objeto
- cambiar sus parámetros (movimiento, cambio de color, estilo, etc.)
- eliminar el objeto
Este es un "ciclo vital" concreto. Veamos ahora cada paso.
Crear un objeto gráfico
Se usa la función universal ObjectCreate() para dibujar cualquier objeto gráfico. Este es su prototipo:
bool ObjectCreate(string name, int type, int window, datetime time1,
                  double price1, datetime time2=0,double price2=0,
                  datetime time3=0, double price3=0)
La función devuelve true si todo es correcto y false si no se puede crear el objeto o se produce un error. Se puede utilizar la función GetLastError() para averiguar el código del error:
if(ObjectCreate(/* arguments */)==false)
{
   // an error occurred, its code should be recorded into a journal
   Print("Error of calling ObjectCreate():",GetLastError());
}
¿Para qué necesitamos el código de error? Nos ayudará a obtener la descripción del error y posiblemente eliminarlo. Todas las descripciones de los códigos están en el Manual de referencia de MQL4: MQL4 Reference -> Standard Constants -> Error Codes.
Vamos a ver todos los argumentos de la función ObjectCreate():
- name – el nombre único del objeto. No puede crear dos objetos con el mismo nombre. Se usará este nombre posteriormente para mover el objeto o cambiar sus parámetros de representación gráfica.
- type – el tipo de objeto. Todos los tipos de objetos que se puedan crear están en el Manual de referencia de MQL4: MQL4 Reference -> Standard Constants -> Object Types. Tenga en cuenta que dependiendo del tipo de objeto, se deberían utilizar o no los últimos argumentos de la función. Observe otra vez la estructura. Se asignan los valores de los 4 últimos argumentos por defecto: objetos distintos requieren una cantidad distinta de datos para su creación. Es sencillo. Supongamos que queremos dibujar un punto. ¿Qué información necesitamos? Obviamente, la posición del punto. Esto es suficiente, ¿verdad? Y para dibujar un rectángulo necesitamos 2 posiciones; los puntos de la esquina superior izquierda y la esquina inferior derecha. Lo mismo ocurre con la función ObjectCreate(). Esto es universal. Por lo tanto, le hace falta la posición de un punto para dibujar una línea horizontal y de dos puntos para dibujar un segmento de una línea. Para dibujar un triángulo, necesita tres puntos. Es por ello que al crear un objeto se recomienda examinar cuidadosamente la cantidad de puntos necesarios para su dibujo.
- window – el número de la ventana en la cual hay que dibujar el objeto. Si queremos dibujar el objeto en un gráfico, por ejemplo, usamos el 0 para elegir la ventana principal.
- time1 – la coordenada X del primer punto. El eje X del terminal muestra el tiempo, así que indica el valor del tiempo. Por ejemplo, para averiguar el tiempo de la última barra disponible podemos usar la matriz predefinida Time[], de esta manera: Time[0].
- price1 – la coordenada Y del primer punto. El eje Y en el terminal muestra el precio, así que se deben utilizar los valores del precio. Por ejemplo, podemos usar las matrices predefinidas Open[], Close[] etc.
-
Otros argumentos – son 2 pares con coordenadas similares que definen los puntos para dibujar objetos más complejos. Estos parámetros no hacen falta si el objeto es sencillo.
Ejemplo de creación de objetos. Trazado de las líneas
Para entender mejor, vamos a dibujar un par de líneas. Vamos a etiquetar el precio máximo y mínimo del último día. Para ello, primero tenemos que crear un script y modificar la función start():
int  start()
{
   double price=iHigh(Symbol(),PERIOD_D1,0);
   // this useful function returns the maximal price for:
   // * specified security, in our case it is Symbol() -
   //   active security
   // * specified period, in our case it is PERIOD_D1 (daily)
   // * specified bar, in our case it is 0, the last bar

   ObjectCreate("highLine",OBJ_HLINE,0,0,price);
   // let us view all parameters:
   // "highLine" - the unique object name
   // OBJ_HLINE - object type of the horizontal line
   // 0 - the object is drawn in the main window (chart window)
   // 0 - X coordinate (time), it shouldn't be indicated, because
   //     we are drawing a horizontal line
   // price - Y coordinate (price). It is the maximal price

   price=iLow(Symbol(),PERIOD_D1,0);
   // the function is identical with iHigh in arguments, but it returns
   // the minimal price

   ObjectCreate("lowLine",OBJ_HLINE,0,0,price);

   return(0);
}
Hemos omitido la comprobación de los errores. Así que si escribe dos objetos con el mismo nombre, es culpa suya. Al ejecutar el script, se debe ver algo como esto:
Se han dibujado las líneas, pero hay algo que no me gusta. Es el color rojo, es muy intenso, por lo que recomiendo usar los tonos. En general, se puede cambiar el aspecto de la línea.
Modificación de las propiedades del objeto. Configuración del aspecto de las líneas
Existe una función especial que permite configurar los parámetros del objeto gráfico creado. Es la función ObjectSet(). Este es su prototipo:
bool ObjectSet( string name, int index, double value);
Al igual que la función anterior, devuelve true si todo es correcto y false si hay algún problema. Por ejemplo, si se especifica el nombre de un objeto inexistente. Veamos los argumentos de esta función:
- name – el nombre del objeto creado. Antes de empezar con los cambios, hay que asegurarse de que el objeto con este nombre existe.
- index – índice de las propiedades del objeto que hay que modificar. Se pueden encontrar todos los índices en el Manual de referencia de MQL4: MQL4 Reference -> Standard Constants -> Object properties. Esta función también es universal. Funciona según el siguiente principio: indicamos qué propiedad hay que modificar y qué valor se le debe asignar a esta propiedad.
- value – este es el valor que hay que asignar a la propiedad seleccionada. Por ejemplo, si cambiamos el color, se indica el nuevo color aquí.
Vamos a cambiar nuestras líneas, me refiero a: su color, grosor y estilo. Modificamos la función start() del mismo script:
int  start()
{
   double price=iHigh(Symbol(),PERIOD_D1,0);

   ObjectCreate("highLine",OBJ_HLINE,0,0,price);
   price=iLow(Symbol(),PERIOD_D1,0);
   ObjectCreate("lowLine",OBJ_HLINE,0,0,price);

   ObjectSet("highLine",OBJPROP_COLOR,LimeGreen);
   // changing the color of the upper line
   ObjectSet("highLine",OBJPROP_WIDTH,3);
   // now the line will be 3 pixel wide

   ObjectSet("lowLine",OBJPROP_COLOR,Crimson);
   // changing the color of the lower line
   ObjectSet("lowLine",OBJPROP_STYLE,STYLE_DOT);
   // now the lower line will be dashed

   return(0);
}
Verá lo siguiente en el gráfico:
Eliminar objetos
Le hará falta a menudo eliminar objetos obsoletos o innecesarios. Existen varias funciones para hacerlo:
bool ObjectDelete(string name);
Esta función elimina el objeto con el nombre indicado. Si se indica el nombre de un objeto inexistente, la función devolverá false.
int ObjectsDeleteAll(int window=EMPTY,int type=EMPTY);
Esta otra función devuelve el número de objetos eliminados. Tiene también valores por defecto. Si no se especifica ningún parámetro, el terminal eliminará todos los objetos del gráfico actual:
ObjectsDeleteAll();
// deleting all objects
Si ha creado un objeto en una subventana (por ejemplo en una ventana de algún indicador), puede eliminar todos sus objetos indicando el número de esta ventana en el primer argumento. De momento, ponga 0 en el primer argumento, abordaremos las subventanas más adelante.
Si quiere eliminar todos los objetos de un tipo determinado, especifique el tipo en el segundo argumento:
ObjectsDeleteAll(0, OBJ_ARROW);
// deleting all arrows
¿Cómo utilizar todo esto correctamente?
Podría pensar que necesita saber mucho más para poder utilizar todo esto correctamente. Que hay que conocer todas estas propiedades y tipos de objetos. Pero esto no es cierto. Está todo en la Guía de usuario.
Primero abrimos la Caja de herramientas (Ctrl+T). Hay muchas pestañas arriba, seleccionamos Ayuda. Supongamos que necesita dibujar un objeto gráfico, pero no sabe cómo hacerlo. Hay que utilizar la función ObjectCreate(). Escribimos la función y dejamos los argumentos vacíos. Colocamos el cursor dentro del nombre de la función y pulsamos F1. La ventana de Ayuda mostrará la información de esta función. Esto quiere decir que no tiene que buscar nada. Vea ahora la descripción de la función. Le sigue la descripción de todos sus argumentos. Preste atención a la descripción del argumento type:
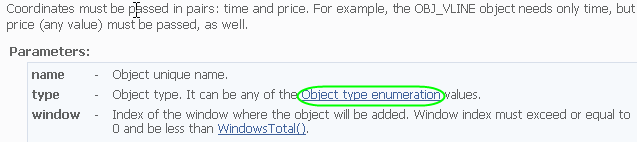
Contiene un enlace. Al hacer un clic encima de enlace verá la lista de los objetos existentes. Supongamos que quiere un elipse:
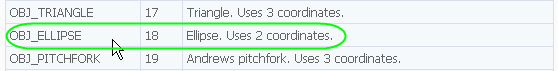
Lea la descripción y se dará cuenta que hacen falta 2 coordenadas: Empecemos:
int  start()
{
   ObjectCreate("ellipse",OBJ_ELLIPSE,0,Time[100],Low[100],Time[0],High[0]);
   // indicate 2 points for creating an ellipse:
   // * 1st - lower left point
   // * 2nd - upper right point

   return(0);
}
Se menciona también que la propiedad OBJPROP_SCALE estableces de la relación de aspecto de los dos lados. De modo que al pone 1 obtendremos un círculo:
int  start()
{
   ObjectsDeleteAll();
   // clear the chart before drawing

   ObjectCreate("ellipse",OBJ_ELLIPSE,0,Time[100],Low[100],Time[0],High[0]);

   ObjectSet("ellipse",OBJPROP_SCALE,1.0);
   // change the correlation of sides
   ObjectSet("ellipse",OBJPROP_COLOR,Gold);
   // change the color

   return(0);
}
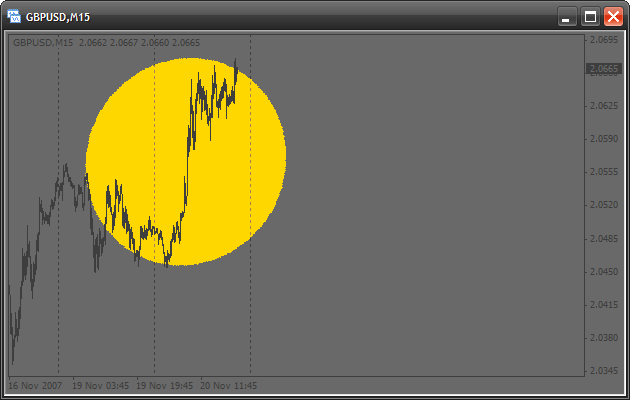
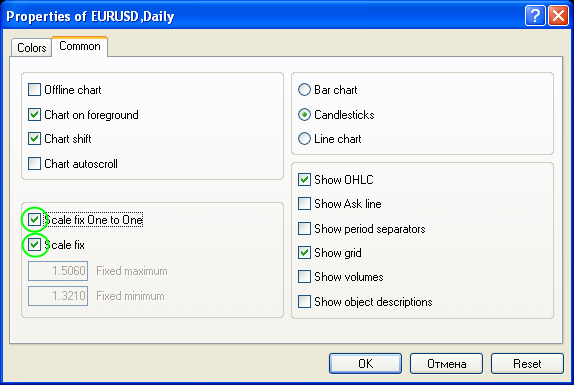
Estoy seguro de que no ha obtiene un círculo, ya que hace falta poner la escala 1:1 en las propiedades del gráfico (haga un clic derecho sobre un área vacía del gráfico y seleccione Propiedades):
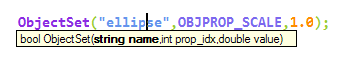
Como puede ver, es bastante fácil. De hecho, puede colocar el cursor encima de cualquier palabra clave y pulsar F1 y verá su información en la Ayuda. Así que no tiene que recordar todos los nombres de tipos y propiedades para escribir el código de forma rápida y eficiente gracias a la Ayuda incluida. MetaEditor tiene otra propiedad muy importante que le ayudará para escribir su código: al escribir los argumentos en una función integrada, pulse CTRL + SHIFT + Espacio. Aparecerá un recuadro con el prototipo de la función:
Crear objetos gráficos en subventanas
Si quiere dibujar objetos gráficos en una subventana, por ejemplo en la ventaba de un indicador personalizado, tiene que conocer su número. Como ejemplo, vamos a escribir un sencillo indicador que dibujará una línea horizontal en una ventana separada. Creamos un indicador personalizado y añadimos los siguiente al código:
//+------------------------------------------------------------------+
//|                                   creatingObjectsInSubWindow.mq4 |
//|                                                     Antonuk Oleg |
//|                                            antonukoleg@gmail.com |
//+------------------------------------------------------------------+
#property copyright "Antonuk Oleg"
#property link      "antonukoleg@gmail.com"

#property indicator_separate_window
// indicator will be written in a separate window
#property indicator_minimum 1
// minimal indicator value is 1
#property indicator_maximum 10
// maximal is 10

//+------------------------------------------------------------------+
//| Custom indicator initialization function                         |
//+------------------------------------------------------------------+
int init()
{
   IndicatorShortName("NiceLine");
   // this simple function sets a short indicator name,
   // you see it in the upper left corner of any indicator.
   // What for do we need it? The function WindowFind searches a subwindow
   // with a specified short name and returns its number.

   int windowIndex=WindowFind("NiceLine");
   // finding the window number of our indicator

   if(windowIndex<0)
   {
      // if the number is -1, there is an error
      Print("Can\'t find window");
      return(0);
   }

   ObjectCreate("line",OBJ_HLINE,windowIndex,0,5.0);
   // drawing a line in the indicator subwindow

   ObjectSet("line",OBJPROP_COLOR,GreenYellow);
   ObjectSet("line",OBJPROP_WIDTH,3);

   WindowRedraw();
   // redraw the window to see the line

   return(0);
}
//+------------------------------------------------------------------+
//| Custom indicator deinitialization function                       |
//+------------------------------------------------------------------+
int deinit()
{
   ObjectsDeleteAll();
   // delete all objects

   return(0);
}
//+------------------------------------------------------------------+
//| Custom indicator iteration function                              |
//+------------------------------------------------------------------+
int start()
{
   return(0);
}
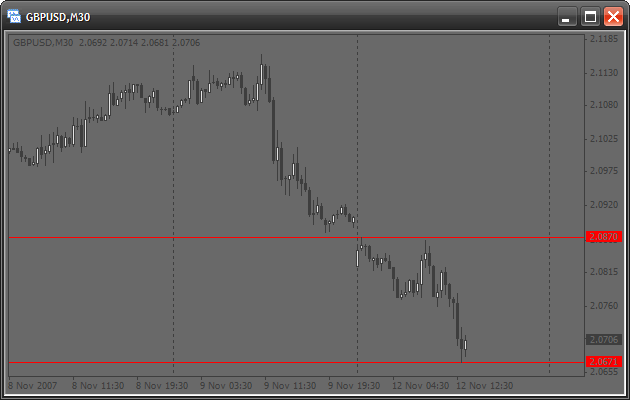
Ejecutamos el indicador. ¡No hay ninguna línea!
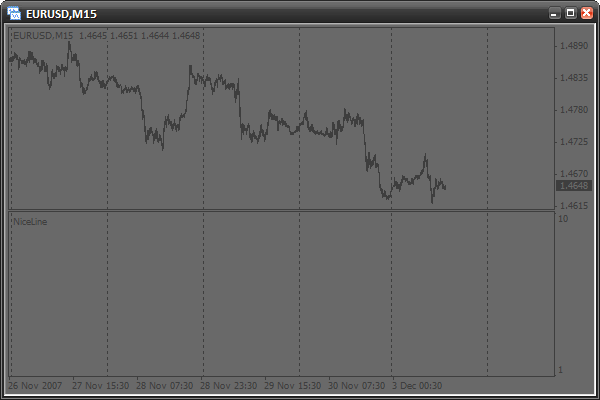
Tenemos que cambiar el período del gráfico.
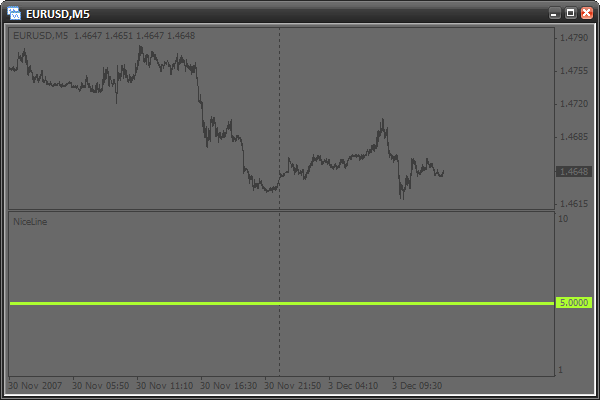
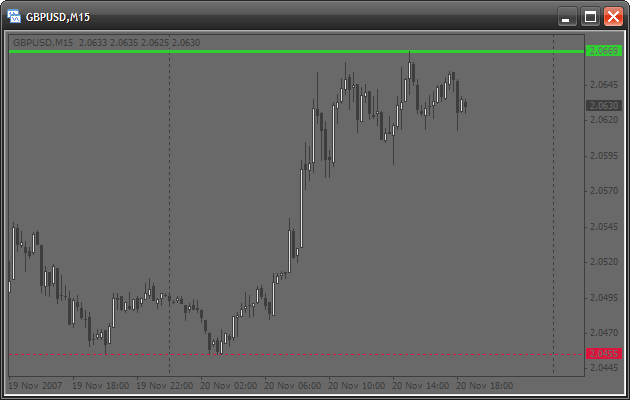
Sí que está ahora. ¿Qué ha pasado? En realidad, no se puede encontrar el número de la subventana en la función init() en su primera ejecución. Esto se debe tal vez al hecho de que el terminal aún no ha creado la subventana durante la inicialización. Esto se puede solucionar; hay que hacer todo en la función start(), cuando la ventana ya está creada, así:
//+------------------------------------------------------------------+
//|                                   creatingObjectsInSubWindow.mq4 |
//|                                                     Antonuk Oleg |
//|                                            antonukoleg@gmail.com |
//+------------------------------------------------------------------+
#property copyright "Antonuk Oleg"
#property link      "antonukoleg@gmail.com"

#property indicator_separate_window
#property indicator_minimum 1
#property indicator_maximum 10

bool initFinished=false;
// adding a variable that will remember the initialization state.
// false - there was no initialization
// true - there was initialization

//+------------------------------------------------------------------+
//| Custom indicator initialization function                         |
//+------------------------------------------------------------------+
int init()
{
   return(0);
}
//+------------------------------------------------------------------+
//| Custom indicator deinitialization function                       |
//+------------------------------------------------------------------+
int deinit()
{
   ObjectsDeleteAll();
   // deleting all objects

   return(0);
}
//+------------------------------------------------------------------+
//| Custom indicator iteration function                              |
//+------------------------------------------------------------------+
int start()
{
   if(initFinished==false)
   {
      IndicatorShortName("NiceLine");

      int windowIndex=WindowFind("NiceLine");

      if(windowIndex<0)
      {
         // if the subwindow number is -1, there is an error
         Print("Can\'t find window");
         return(0);
      }

      ObjectCreate("line",OBJ_HLINE,windowIndex,0,5.0);
      // drawing a line in the indicator subwindow

      ObjectSet("line",OBJPROP_COLOR,GreenYellow);
      ObjectSet("line",OBJPROP_WIDTH,3);

      WindowRedraw();
      // redraw the window to see the line

      initFinished=true;
      // drawing is finished
   }

   return(0);
}
Ahora se dibujará todo desde el primer momento. Hay que recordar que el número de subventana se encuentra en la función start() y no en int().
Un poco de práctica
Mediante la Ayuda, intente estudiar algunos objetos gráficos nuevos. Después, escriba un script que dibujará estos objetos gráficos y configurará sus parámetros. Haga esta tarea correctamente, coja un poco de práctica y sólo después siga leyendo el artículo.
Escribir un indicador de señales. ¿Esto qué es?
Imagine la situación. Un trader utiliza varios indicadores para tomar decisiones sobre la entrada al mercado. Moving Average, Parabolic SAR y Williams’ Percent Range. Son indicadores integrados y se ven así:
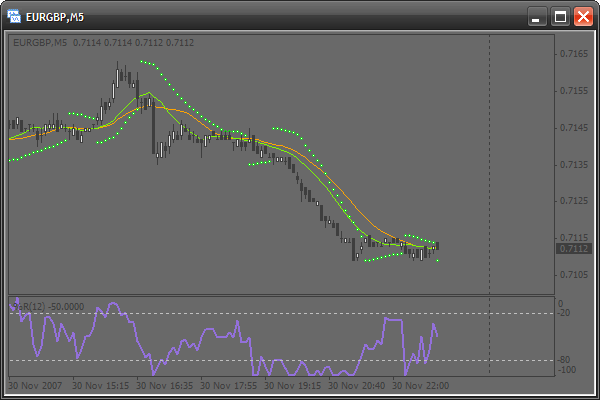
Un trader evalúa constantemente la situación en el mercado de la siguiente manera: hay que entrar al mercado cuando llega la señal de los tres indicadores a la vez:
- Si el promedio móvil rápido está por encima del lento, es una señal para comprar. Al revés para vender.
- Si el precio es inferior al Parabolic SAR, es una señal para vender. Al revés para comprar.
- Si el Williams’ Percent Range es superior a -20, es una señal para comprar. Si el Williams’ Percent Range es inferior a -80, es una señal para vender.
El trader tiene que comprobar constantemente todas las condiciones, mientras intenta hacer un seguimiento en varios períodos. Es un trabajo duro. Por lo tanto, un indicador de señales que hiciera todas las comprobaciones le puede ayudar:
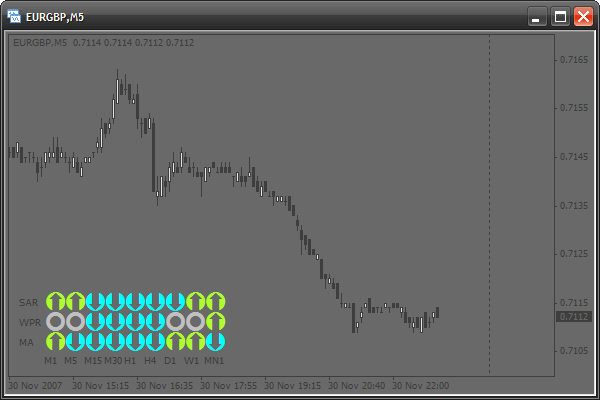
Hemos aprendido cómo resolver este problema. Vamos a escribir un indicador de señales que se pueda configurar fácilmente. Además, va a crear su propio indicador de señales en base a este y con sus indicadores favoritos.
Conceptos básicos
Al crear este indicador encontraremos algunas complicaciones con el dibujo. Todos los objetos gráficos se dibujan mediante los coordenadas del precio y el tiempo. Es por eso que el dibujo está constantemente desplazado. Para que los objetos sigan en la misma posición, tendríamos que estar cambiando sus coordenadas constantemente. Y si queremos ver lo que ocurrió antes y desplazamos el gráfico, el gráfico de la señal también se desplazará. Pero todas las reglas tienen excepciones. Entre el arsenal de objetos gráficos tenemos el OBJ_LABEL. Es una etiqueta de texto que se usa para el posicionamiento, pero no el del precio y el tiempo, sino las coordenadas relativas a la ventana en píxeles. Es fácil:
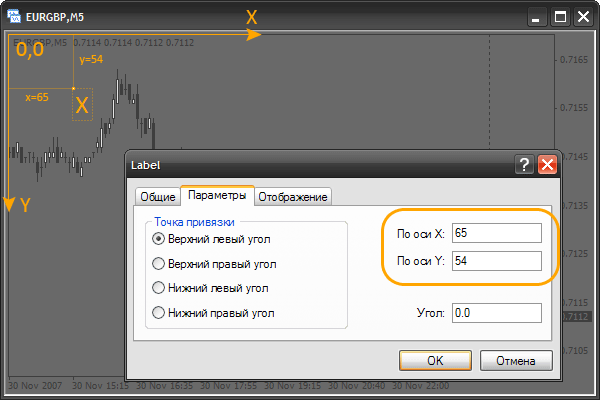
Vemos un texto normal "X". Podemos ver en sus parámetros que sus coordenadas están indicadas en píxeles. El píxel es el punto más pequeño e la pantalla. Tenga en cuenta que las coordenadas de la esquina superior izquierda son: x=0, y=0 (0,0). Si se incrementa x, se desplazará el objeto a la derecha, si disminuye, se desplazará a la izquierda. Lo mismo ocurre con la coordenada y. Se puede desplazar hacia arriba o hacia abajo. Es muy importante entender y recordar este principio. Para practicar, puede crear una etiqueta y desplazarla para ver cómo cambian sus coordenadas en las propiedades. También podemos ver las cotizaciones anteriores desplazando el gráfico. Con eso la etiqueta no se desplaza. Mediante estas etiquetas podemos crear un indicador de señales sin los inconvenientes mencionados anteriormente.
Características de las etiquetas de texto
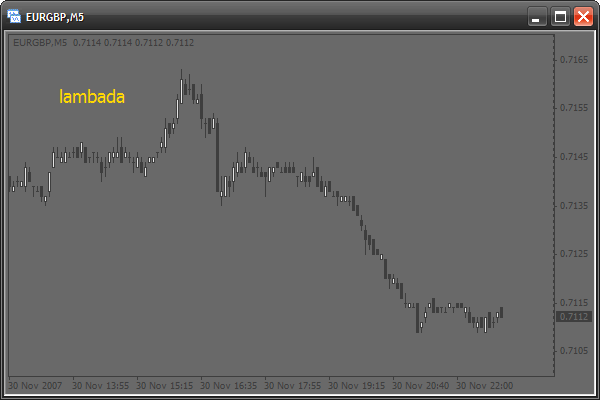
Nuestro indicador de señales usará únicamente etiquetas de texto. Veamos sus características. En primer lugar, vamos a crear un indicador nuevo (sin utilizar buffers de datos ni parámetros) y modificamos el código de la función init():
int init()
{
   // now we will crate a text mark.
   // for this use the function ObjectCreate.
   // do not indicate coordinates
   ObjectCreate("signal",OBJ_LABEL,0,0,0,0,0);

   // change the x-coordinate
   ObjectSet("signal",OBJPROP_XDISTANCE,50);

   // change the y-coordinate
   ObjectSet("signal",OBJPROP_YDISTANCE,50);

   // to indicate the mark text, use the following function
   ObjectSetText("signal","lambada",14,"Tahoma",Gold);
   // "signal" - object name
   // "lambada" - text
   // 14 - font size
   // Gold - color

   return(0);
}
Como puede ver, es bastante fácil. Se usará la función ObjectCreate() únicamente durante la inicialización para crear todos los objetos necesarios. Mediante ObjectSetText() cambiaremos el aspecto de los objetos con cada cambio de precio en la función start(). También hay que modificar el código de la función deinit():
int deinit()
{
   // when deleting the indicator delete all objects
   ObjectsDeleteAll();

   return(0);
}
Ejecute el indicador ahora y observe los resultados:
Vamos a utilizar las siguientes opciones de etiquetas:
- cambiamos la fuente a Wingdings para disponer de los símbolos especiales (de cuadrados y círculos a emoticonos):
- cambiaremos el color y el texto de la etiqueta
- cambiaremos la posición y el tamaño de la etiqueta
Uso de la fuente Wingdings
Vamos a crear una etiqueta mediante la fuente Wingdings. Hay que modificar el código de la función init():
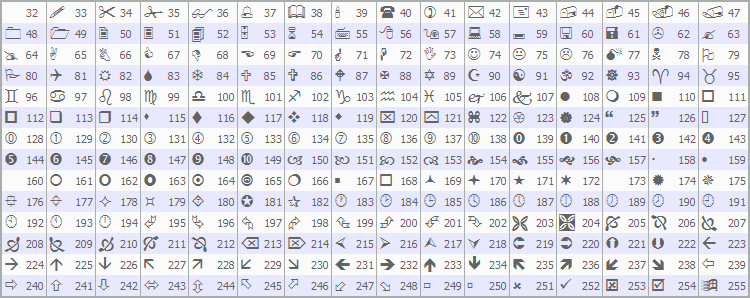
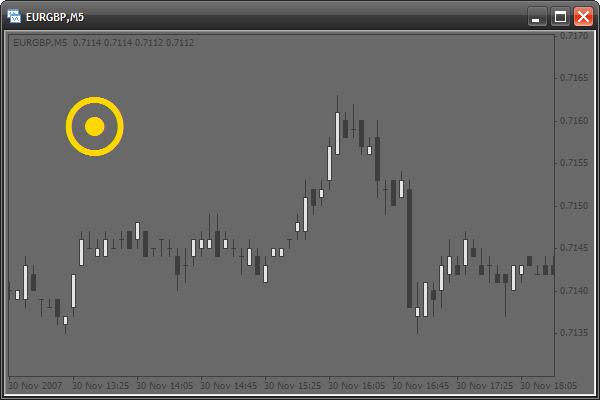
int init()
{

   ObjectCreate("signal",OBJ_LABEL,0,0,0,0,0);
   ObjectSet("signal",OBJPROP_XDISTANCE,50);
   ObjectSet("signal",OBJPROP_YDISTANCE,50);

   // use symbols from the Wingdings font
   ObjectSetText("signal",CharToStr(164),60,"Wingdings",Gold);
   // CharToStr() - this function returns a line with a single
   // symbol, the code of which is specified in the single argument.
   // Simply select a symbol from the table above and write
   // its number into this function
   // 60 - use large font
   // "Wingdings" - use font Wingdings

   return(0);
}
Este es el resultado:
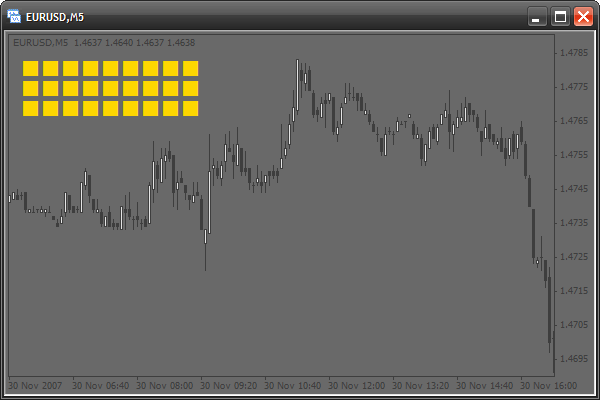
Dibujar la estructura de una tabla de señales
Vamos a dibujar la estructura de una tabla de señales. En realidad, será un número de casillas:
int init()
{
   // use 2 cycles. The first cycle, with the counter "x" draws one by one
   // each column from left to wright. The second cycle draws symbols of each
   // column from top downward. At each iteration the cycle will create a mark.
   // These 2 cycles create 9 columns (9 periods) 3 marks each (3 signal types).
   for(int x=0;x<9;x++)
      for(int y=0;y<3;y++)
      {
         ObjectCreate("signal"+x+y,OBJ_LABEL,0,0,0,0,0);
         // create the next mark, Note that the mark name
         // is created "on the fly" and depends on "x" and "y" counters

         ObjectSet("signal"+x+y,OBJPROP_XDISTANCE,x*20);
         // change the X coordinate.
         // x*20 - each mark is created at the interval of 20 pixels
         // horizontally and directly depends on the "x" counter

         ObjectSet("signal"+x+y,OBJPROP_YDISTANCE,y*20);
         // change the Y coordinate.
         // y*20 - each mark is created at the interval of 20 pixels
         // vertically and directly depends on the "y" counter

         ObjectSetText("signal"+x+y,CharToStr(110),20,"Wingdings",Gold);
         // use the 110th symbol code (square)
      }

   return(0);
}
La estructura está lista. Vamos añadir márgenes por la izquierda y por encima de la estructura de manera que podamos ver el texto:
int init()
{
   for(int x=0;x<9;x++)
      for(int y=0;y<3;y++)
      {
         ObjectCreate("signal"+x+y,OBJ_LABEL,0,0,0,0,0);
         ObjectSet("signal"+x+y,OBJPROP_XDISTANCE,x*20+12);
         // adding a horizontal indent 12 pixels
         ObjectSet("signal"+x+y,OBJPROP_YDISTANCE,y*20+20);
         // adding a vertical indent 20 pixels
         ObjectSetText("signal"+x+y,CharToStr(110),20,"Wingdings",Gold);
      }

   return(0);
}
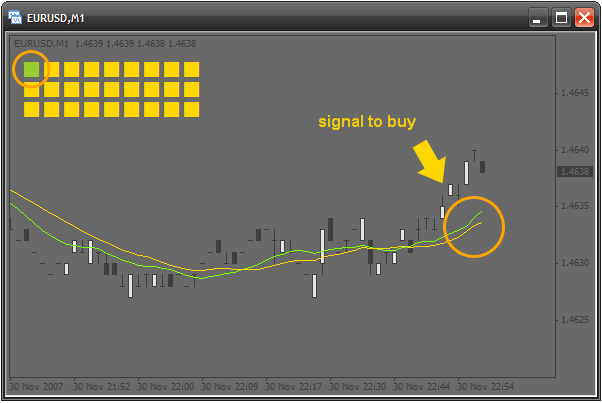
Activar la estructura
Vamos a hacer funcionar por lo menos una de las casillas. Supongamos que la casilla superior izquierda va a mostrar la señal de los promedios móviles en un período de tiempo de un minuto (M1). Si hay una señal para comprar, la casilla cambia su color al verde. Si hay una señal para vender, cambia al rojo. Hay que modificar el código de la función start():
int start()
{
   // if quick moving average (period - 13) is larger than the slow one,
   // this is a signal to buy. Check the last bar
   if(iMA(Symbol(),1,13,0,0,0,0)>iMA(Symbol(),1,24,0,0,0,0))
      ObjectSetText("signal00",CharToStr(110),20,"Wingdings",YellowGreen);
   // change the color of the mark named "signal00" (the upper left)
   // into green

   else
   // else, if the quick MA is smaller than the slow one, this is a signal to sell.
      ObjectSetText("signal00",CharToStr(110),20,"Wingdings",Tomato);
      // change the color into red

   return(0);
}
Activar la fila superior
Sigamos con la activación. La casilla superior izquierda muestra el período de tiempo más pequeño; M1. Ahora vamos a hacer que cada casilla indique un período de tiempo mayor a la anterior. Por lo tanto, la segunda casilla muestra las señales en M5, la tercera en M15 y así sucesivamente hasta MN1. Por supuesto, todo esto se hará en bucle. Lo que ha cambiado a fin de cuentas es el nombre y el período. Tenemos 9 casillas, por lo que usamos un contador. Pero hay un problema con los períodos, ya que cambian sin seguir ningún patrón. Fíjese:
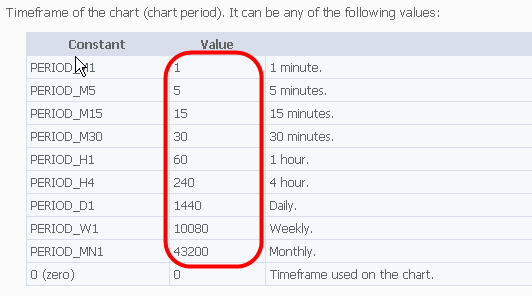
Podemos pensar que no se puede usar un bucle aquí. Pero esto no es cierto. Todo lo que necesitamos es una matriz especial al principio del código del indicador:
//////////////////////////////////////////////////////////////////////
//
//                                                  signalTable.mq4
//                                                     Antonuk Oleg
//                                            antonukoleg@gmail.com
//
//////////////////////////////////////////////////////////////////////
#property copyright "Antonuk Oleg"
#property link      "antonukoleg@gmail.com"

#property indicator_chart_window
int period[]={1,5,15,30,60,240,1440,10080,43200};
Se han escrito todos los períodos en la matriz, ahora se pueden utilizar sin ningún problema en un bucle:
int start()
{
   // use a cycle to activate all squares of the first line
   for(int x=0;x<9;x++)
   {
      if(iMA(Symbol(),period[x],13,0,0,0,0)>iMA(Symbol(),period[x],24,0,0,0,0))
         ObjectSetText("signal"+x+"0",CharToStr(110),20,"Wingdings",YellowGreen);
         // "signal"+x+"0" - create a mark name dynamically depending on
         // the counter "x"
      else
         ObjectSetText("signal"+x+"0",CharToStr(110),20,"Wingdings",Tomato);
   }

   return(0);
}
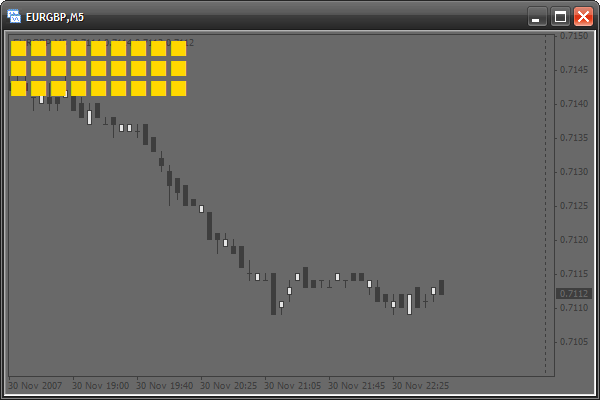
Usamos la matriz period[] como tabla de correspondencia del contador "x" con el período. ¡Imagínese la cantidad de código que haría falta si no fuera por esta pequeña matriz! Ya está lista la primera fila de casillas de las señales:
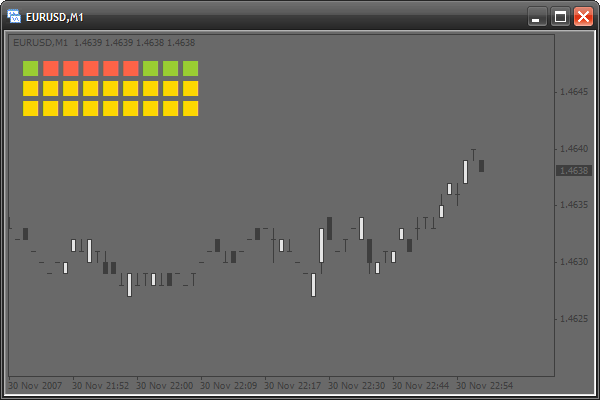
Añadir textos
Es muy bonito, pero no está claro cuál es el período de tiempo de cada casilla, así que vamos a crear textos explicativos. También usaremos una matriz de correspondencia que almacenará las etiquetas de cada columna:
#property indicator_chart_window

int period[]={1,5,15,30,60,240,1440,10080,43200};

string periodString[]={"M1","M5","M15","M30","H1","H4","D1","W1","MN1"};
Se crearán los textos en la función init() con la ayuda del siguiente bucle:
int init()
{
   for(int x=0;x<9;x++)
      for(int y=0;y<3;y++)
      {
         ObjectCreate("signal"+x+y,OBJ_LABEL,0,0,0,0,0);
         ObjectSet("signal"+x+y,OBJPROP_XDISTANCE,x*20+12);
         ObjectSet("signal"+x+y,OBJPROP_YDISTANCE,y*20+20);
         ObjectSetText("signal"+x+y,CharToStr(110),20,"Wingdings",Gold);
      }

   // create writings for periods from left to right
   for(x=0;x<9;x++)
   {
      // everything is as usual
      ObjectCreate("textPeriod"+x,OBJ_LABEL,0,0,0,0,0);
      ObjectSet("textPeriod"+x,OBJPROP_XDISTANCE,x*20+12);
      ObjectSet("textPeriod"+x,OBJPROP_YDISTANCE,10);
      ObjectSetText("textPeriod"+x,periodString[x],8,"Tahoma",Gold);
      // we use the array periodString[], to indicate writings
   }

   return(0);
}
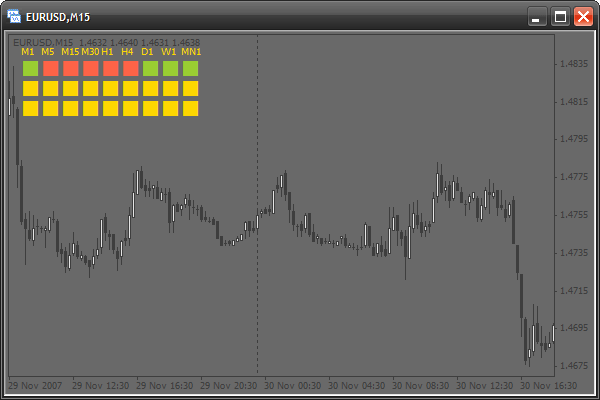
Añadir algunos parámetros
Vamos a hacer que el indicador sea más versátil añadiendo un par de parámetros que permiten al usuario configurar el aspecto del indicador.
#property copyright "Antonuk Oleg"
#property link      "antonukoleg@gmail.com"

#property indicator_chart_window

extern int scaleX=20, // horizontal interval at which the squares are created
           scaleY=20, // vertical interval
           offsetX=35, // horizontal indent of all squares
           offsetY=20, // vertical indent
           fontSize=20; // font size

int period[]={1,5,15,30,60,240,1440,10080,43200};
string periodString[]={"M1","M5","M15","M30","H1","H4","D1","W1","MN1"};
Vamos a modificar también el código de las funciones init() y start():
int init()
{
   for(int x=0;x<9;x++)
      for(int y=0;y<3;y++)
      {
         ObjectCreate("signal"+x+y,OBJ_LABEL,0,0,0,0,0);
         ObjectSet("signal"+x+y,OBJPROP_XDISTANCE,x*scaleX+offsetX);
         ObjectSet("signal"+x+y,OBJPROP_YDISTANCE,y*scaleY+offsetY);
         ObjectSetText("signal"+x+y,CharToStr(110),fontSize,"Wingdings",Gold);
      }

   for(x=0;x<9;x++)
   {
      ObjectCreate("textPeriod"+x,OBJ_LABEL,0,0,0,0,0);
      ObjectSet("textPeriod"+x,OBJPROP_XDISTANCE,x*scaleX+offsetX);
      ObjectSet("textPeriod"+x,OBJPROP_YDISTANCE,offsetY-10);
      ObjectSetText("textPeriod"+x,periodString[x],8,"Tahoma",Gold);
   }

   return(0);
}

int start()
{
   for(int x=0;x<9;x++)
   {
      if(iMA(Symbol(),period[x],13,0,0,0,0)>iMA(Symbol(),period[x],24,0,0,0,0))
         ObjectSetText("signal"+x+"0",CharToStr(110),fontSize,"Wingdings",YellowGreen);
      else
         ObjectSetText("signal"+x+"0",CharToStr(110),fontSize,"Wingdings",Tomato);
   }

   return(0);
}
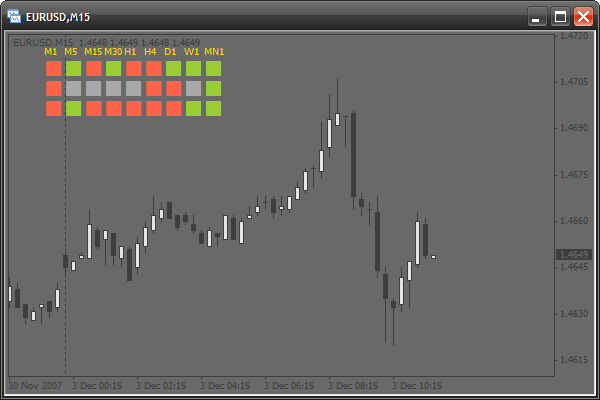
Activar otras filas
La segunda fila mostrará las señales del indicador Williams’ Percent Range y la tercera fila las del indicador Parabolic SAR. Modificamos el código de la función start():
int start()
{
   for(int x=0;x<9;x++)
   {
      if(iMA(Symbol(),period[x],13,0,0,0,0)>iMA(Symbol(),period[x],24,0,0,0,0))
         ObjectSetText("signal"+x+"0",CharToStr(110),fontSize,"Wingdings",YellowGreen);
      else
         ObjectSetText("signal"+x+"0",CharToStr(110),fontSize,"Wingdings",Tomato);
   }

   // activate the second row
   for(x=0;x<9;x++)
   {
      // if the absolute value of WPR is lower than 20, this is a signal to buy
      if(MathAbs(iWPR(Symbol(),period[x],13,0))<20.0)
         ObjectSetText("signal"+x+"1",CharToStr(110),fontSize,"Wingdings",YellowGreen);
      // if the absolute value of WPR is larger than 80, this is a signal to sell
      else if(MathAbs(iWPR(Symbol(),period[x],13,0))>80.0)
         ObjectSetText("signal"+x+"1",CharToStr(110),fontSize,"Wingdings",Tomato);
      // else, if there are no signals, a square is painted gray
      else
         ObjectSetText("signal"+x+"1",CharToStr(110),fontSize,"Wingdings",DarkGray);
   }

   // activate the third row
   for(x=0;x<9;x++)
   {
      // if the current price is larger than the value of SAR, this is a signal to buy
      if(iSAR(Symbol(),period[x],0.02,0.2,0)<Close[0])
         ObjectSetText("signal"+x+"2",CharToStr(110),fontSize,"Wingdings",YellowGreen);
      // otherwise, it is a signal to sell
      else
         ObjectSetText("signal"+x+"2",CharToStr(110),fontSize,"Wingdings",Tomato);
   }

   return(0);
}
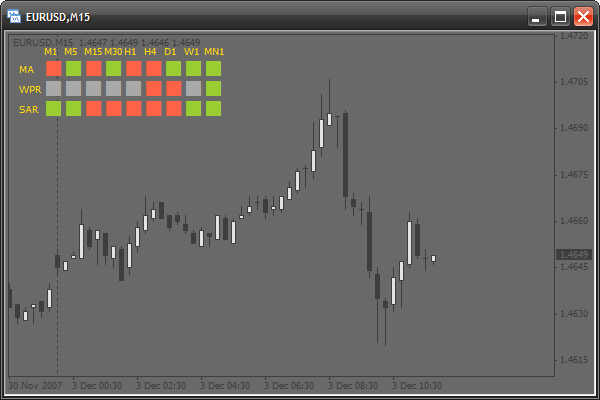
Añadir los nombres de las señales
Pongamos ahora un nombre a cada fila. Vamos a crear 3 etiquetas a la izquierda mediante una matriz, igual que antes:
int period[]={1,5,15,30,60,240,1440,10080,43200};
string periodString[]={"M1","M5","M15","M30","H1","H4","D1","W1","MN1"},
       // create one more array with indicator names
string signalNameString[]={"MA","WPR","SAR"};
Hay que modificar el código de la función init():
int init()
{
   for(int x=0;x<9;x++)
      for(int y=0;y<3;y++)
      {
         ObjectCreate("signal"+x+y,OBJ_LABEL,0,0,0,0,0);
         ObjectSet("signal"+x+y,OBJPROP_XDISTANCE,x*scaleX+offsetX);
         ObjectSet("signal"+x+y,OBJPROP_YDISTANCE,y*scaleY+offsetY);
         ObjectSetText("signal"+x+y,CharToStr(110),fontSize,"Wingdings",Gold);
      }

   for(x=0;x<9;x++)
   {
      ObjectCreate("textPeriod"+x,OBJ_LABEL,0,0,0,0,0);
      ObjectSet("textPeriod"+x,OBJPROP_XDISTANCE,x*scaleX+offsetX);
      ObjectSet("textPeriod"+x,OBJPROP_YDISTANCE,offsetY-10);
      ObjectSetText("textPeriod"+x,periodString[x],8,"Tahoma",Gold);
   }

   // draw signal names from top downwards
   for(y=0;y<3;y++)
   {
      ObjectCreate("textSignal"+y,OBJ_LABEL,0,0,0,0,0);
      ObjectSet("textSignal"+y,OBJPROP_XDISTANCE,offsetX-25);
      ObjectSet("textSignal"+y,OBJPROP_YDISTANCE,y*scaleY+offsetY+8);
      ObjectSetText("textSignal"+y,signalNameString[y],8,"Tahoma",Gold);
   }

   return(0);
}
Añadir la opción para cambiar la esquina de referencia
Vamos a añadir una opción para elegir la ubicación de la señal del indicador. Ahora está vinculada a la esquina superior izquierda. Si cambiamos la propiedad de la etiqueta OBJPROP_CORNER, cambiará la esquina. Esta propiedad puede tomar los siguientes valores:
- 0 – esquina superior izquierda
- 1 – esquina superior derecha
- 2 – esquina inferior izquierda
- 3 – esquina inferior derecha
Así que vamos a añadir un nuevo parámetro, es corner:
#property indicator_chart_window

extern int scaleX=20,
           scaleY=20,
           offsetX=35,
           offsetY=20,
           fontSize=20,
           corner=0; // adding a parameter for choosing a corner
Hay que modificar el código de la función init():
int init()
{
   // a table of signals
   for(int x=0;x<9;x++)
      for(int y=0;y<3;y++)
      {
         ObjectCreate("signal"+x+y,OBJ_LABEL,0,0,0,0,0);
         ObjectSet("signal"+x+y,OBJPROP_CORNER,corner);
         // change the corner
         ObjectSet("signal"+x+y,OBJPROP_XDISTANCE,x*scaleX+offsetX);
         ObjectSet("signal"+x+y,OBJPROP_YDISTANCE,y*scaleY+offsetY);
         ObjectSetText("signal"+x+y,CharToStr(110),fontSize,"Wingdings",Gold);
      }

   // name of timeframes
   for(x=0;x<9;x++)
   {
      ObjectCreate("textPeriod"+x,OBJ_LABEL,0,0,0,0,0);
      ObjectSet("textPeriod"+x,OBJPROP_CORNER,corner);
      // changing the corner
      ObjectSet("textPeriod"+x,OBJPROP_XDISTANCE,x*scaleX+offsetX);
      ObjectSet("textPeriod"+x,OBJPROP_YDISTANCE,offsetY-10);
      ObjectSetText("textPeriod"+x,periodString[x],8,"Tahoma",Gold);
   }

   // names of indicators
   for(y=0;y<3;y++)
   {
      ObjectCreate("textSignal"+y,OBJ_LABEL,0,0,0,0,0);
          ObjectSet("textSignal"+y,OBJPROP_CORNER,corner);
      // change the corner
      ObjectSet("textSignal"+y,OBJPROP_XDISTANCE,offsetX-25);
      ObjectSet("textSignal"+y,OBJPROP_YDISTANCE,y*scaleY+offsetY+8);
      ObjectSetText("textSignal"+y,signalNameString[y],8,"Tahoma",Gold);
   }

   return(0);
}
Añadir nuevos parámetros
Podemos añadir algunos parámetros para ajustar el aspecto del indicador. Todos los parámetros:
- todos los colores disponibles
- todos los códigos de símbolos disponibles
Primero hay que declarar todos estos parámetros al principio del código:
extern int scaleX=20,
           scaleY=20,
           offsetX=35,
           offsetY=20,
           fontSize=20,
           corner=0,
           symbolCodeBuy=110, // a symbol code for a buy signal
           symbolCodeSell=110, // sell signal
           symbolCodeNoSignal=110; // no signal

extern color signalBuyColor=YellowGreen, // color of the symbol of a buy signal
             signalSellColor=Tomato, // for a sell signal
             noSignalColor=DarkGray, // no signal
             textColor=Gold; // color of all writings
Vamos a modificar el código de la función init():
int init()
{
   // table of signals
   for(int x=0;x<9;x++)
      for(int y=0;y<3;y++)
      {
         ObjectCreate("signal"+x+y,OBJ_LABEL,0,0,0,0,0);
         ObjectSet("signal"+x+y,OBJPROP_CORNER,corner);
         ObjectSet("signal"+x+y,OBJPROP_XDISTANCE,x*scaleX+offsetX);
         ObjectSet("signal"+x+y,OBJPROP_YDISTANCE,y*scaleY+offsetY);
         ObjectSetText("signal"+x+y,CharToStr(symbolCodeNoSignal),
                       fontSize,"Wingdings",noSignalColor);
      }

   // names of timeframes
   for(x=0;x<9;x++)
   {
      ObjectCreate("textPeriod"+x,OBJ_LABEL,0,0,0,0,0);
      ObjectSet("textPeriod"+x,OBJPROP_CORNER,corner);
      ObjectSet("textPeriod"+x,OBJPROP_XDISTANCE,x*scaleX+offsetX);
      ObjectSet("textPeriod"+x,OBJPROP_YDISTANCE,offsetY-10);
      ObjectSetText("textPeriod"+x,periodString[x],8,"Tahoma",textColor);
   }

   // names of indicators
   for(y=0;y<3;y++)
   {
      ObjectCreate("textSignal"+y,OBJ_LABEL,0,0,0,0,0);
      ObjectSet("textSignal"+y,OBJPROP_CORNER,corner);
      ObjectSet("textSignal"+y,OBJPROP_XDISTANCE,offsetX-25);
      ObjectSet("textSignal"+y,OBJPROP_YDISTANCE,y*scaleY+offsetY+8);
      ObjectSetText("textSignal"+y,signalNameString[y],8,"Tahoma",textColor);
   }

   return(0);
}
Modificamos el código de la función start():
int start()
{
   for(int x=0;x<9;x++)
   {
      if(iMA(Symbol(),period[x],13,0,0,0,0)>iMA(Symbol(),period[x],24,0,0,0,0))
         ObjectSetText("signal"+x+"0",CharToStr(symbolCodeBuy),fontSize,
         "Wingdings",signalBuyColor);
      else
         ObjectSetText("signal"+x+"0",CharToStr(symbolCodeSell),fontSize,
         "Wingdings",signalSellColor);
   }

   for(x=0;x<9;x++)
   {
      if(MathAbs(iWPR(Symbol(),period[x],13,0))<20.0)
         ObjectSetText("signal"+x+"1",CharToStr(symbolCodeBuy),fontSize,
         "Wingdings",signalBuyColor);
      else if(MathAbs(iWPR(Symbol(),period[x],13,0))>80.0)
         ObjectSetText("signal"+x+"1",CharToStr(symbolCodeSell),fontSize,
         "Wingdings",signalSellColor);
      else
         ObjectSetText("signal"+x+"1",CharToStr(symbolCodeNoSignal),fontSize,
         "Wingdings",noSignalColor);
   }

   for(x=0;x<9;x++)
   {
      if(iSAR(Symbol(),period[x],0.02,0.2,0)<Close[0])
         ObjectSetText("signal"+x+"2",CharToStr(symbolCodeBuy),fontSize,
         "Wingdings",signalBuyColor);
      else
         ObjectSetText("signal"+x+"2",CharToStr(symbolCodeSell),fontSize,
         "Wingdings",signalSellColor);
   }

   return(0);
}
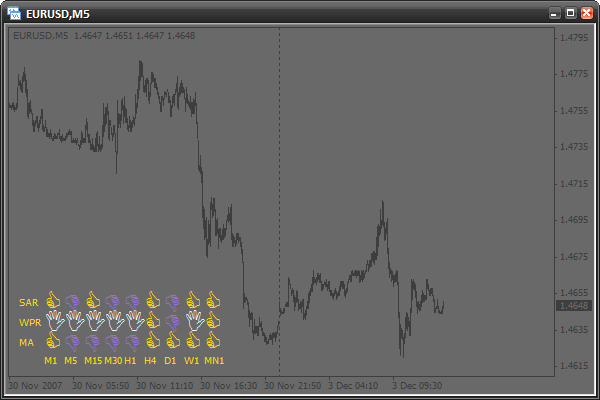
Cambio la apariencia
El indicador está listo. Mediante el cambio de los parámetros de entrada podemos cambiar la apariencia del indicador por completo.
extern int scaleX=20,
           scaleY=20,
           offsetX=35,
           offsetY=20,
           fontSize=20,
           corner=2,
           symbolCodeBuy=67,
           symbolCodeSell=68,
           symbolCodeNoSignal=73;

extern color signalBuyColor=Gold,
             signalSellColor=MediumPurple,
             noSignalColor=WhiteSmoke,
             textColor=Gold;
Tarea
Trate de crear sus propias condiciones de señales y añada una fila más. Cree nuevos parámetros. Por ejemplo, un parámetro que detecte el tamaño de la fuente de las etiquetas (períodos de tiempo y nombres de señales). Configure la apariencia del indicador según sus preferencias.
Conclusión
Hemos aprendido a utilizar los objetos gráficos en los scripts e indicadores. Además, hemos aprendido a crear objetos, cambiar sus parámetros y comprobar los errores. Dispone ahora de los conocimientos suficientes para estudiar por sí mismo nuevos tipos de objetos gráficos. También ha creado paso a paso un complejo indicador de señales que se puede configurar de manera versátil.
Los artículos anteriores de la serie "El lenguaje MQL4 para principiantes":