Pivot points para ayudar a determinar las tendencias del mercado
Kushnarev Roman | 7 marzo, 2016
Introducción
El Pivot point (punto pivote) es una línea en el gráfico de precios que muestra una posible tendencia de un par de divisas. Si el precio está por encima de esta línea, la tendencia tiende a crecer. Si el precio está por debajo de esta línea, la tendencia tiende a caer. En este artículo, vamos a enumerar los principios fundamentales de la construcción del Pivot point y trataremos de comprender en qué consiste este concepto.
El cálculo del Pivot mediante los valores del día anterior
La mayoría de los indicadores funcionan de forma parecida: cuentan el Pivot point en base a los valores del día anterior o en base a un intervalo de tiempo arbitrario. Analicemos varios ejemplos:
Cálculo clásico del PIVOT:
//----
i = 1;
while(TimeDay(Time[_shift + i]) == prevDay)
    i++;
// The indicator is developed for history, therefore we
//calculate successively for all days
i--;
FH = High[Highest(NULL, 0, MODE_HIGH, i, _shift + 1)];
FL = Low[Lowest(NULL, 0, MODE_LOW, i, _shift + 1)];
// We take maximal and minimal figures
if(Formula == 0)
    FP = NormalizeDouble((FH + FL + Close[_shift+1]) / 3.0, Digits);
else
    FP = NormalizeDouble((FH + FL + 2*Close[_shift+1]) / 4.0, Digits);
// Direct pivot calculation (only creator’s imagination plays an important role here).
// In this case the sum of maximum, minimum and closing price
// is divided by three. It is so-called “classical” pivot //calculation
ResBuffer[_shift] = NormalizeDouble(FP + (FH - FL), Digits);
SupBuffer[_shift] = NormalizeDouble(FP - (FH - FL), Digits);
//----
El noventa por ciento de los indicadores calculan el Pivot point de esta manera.
PIVOT analítico
En general, los partidarios de la teoría del Pivot point no lo hacen mediante cálculos, sino a partir del servicio de noticias Dow Jones Newswires. Rudolph Axel proporciona el PIVOT del día actual. Este es un ejemplo de sus análisis intradía:
ASESORAMIENTO TéCNICO de los MERCADOS EUROPEOS DE DIVISAS: EUR/GBP ha alcanzado su nivel más alto en ocho años y medio -2- |
La parte central de la previsión se llama "Niveles Axel".
|
EUR/USD |
USD/JPY |
GBP/USD |
USD/CHF |
3.ª resistencia |
1.3117 |
122.2000 |
1.9748 |
1.2544 |
2.ª resistencia |
1.3074 |
121.7500 |
1.9668 |
1.2519 |
1.ª resistencia |
1.3045 |
121.4700 |
1.9623 |
1.2500 |
Pivot point* |
1.3026 |
121.3300 |
1.9546 |
1.2478 |
1.er soporte |
1.3000 |
121.0000 |
1.9549 |
1.2450 |
2.º soporte |
1.2951 |
120.8200 |
1,9514 |
1,2425 |
3.er soporte |
1.2913 |
120.6400 |
1.9483 |
1.2380 |
|
EUR/GBP |
EUR /JPY |
EUR /CHF |
AUD/USD |
3.er soporte |
0.6693 |
159.0200 |
1.6312 |
0.7872 |
2.ª resistencia |
0.6672 |
158.8800 |
1.6298 |
0.7839 |
1.ª resistencia |
0.6661 |
158.6200 |
1.6275 |
0.7820 |
Pivot point* |
0.6664 |
158.1000 |
1.6257 |
0.7806 |
1.er soporte |
0.6643 |
158.1500 |
1.6245 |
0.7787 |
2.º soporte |
0.6625 |
157.8100 |
1.6219 |
0.7765 |
3.er soporte |
614 |
157.2500 |
1.6184 |
0.7750 |
Como puede observar, además de los Pivot points, se pueden obtener de estos análisis las líneas básicas de soporte y resistencia. Para aquellos que no quieren asignar ellos mismos los niveles a partir de servicios de noticias, existe un apartado especial en un sitio webhttp://www.forum.profiforex.ru/showthread.php?t=480 donde se proporciona a diario el script que contiene los niveles. Después de recibir la información analítica, sólo queda reflejarla rápidamente y de "manera eficiente y profesional" en el gráfico del precio. Personalmente, prefiero hacerlo mediante scripts. Una vez trazadas las líneas Axel, los script dejan de funcionar.
El dibujo de las líneas
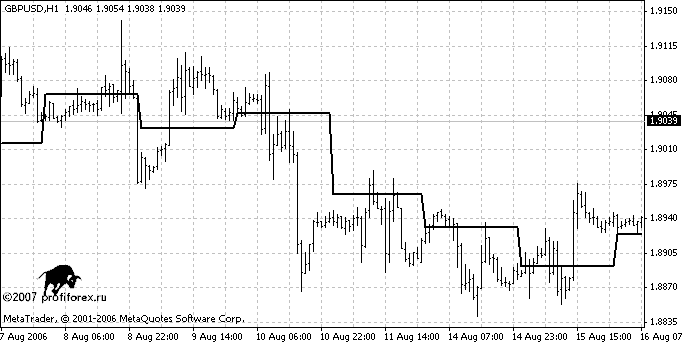
Después de calcular (u obtener a partir de los análisis) el Pivot point, hay que representarlo en el gráfico del Terminal de cliente MetaTrader 4. Analicemos las herramientas que nos permiten dibujar las líneas en el gráfico de forma automática. El primer paso consiste en crear el objeto "Line". Esto se hace de la siguiente manera: en primer lugar hay que determinar la dirección de la línea. Supongamos que empieza el 13 de febrero a las 00:00 y finaliza al final del mismo día. Se determina el nivel mediante la variable "Pivot".
ObjectCreate("PivotDJ", OBJ_TREND, 0, D'2007.02.13 00:00', Pivot,
D'2007.02.13 23:59', Pivot);
// Object title, type (in this case it is “a trend line”)and
//data about the beginning and the end of the line
// Next it’s necessary to define the main properties of the
//line:
ObjectSet("PivotDJ",OBJPROP_COLOR, colorPivot);
// A color
ObjectSet("PivotDJ", OBJPROP_WIDTH, 0);
// A thickness
ObjectSet("PivotDJ", OBJPROP_STYLE, 0);
// A style
ObjectSet("PivotDJ", OBJPROP_RAY, 0);
// It is necessary to draw a ray not the line. (it should not
//come for other days)
ObjectSet("PivotDJ", OBJPROP_STYLE, STYLE_DASH);
// A type of the line
Para dibujar todas las líneas Axel, hace falta crear una línea para cada nivel. Este es le código completo:
// First of all, let's define the levels (we take levels for GBP for one of
// days)
// if(Symbol() == "GBPUSD")
//   {
//     R3 = 1.9591;
//     R2 = 1.9543;
//     R1 = 1.9514;
//     P = 1.9487;
//     S1 = 1.9441;
//     S2 = 1.9405;
//     S3 = 1.9373 ;
//   }
// Drawing the Pivot Line:
 ObjectCreate("PivotDJ", OBJ_TREND, 0, D'2007.02.13 00:00', P,
              D'2007.02.13 23:59', P);
 ObjectSet("PivotDJ", OBJPROP_COLOR, colorPivot);
 ObjectSet("PivotDJ", OBJPROP_WIDTH, 0);
 ObjectSet("PivotDJ", OBJPROP_STYLE, 0);
 ObjectSet("PivotDJ", OBJPROP_RAY, 0);
 ObjectSet("PivotDJ", OBJPROP_STYLE, STYLE_DASH);
// Drawing the 1st support line:
 ObjectCreate("Sup1", OBJ_TREND, 0, D'2007.02.13 00:00', S1,
              D'2007.02.13 23:59', S1);
 ObjectSet("Sup1", OBJPROP_COLOR, colorSup1);
 ObjectSet("Sup1", OBJPROP_WIDTH, 0);
 ObjectSet("Sup1", OBJPROP_STYLE, 0);
 ObjectSet("Sup1", OBJPROP_RAY, 0);
 ObjectSet("Sup1", OBJPROP_STYLE, STYLE_DASH);
// Drawing the 1st resistance:
 ObjectCreate("Res1", OBJ_TREND, 0, D'2007.02.13 00:00', R1,
              D'2007.02.13 23:59', R1);
 ObjectSet("Res1", OBJPROP_COLOR, colorRes1);
 ObjectSet("Res1", OBJPROP_WIDTH, 0);
 ObjectSet("Res1", OBJPROP_STYLE, 0);
 ObjectSet("Res1", OBJPROP_RAY, 0);
 ObjectSet("Res1", OBJPROP_STYLE, STYLE_DASH);
Pero esto no es todo. Hay que añadir un texto distintivo. Es bastante fácil.
// It is enough to create object "Text"
  ObjectCreate("PivotText", OBJ_TEXT, 0, 0, 0);
// and set its basic properties
  ObjectSetText("PivotText", "Pivot Point (DJ)", fontsize, "Arial",
                colorPivot);
// Now it is possible to place it above already drawn lines
// ObjectMove("PivotText", 0, D'2007.02.13 3:00',P);
Como resultado, obtenemos unas líneas claramente dibujadas en el gráfico.
Conclusión
Así pues, hemos examinado los conceptos generales del trading mediante los Pivot points, hemos visto las opciones para calcular las líneas en función de los valores anteriores del precio y hemos visto también distintas maneras que nos proporcionan los analistas para dibujar las líneas (que son más sencillas y mucho más prácticas que el el dibujo manual). ¡Espero que este artículo le ayude a operar en los mercados y obtener beneficios!