Asesor Experto para el trading en un canal
Genkov | 11 mayo, 2016
Introducción
Me gustaría compartir mi experiencia con los traders principiantes que conocen los conceptos básicos de MQL4 y voy a proporcionar un programa que puede resultar útil con el trading en un canal. Antes de comenzar con el trading en un canal, hay que conocer los principios básicos de un canal y cómo cambia el tamaño del canal y su dirección en función de los movimientos del precio. Se dibuja cada línea del canal en base a los fractales formados en el intervalo visible de las barras en el gráfico.
Asesor Experto semiautomático para el trading en un canal
Vamos a comenzar con el programa que está adjunto al artículo.
Primero, vamos a determinar el número de barras para la búsqueda de los fractales por intervalos de tiempo. Vamos a establecer también el valor del espacio (margen) de las flechas que se van a mostrar en el gráfico.
switch (Period())
{
case 1:     B_F=12; space=0.0002; break;
case 5:     B_F=48; space=0.0003; break;
case 15:    B_F=24; space=0.0004; break;
case 30:    B_F=24; space=0.0004; break;
case 60:    B_F=12; space=0.0007; break;
case 240:   B_F=15; space=0.0012; break;
case 1440:  B_F=10; space=0.0030; break;
case 10080: B_F=6;  space=0.0040; break;
}
Iniciamos la creación del canal con la búsqueda de los puntos de referencia (barras) mediante los cuales se dibujarán las líneas del canal. Para los puntos superiores o inferiores identificados vamos a introducir las siguientes condiciones en la variable global:
- Extrem = (0) - no se encuentra ningún fractal,
- Extrem = (1) - se ha encontrado un fractal superior, // cualquier número positivo
- Extrem = (-1) - se ha encontrado un fractal inferior, // cualquier número negativo
Vamos a establecer los valores iniciales de indeterminación de los puntos de referencia y sus posiciones en el gráfico de la siguiente manera:
NB1=-1; NB2=-1; Extrem=0;
La prueba comenzará a partir de la tercera barra (contada como "0") en vista de la posible "formación del fractal".
TestBar=2; // number of the bar being tested
Para identificar los casos en los cuales coinciden las barras de la prueba con el valor máximo o mínimo dentro del intervalo definido antes, vamos a añadir un bucle "while". La condición del bucle sería una expresión con los valores negativos de los números de barras. Además, el número de la barra de la prueba debe ser inferior al número total de las barras probadas.
while(((NB1==-1) || (NB2==-1)) && (TestBar<AllB))
Supongamos primero que los puntos extremos se encuentran abajo y probemos las barras para ver si coinciden con los valores mínimos. Si se encuentran dos puntos, las condiciones del bucle serán falsas y se finaliza la ejecución del operador.
A continuación se muestra un fragmento del bucle "while" para identificar los puntos inferiores del gráfico. Se implementa la búsqueda de los puntos de referencia superiores del mismo modo.
//start counting from the third bar (counted as "0") to be able to "identify the fractal"
TestBar=2;  // number of the bar being tested
NB1=-1; NB2=-1; Extrem=0;   // assume that the numbers of bars and the extremum are not determined
while(((NB1==-1) || (NB2==-1)) && (TestBar<AllB))
  {//w1
// -------------------------------------------------------------------------------------+
//  If: - the Extrem value is smaller than (1)(two possible options are: "0" and "-1"),
//  and the index of the smallest price value coincides with the index of bar under consideration
// -------------------------------------------------------------------------------------+
   if((Extrem<1) && (TestBar==iLowest(Symbol(),Period(),MODE_LOW,B_F*2+1,TestBar-B_F)))
     {//w2
      // if "0" when there was no extremum at that moment,
      if(Extrem==0)
        {//w3
         // assign: the value of (-1) to the identified point of extremum, thus indicating
         // that this is the lower extremum; the number to the determined bar (NB1) and the price value (Pr1).
         Extrem=-1; NB1=TestBar; Pr1=Low[NB1];
        }//-w3
      else  if(Extrem!=0) // the first point was found earlier
                          // otherwise the number and the price value will be assigned to point 2
        {//w4
         NB2=TestBar; Pr2=Low[NB2];
        }//-w4
      // for control purposes, the values can be printed - Print("   bar #= ",NB2," price value= ",Pr2);
     }//-w2
// -------------------------------------------------------------------------------------+
Si sólo se encuentra un punto, las condiciones seguirán siendo verdaderas y el operador seguirá hacia los extremos superiores. Si no se encuentran dos puntos superiores, significa que en este momento no existen puntos para crear un canal.
if((NB1==-1) || (NB2==-1)) // no datum points are found on the last AllB bars
Con dos puntos de referencia calculamos la tasa de cambio del precio:
RatePr=(Pr2-Pr1)/(NB2-NB1);
Después encontramos el primer punto de referencia de la línea del canal que es una proyección del primer punto de referencia en la barra "0".
double Tk1=Pr1-NB1*RatePr;
El segundo punto de referencia de la línea del canal se encuentra en el rango visible del lado izquierdo del gráfico, por ejemplo, 50 barras a la izquierda del segundo punto de referencia.
double Tk2=Tk1+(NB2+50)*RatePr;
Ahora vamos a dibujar la línea opuesta del canal que es paralela a la línea establecida:
Par encontrar el tercer punto de referencia, probaremos las barras que se encuentran entre los dos otros puntos de referencia, desde NB1 a NB2 (o desde "0" a NB2 y desde la segunda barra a NB2). Se hará la prueba en base a los extremos superiores que se encuentran en la dirección opuesta a los puntos encontrados. Por ejemplo, si los puntos están en los máximos del gráfico se hará la prueba de las barras en base a los mínimos. Después de encontrar el tercer punto de referencia, se definen los otros dos puntos de la línea opuesta del canal en el mismo segmento.
El siguiente código incluye comentarios detallados.
// Plot the opposite channel line parallel to the determined line.
// Find the datum point for the opposite channel line:
// Take the minimum price of the 2nd bar as the origin of search.
Tk3=Low[2]-2*RatePr; // projection of the 2nd bar on the "0" bar
for(i=3;i<=NB2;i++) // start searching from the 3rd bar
  {//2(1)Up
   if(Low[i]<Tk3+i*RatePr) // using the minimum value of the price projection on the "0" bar
     {//3(1)Up
      Tk3=Low[i]-i*RatePr; // third reference point (projection on the "0" bar)
      Pr5=Low[i];          // the third datum point for the lower channel line
      NB5=i;               // number of the bar of the third datum point
     }//-3(1)Up
  }//-2(1)Up
Una vez tenemos el tercer punto de referencia ya podemos dibujar estos tres puntos en el gráfico, después de haber borrado los puntos existentes.
Se proporciona a continuación el código para dibujar los puntos de referencia en el gráfico.
ObjectDelete("Rep1"); ObjectDelete("Rep2"); ObjectDelete("Rep3"); ObjectDelete("Rep5");
   ObjectCreate("Rep1",OBJ_ARROW, 0, TmR1, Pr1+2*space);
      ObjectSet("Rep1", OBJPROP_COLOR, Yellow);
      ObjectSet("Rep1", OBJPROP_ARROWCODE,72);
   ObjectCreate("Rep2",OBJ_ARROW, 0, TmR2, Pr2+2*space);
      ObjectSet("Rep2", OBJPROP_COLOR, Yellow);
      ObjectSet("Rep2", OBJPROP_ARROWCODE,72);
   ObjectCreate("Rep5",OBJ_ARROW, 0, TmR5, Pr5-space);
      ObjectSet("Rep5", OBJPROP_COLOR, Yellow);
      ObjectSet("Rep5", OBJPROP_ARROWCODE,71);
  ObjectDelete("Cross2");
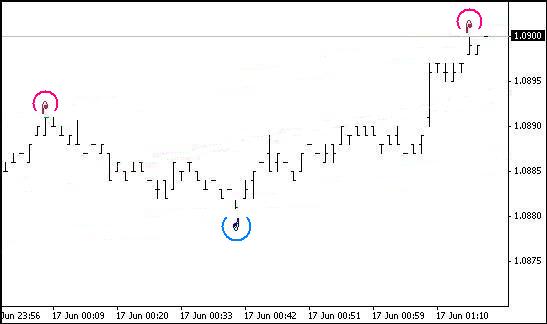
Como resultado, debe ser capaz de ver las etiquetas encima o debajo de los puntos de referencia en el gráfico (ver la siguiente figura).
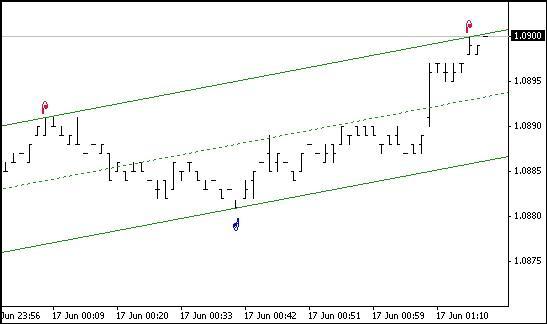
Después de haber determinado tres puntos de referencia y cuatro puntos de la línea del canal podemos dibujarlas en el gráfico:
DelObj1();
ObjectCreate("Tr1",OBJ_TREND,0,Tm2,Tk2,Tm1,Tk1);
  ObjectSet("Tr1",OBJPROP_COLOR,Lime);
  ObjectSet("Tr1",OBJPROP_WIDTH,1); //2
  ObjectSet("Tr1",OBJPROP_STYLE,STYLE_SOLID);
ObjectCreate("Tr2",OBJ_TREND,0,Tm2,Tk4,Tm1,Tk3);
  ObjectSet("Tr2",OBJPROP_COLOR,Lime);
  ObjectSet("Tr2",OBJPROP_WIDTH,1); //2
  ObjectSet("Tr2",OBJPROP_STYLE,STYLE_SOLID);
ObjectCreate("Med",OBJ_TREND,0,Tm2,(Tk2+Tk4)/2,Tm1,(Tk1+Tk3)/2);
  ObjectSet("Med",OBJPROP_COLOR,Lime);
  ObjectSet("Med",OBJPROP_WIDTH,1);
  ObjectSet("Med",OBJPROP_STYLE,STYLE_DOT);
Vamos a calcular los valores medios y los límites del canal en las 6 últimas barras:
for(int i=0;i<6;i++)
  {
   TLUp_[i]=Tk1+i*RatePr;
   TLDn_[i]=Tk3+i*RatePr;
   Med_[i]=(TLUp_[i]+TLDn_[i])/2;
  }
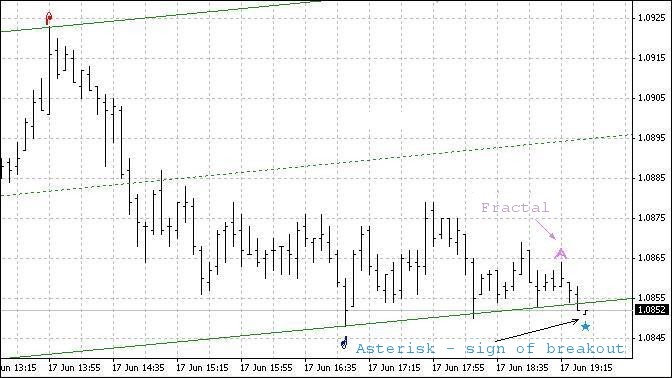
Si el precio cruza la línea del canal ponemos un asterisco y añadimos una notificación sonora:
if(Bid>TLUp_[0])
  {
   bool TrUp=true; //bool TrDn=false;
   ObjectDelete("Cross1");  ObjectDelete("Cross2");
   ObjectCreate("Cross1",OBJ_ARROW,0,Tm1,High[1]+2*space);
   ObjectSet("Cross1",OBJPROP_COLOR,DeepPink);
   ObjectSet("Cross1",OBJPROP_ARROWCODE,171);
   PlaySound("alert.wav"); // The file must be located under terminal_directory\sounds
  }
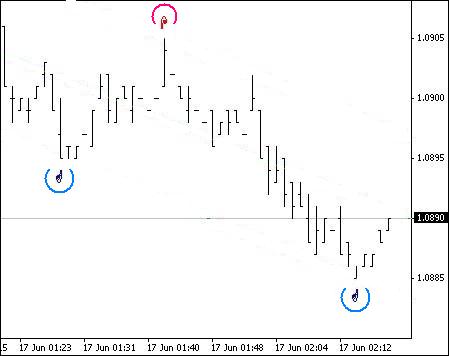
Si se ha formado un fractal en las últimas barras, lo marcamos en el gráfico:
ObjectDelete("Fraktal"+(q-1));  //ObjectDelete("Frakt"+(w-1));
ObjectCreate("Fraktal"+q,OBJ_ARROW, 0, Time[2], High[2]+2*space+0.0002);
ObjectSet   ("Fraktal"+q, OBJPROP_COLOR, Orchid);
ObjectSet   ("Fraktal"+q, OBJPROP_ARROWCODE,217);
En cuanto a la creación del canal, sólo hemos visto algunas características y fragmentos del programa.
Vamos a comentar ahora la posibilidad de hacer trading en este canal.
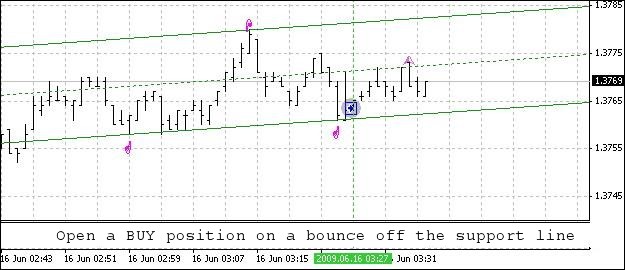
Supongamos que el canal es ascendente y que la barra actual se dirige hacia abajo y está muy cerca del límite inferior del canal o lo ha cruzado. en este caso, el comportamiento del precio puede ser el siguiente:
- el precio vuelve a subir hacia arriba antes de alcanzar el límite inferior;
- el precio alcanza el límite inferior y vuelve a subir;
- el precio cruza el límite inferior del canal y vuelve a subir;
- después de haber cruzado el límite inferior, el precio sigue bajando (ruptura hacia abajo).
Cuando hablamos aquí de cruzar el límite inferior por una barra nos referimos al mínimo de la barra.
A simple vista, los tres primeros patrones de movimiento del precio son favorables a la apertura de una posición de compra (BUY). Vamos a echarles un vistazo. Hay que recordar que el canal en este Asesor Experto se ha construido en base a los fractales formados. Por lo tanto, existe la posibilidad de que el canal cambie su dirección después de la formación de un fractal, es decir, en las tres últimas barras y se debe tener en cuenta.
Repasemos el primer patrón. En este caso, la barra que viene después de la barra con el mínimo se abrirá por encima del mínimo de la barra anterior. Y el mínimo de la tercera (contando de izquierda a derecha) barra será también superior al mínimo de la primera barra. Así que la barra 3 (contando de derecha a izquierda, es decir desde la barra 0) es el valor mínimo para la formación del fractal. Y si no cambia la dirección ascendente del canal podemos abrir una posición de compra (BUY).
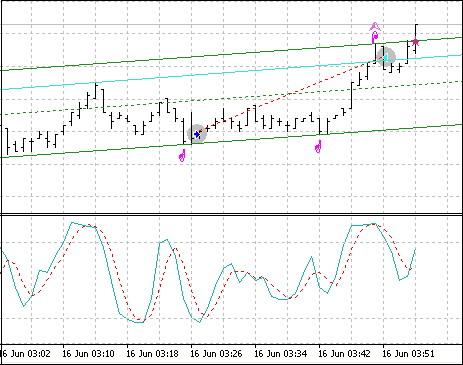
Veamos ahora el cambio de dirección del canal. Si se ha trazado el canal en base a los puntos de referencia inferiores, la dirección del canal no cambiará ya que el punto mínimo del fractal estará por encima de la línea inferior del canal.
Si se ha trazado el canal en base a los puntos de referencia superiores, la dirección seguirá siendo la misma. La pregunta que surge del primer patrón es la siguiente: ¿qué diferencia puede considerarse suficiente entre el límite inferior del canal y el valor mínimo del fractal formado junto a este límite? Esta cantidad depende principalmente del tamaño del canal.
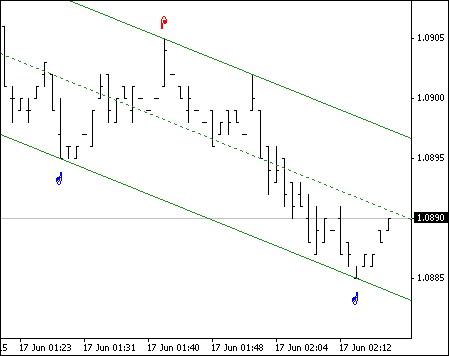
El tercer patrón de movimiento del precio suele dar lugar al cambio de la pendiente del canal y algunas veces al cambio de su dirección al formarse un fractal debajo del límite inferior del canal. Si el canal fue creado en base a los mínimos de los dos puntos de referencia mientras que el mínimo del fractal formado resulta ser inferior al primer punto de referencia y superior al segundo punto de referencia, cambiará la pendiente del canal pero su dirección seguirá siendo hacia arriba.
Si el valor mínimo del fractal formado es inferior al segundo punto de referencia, la dirección del canal será hacia abajo. Ocurre lo mismo con las posiciones de venta (SELL), pero en la dirección contraria. Se presentan a continuación unos ejemplos de trading mediante este Asesor Experto.
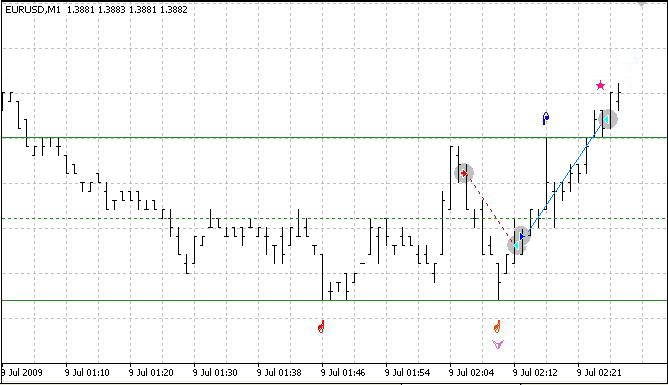
Podemos encontrar un ejemplo de condiciones de apertura y cierre de posiciones en los bloques de apertura de órdenes y de seguimiento de posiciones. Resultados de la prueba:
Se proporciona a continuación el código completo del código:
//+------------------------------------------------------------------+
//|                                             Expert_Ch_v83_2_.mq4 |
//|                                            2009, author - Genkov |
//|                                                     Genkov@bk.ru |
//+------------------------------------------------------------------+
#property copyright "2009, author - Genkov"
#property link      "Genkov@bk.ru"
//+------------------------------------------------------------------+
extern double SL_B=200;
extern double TP_B=50;
extern double SL_S=200;
extern double TP_S=50;
extern double Lots=1.0;
double TrailingStop=40;
int Magic,i;
extern int AllB=240;        // number of bars for calculations
int TestBar=0;              // index of the bar being tested
double RatePr=0;            // rate of price change - pips/bars
int NB1=-1,NB2=-1,NB3,NB5;  // numbers of bars of datum points
int Extrem=0;               // indices of the points of extremum:
/* Extrem = (0)  - fractal not found,
     Extrem = (1)  - upper fractal found, (any positive number)
     Extrem = (-1) - lower fractal found   (any negative number)
  */
double Pr1=0,Pr2=0,Pr3,Pr5,// prices of datum bars with fractals
Tk1,Tk2,Tk3,Tk4,Tk5; // prices of reference points for plotting the channel lines
double space;               // distance from the price to the "arrow"
double TLUp_[10],TLDn_[10],// values of channel boundaries
Med_[10];
int B_F=0;                  // number of bars for fractals in a period
datetime Tm1,Tm2,Tm3,Tm5;   // time of bars of reference points
string SH;                  // channel slope
bool FraktUp=false;         // flag of the upper fractal mark
bool FraktDn=false;         // flag of the lower fractal mark
int q,w;
//+------------------------------------------------------------------+

//+------------------------------------------------------------------+
void DelObj1()
  {
   ObjectDelete("Tr1");
   ObjectDelete("Tr2");
   ObjectDelete("Med");
  }
//+------------------------------------------------------------------+
void Op_Sell_Ch()
  {
   if(!OrderSend(Symbol(),OP_SELL,Lots,Bid,2,Ask+SL_S*Point,Bid-TP_S*Point," ",Magic,0,Red))
     { Print("  Error when opening a SELL order  # ",GetLastError()); }
   return(0);
  }
//+------------------------------------------------------------------+
void Op_Buy_Ch()
  {
   if(!OrderSend(Symbol(),OP_BUY,Lots,Ask,2,Bid-SL_B*Point,Ask+TP_B*Point," ",Magic,0,Blue))
     { Print("  Error when opening a SELL order  # ",GetLastError()); }
   return(0);
  }
//+------------------------------------------------------------------+
void Close_B_lot()
  {
   if(!OrderClose(OrderTicket(),OrderLots(),Bid,2,HotPink)) // closing 0.1 lot
     {
      Print(" Closed order #= ",OrderTicket(),"Error #= ",GetLastError());
      RefreshRates();
     }
  }
//+------------------------------------------------------------------+
void Close_S_lot()
  {
   if(!OrderClose(OrderTicket(),OrderLots(),Ask,2,Aqua)) // closing 0.1 lot
     {
      Print(" Closed order #= ",OrderTicket(),"Error #= ",GetLastError());
      RefreshRates();
     }
  }
// ===================================================================+
int start()
  {
   int StopLevel=MarketInfo(Symbol(),MODE_STOPLEVEL);
// number of bars for fractal search by periods
   switch(Period())
     {
      case 1:     B_F=12; space=0.0002; break;
      case 5:     B_F=48; space=0.0003; break;
      case 15:    B_F=24; space=0.0004; break;
      case 30:    B_F=24; space=0.0004; break;
      case 60:    B_F=12; space=0.0007; break;
      case 240:   B_F=15; space=0.0012; break;
      case 1440:  B_F=10; space=0.0030; break;
      case 10080: B_F=6;  space=0.0040; break;
     }
// ====================================================================================+
// create a channel:
//start counting from the third bar (counted as "0") to be able to "identify the fractal"
   TestBar=2;  // number of the bar being tested
   NB1=-1; NB2=-1; Extrem=0;   // assume that the numbers of bars and the extremum are not determined
   while(((NB1==-1) || (NB2==-1)) && (TestBar<AllB))
     {//w1
      // -------------------------------------------------------------------------------+
      //  If: - the Extrem value is smaller than (1)(two possible options are: "0" and "-1"),
      //  and the index of the smallest price value coincides with the index of bar under consideration
      // -------------------------------------------------------------------------------+
      if((Extrem<1) && (TestBar==iLowest(Symbol(),Period(),MODE_LOW,B_F*2+1,TestBar-B_F)))
        {//w2
         // if "0" when there was no extremum at that moment,
         if(Extrem==0)
           {//w3
            // assign: the value of (-1) to the identified point of extremum, thus indicating
            // that this is the lower extremum; the number to the determined bar (NB1) and the price value (Pr1).
            Extrem=-1; NB1=TestBar; Pr1=Low[NB1];
           }//-w3
         else  if(Extrem!=0) // the first point was found earlier
                             // otherwise the number and the price value will be assigned to point 2
           {//w4
            NB2=TestBar; Pr2=Low[NB2];
           }//-w4
         // for control purposes, the values can be printed - Print("   bar #= ",NB2," price value= ",Pr2);
        }//-w2
      // -------------------------------------------------------------------------------+
      //  If: - the Extrem value is greater than (-1)(possible options are: 0 and 1), and the index of the highest price
      //  value coincides with the number of the bar under consideration - (similar to the above)
      // -------------------------------------------------------------------------------+
      if((Extrem>-1) && (TestBar==iHighest(Symbol(),Period(),MODE_HIGH,B_F*2+1,TestBar-B_F)))
        {//w5
         // if Extrem==0
         if(Extrem==0)
           {//w6
            // store the bar number (NB1) and the price value (Pr1).
            Extrem=1; NB1=TestBar; Pr1=High[NB1];
           }//-w6
         else // otherwise the number and the price value will be assigned to point 2
           {//w7
            NB2=TestBar; Pr2=High[NB2];
           }//-w7
        }//-w5
      TestBar++;
     }//-w1
// -----------------------------------------------------------------------------------+
   if((NB1==-1) || (NB2==-1)) // no datum points found on the last AllB bars
     {
      DelObj1(); ObjectDelete("Cross1"); ObjectDelete("Cross2");  ObjectDelete("Rep1");
      ObjectDelete("Rep2"); ObjectDelete("Rep3"); ObjectDelete("Rep5");
      // Print(" === > no bars for the channel "); // for control purposes only (can be deleted)
      return(-1);
     }
// ---------------------------------
// Calculate the rate of price change.
   RatePr=(Pr2-Pr1)/(NB2-NB1);
// if the value is positive, we are dealing with a downward channel, otherwise - upward.
   if(RatePr>0) SH="downward"; else  SH="upward";
// determine the time of datum points for the channel lines
   Tm1=Time[0];    Tm2=Time[NB2+50];
// **************************************************************************************
   if(Extrem==1) // if a higher extremum has been found first
     {//1(Extrem=1)
      // with two datum points and the rate of price change available,
      // determine reference points of this line:
      // the first reference point is the projection of the datum point on the "0" bar
      double Tk1=Pr1-NB1*RatePr;
      // the second reference point is the projection on the left-hand side of the chart
      double Tk2=Tk1+(NB2+50)*RatePr;
      // Plot the opposite channel line parallel to the determined line.
      // Find the datum point for the opposite channel line:
      // Take the minimum price of the 2nd bar as the origin of search.
      Tk3=Low[2]-2*RatePr; // projection of the 2nd bar on the "0" bar
      for(i=3;i<=NB2;i++) // start searching from the 3rd bar
        {//2(1)Up
         if(Low[i]<Tk3+i*RatePr) // using the minimum value of the price projection on the "0" bar
           {//3(1)Up
            Tk3=Low[i]-i*RatePr; // third reference point (projection on the "0" bar)
            Pr5=Low[i];          // the third datum point for the lower channel line
            NB5=i;               // number of the bar of the third datum point
           }//-3(1)Up
        }//-2(1)Up
      // now take a look at the first two bars: "0" and "1"; their Min values may turn out to be lower than the 2nd bar
      // if we consider adjustment of the channel using these two bars, the channel will be
      // becoming wider following the downward price movement; if this is ignored, the downward price movement
      // can be considered as the channel line breakout (possible beginning of the trend!)
      // if(Low[0]<Tk3) {Tk3=Low[0]; Pr5=Low[0]; NB5=0;}
      // if(Low[1]<Tk3+RatePr) {Tk3=Tk3+RatePr; Pr5=Low[1]; NB5=1;}
      datetime TmR1=Time[NB1];    datetime TmR2=Time[NB2];   datetime TmR5=Time[NB5];
      // -------------------------------------------------------------------------------------
      // the following operators are intended for visual control of the program performance only (they can be deleted)
      // and display the channel slope value, speed rate, numbers and time of the datum points at Extrem=1
      string TNB1=TimeToStr(TmR1,TIME_DATE|TIME_MINUTES);
      string TNB2=TimeToStr(TmR2,TIME_DATE|TIME_MINUTES);
      string TNB5=TimeToStr(TmR5,TIME_DATE|TIME_MINUTES);
      //   Print(" channel- ",SH," ; speed = ",DoubleToStr(NormalizeDouble(RatePr,8),8),
      //         " pip / bar"," ; Extrem= ",Extrem);
      //   Print(" NB2= ",NB2," ; time= ",TNB2," ; NB5= ",NB5,
      //         " ; time= ",TNB5," ; NB1= ",NB1," ; time= ",TNB1);
      // --------------------------------------------------------------------------------------
      // for clarity of the program performance, mark the datum points on the channel lines in the chart
      ObjectDelete("Rep1"); ObjectDelete("Rep2"); ObjectDelete("Rep3"); ObjectDelete("Rep5");
      ObjectCreate("Rep1",OBJ_ARROW,0,TmR1,Pr1+2*space);
      ObjectSet("Rep1",OBJPROP_COLOR,Yellow);
      ObjectSet("Rep1",OBJPROP_ARROWCODE,72);
      ObjectCreate("Rep2",OBJ_ARROW,0,TmR2,Pr2+2*space);
      ObjectSet("Rep2",OBJPROP_COLOR,Yellow);
      ObjectSet("Rep2",OBJPROP_ARROWCODE,72);
      ObjectCreate("Rep5",OBJ_ARROW,0,TmR5,Pr5-space);
      ObjectSet("Rep5",OBJPROP_COLOR,Yellow);
      ObjectSet("Rep5",OBJPROP_ARROWCODE,71);
      ObjectDelete("Cross2");
      // -------------------------------------------------------------------------------------
      // calculate prices for coordinates of reference points on the lower channel boundary:
      double Tk3=Pr5-RatePr*NB5; // price of the lower channel boundary in the "0" point
      double Tk4=Tk3+RatePr*(NB2+50);// price of the lower channel boundary in the left-hand side of the chart
     }//- 1(Extrem=1)
// ******************************************************************************************
   else  if(Extrem==-1)// if a lower extremum has been found first
     {//1(Extrem= -1)
                                     // prices of reference points on the lower channel boundary:
      Tk3=Pr1-NB1*RatePr;      // in the "0" point
      Tk4=Tk3+(NB2+50)*RatePr; // in the left-hand side point
                               // Plot the opposite channel line parallel to the determined line.
      // Find the datum point for the opposite channel line.
      // Take the price of the 2nd bar as the origin of search.
      Tk1=High[2]-2*RatePr; // projection of the 2nd bar on the "0" bar
      for(i=3;i<=NB2;i++) // start searching from the 3rd bar
        {//2(-1)
         if(High[i]>Tk1+i*RatePr)
           {//3(-1)
            Tk1=High[i]-i*RatePr; // the third reference point (projection on the "0" bar)
            Pr3=High[i];          // the third datum point for the upper channel line
            NB3=i;                // number of the bar of the third datum point
           }//-3(-1)
         // now take a look at the first two bars: "0" and "1"
         // if(High[0]>Tk1) {Tk1=High[0]; Pr3=High[0]; NB3=0;}
         // if(High[1]>Tk1+RatePr) {Tk1=Tk1+RatePr; Pr3=High[1]; NB3=1;}
         TmR1=Time[NB1];    TmR2=Time[NB2];   datetime TmR3=Time[NB3];
        }//- 2(-1)
      // ---------------------------------------------------------------------------------
      // add the following operators to monitor the performance results
      //(they do not affect the program performance and can be deleted),
      // they display the channel (speed) slope value, speed rate, as well as numbers
      // and time of the datum points at Extrem = -1
      // TNB1=TimeToStr(TmR1,TIME_DATE|TIME_MINUTES);
      // TNB2=TimeToStr(TmR2,TIME_DATE|TIME_MINUTES);
      // string TNB3=TimeToStr(TmR3,TIME_DATE|TIME_MINUTES);
      // Print(" channel- ",SH," ; price speed rate= ",DoubleToStr(NormalizeDouble(RatePr,8),8),
      //       " pip / bar"," ; Extrem= ",Extrem);
      // Print(" ; NB2= ",NB2," ; time= ",TNB2," ; NB3= ",NB3,
      //       " ; time= ",TNB3," ; NB1= ",NB1," ; time= ",TNB1);
      // ----------------------------------------------------------------------------------
      // for clarity, mark the datum points on the channel lines in the chart
      ObjectDelete("Rep1"); ObjectDelete("Rep2");
      ObjectDelete("Rep3"); ObjectDelete("Rep5");
      ObjectCreate("Rep1",OBJ_ARROW,0,TmR1,Pr1-space);
      ObjectSet("Rep1",OBJPROP_COLOR,Yellow);
      ObjectSet("Rep1",OBJPROP_ARROWCODE,71);
      ObjectCreate("Rep2",OBJ_ARROW,0,TmR2,Pr2-space);
      ObjectSet("Rep2",OBJPROP_COLOR,Yellow);
      ObjectSet("Rep2",OBJPROP_ARROWCODE,71);
      ObjectCreate("Rep3",OBJ_ARROW,0,TmR3,Pr3+2*space);
      ObjectSet("Rep3",OBJPROP_COLOR,Yellow);
      ObjectSet("Rep3",OBJPROP_ARROWCODE,72);
      ObjectDelete("Cross1");
      // ---------------------------------------------------------------------------------
      // calculate prices of the reference points on the upper channel boundary:
      Tk1=Pr3-RatePr*NB3; // price of the upper channel boundary in the "0" point
      Tk2=Tk1+RatePr*(NB2+50);// price of the upper channel boundary in the left-hand side point
     }//-1(Extrem= -1)
// ---------------------------------======================================================
// calculate the median values of the channel and channel boundaries on the last 6 bars
   for(int i=0;i<6;i++)
     {
      TLUp_[i]=Tk1+i*RatePr;
      TLDn_[i]=Tk3+i*RatePr;
      Med_[i]=(TLUp_[i]+TLDn_[i])/2;
     }
// --------------------------------------------------------------------
//If the price has crossed the upper channel line, mark it with an asterisk and add a sound notification
   if(Bid>TLUp_[0])
     {
      bool TrUp=true; //bool TrDn=false;
      ObjectDelete("Cross1");  ObjectDelete("Cross2");
      ObjectCreate("Cross1",OBJ_ARROW,0,Tm1,High[1]+2*space);
      ObjectSet("Cross1",OBJPROP_COLOR,DeepPink);
      ObjectSet("Cross1",OBJPROP_ARROWCODE,171);
      PlaySound("alert.wav"); // The file must be located under terminal_directory\sounds
     }
//If the price has crossed the lower channel line, mark it with an asterisk and add a sound notification
   if(Bid<TLDn_[0])
     {
      ObjectDelete("Cross2");  ObjectDelete("Cross1");
      /// Print(" there was a crossover of the lower channel line ");
      ObjectCreate("Cross2",OBJ_ARROW,0,Tm1,Low[1]-space);
      ObjectSet("Cross2",OBJPROP_COLOR,DodgerBlue);
      ObjectSet("Cross2",OBJPROP_ARROWCODE,171);
      PlaySound("alert.wav"); // The file must be located under terminal_directory\sounds
     }
// -------------------------------------------------------------------------------------
// plot the channel boundaries in the chart, having deleted the existing ones beforehand
   DelObj1();
   ObjectCreate("Tr1",OBJ_TREND,0,Tm2,Tk2,Tm1,Tk1);
   ObjectSet("Tr1",OBJPROP_COLOR,Lime);
   ObjectSet("Tr1",OBJPROP_WIDTH,1); //2
   ObjectSet("Tr1",OBJPROP_STYLE,STYLE_SOLID);
   ObjectCreate("Tr2",OBJ_TREND,0,Tm2,Tk4,Tm1,Tk3);
   ObjectSet("Tr2",OBJPROP_COLOR,Lime);
   ObjectSet("Tr2",OBJPROP_WIDTH,1); //2
   ObjectSet("Tr2",OBJPROP_STYLE,STYLE_SOLID);
   ObjectCreate("Med",OBJ_TREND,0,Tm2,(Tk2+Tk4)/2,Tm1,(Tk1+Tk3)/2);
   ObjectSet("Med",OBJPROP_COLOR,Lime);
   ObjectSet("Med",OBJPROP_WIDTH,1);
   ObjectSet("Med",OBJPROP_STYLE,STYLE_DOT);
// ---- Block of marking fractals in the chart ---------------------------------
   if((High[2]>High[1] && Bid<High[2] && High[2]>High[3] && High[2]>High[4]) ||
      (High[2]==High[1] && Bid<High[1] && High[2]>High[3] && High[2]>High[4]))
     {
      double FraktalUp=High[2]; // upper fractal
      double FraktalDn=0;
      // if the fractal has formed, put a mark, and if this fractal caused
      // a new datum point - delete the mark for the crossover of the upper channel line by the price.
      if(High[2]>=TLUp_[i]) ObjectDelete("Cross1");
      ObjectDelete("Fraktal"+(q-1));  //ObjectDelete("Frakt"+(w-1));
      ObjectCreate("Fraktal"+q,OBJ_ARROW,0,Time[2],High[2]+2*space+0.0002);
      ObjectSet("Fraktal"+q,OBJPROP_COLOR,Orchid);
      ObjectSet("Fraktal"+q,OBJPROP_ARROWCODE,217);
      bool FraktUp=true; //bool FraktDn=false;// it will be useful when trading
      q++;
     }
   if((Low[2]<Low[1] && Bid>Low[2] && Low[2]<Low[3] && Low[2]<Low[4]) ||
      (Low[2]==Low[1] && Bid>Low[1] && Low[2]<Low[3] && Low[2]<Low[4]))
     {
      FraktalDn=Low[2]; // lower fractal
      FraktalUp=0;
      if(Low[2]>=TLUp_[i]) ObjectDelete("Cross2");
      ObjectDelete("Frakt"+(w-1)); //ObjectDelete("Fraktal"+(q-1));
      ObjectCreate("Frakt"+w,OBJ_ARROW,0,Time[2],Low[2]-2*space);
      ObjectSet("Frakt"+w,OBJPROP_COLOR,Orchid);
      ObjectSet("Frakt"+w,OBJPROP_ARROWCODE,218);
      FraktDn=true; FraktUp=false;
      w++;
     }
// ---------------------------------------------------------------+
// Block of position opening conditions.   This is just an example  +
// and it should not be deemed a recommendation for use!+
// ---------------------------------------------------------------+
   if(OrdersTotal()<1) // trade one position
     {
      // - 16- SELL ---
      if(Extrem==1 && // two upper datum points
         RatePr>0 && // channel directed downwards
         (Tk1-Tk3)>20*Point && // channel size > 20pip
         Bid<High[1] && // the price is lower than the previous bar
         (TLUp_[1]-High[1])<3*Point) // the first bar is within 3pip from the upper channel line
        {
         Print(" Open - 16-SELL === ");
         //   SL_S=50;
         //   if(SL_S<StopLevel) SL_S=StopLevel;
         //   TP_S=80;
         Op_Sell_Ch();
         return(0);
        }
      // - 18- BUY ---
      if(Extrem==-1 && // two lower datum points
         RatePr<0 && // channel directed upwards
         (Tk1-Tk3)>20*Point && // channel size > 20pip
         Bid>Low[1] && // the price is higher than the previous bar
         (Low[1]-TLDn_[1])<3*Point) // the 1st bar is within 3pip from the lower channel line
        {
         Print(" Open - 18-BUY === ");
         //    SL_B=50;
         //    if(SL_B<StopLevel) SL_B=StopLevel;
         //    TP_B=80;
         Op_Buy_Ch();
         return(0);
        }
     }
//------------------------------------------------------------------------+
// Tracking open SELL positions                                    |
//+=======================================================================+
   for(i=OrdersTotal()-1;i>=0;i--) // SELL order selection loop
     {//1-position selection loop
      if(!OrderSelect(i,SELECT_BY_POS,MODE_TRADES))
        {Print("Order selection error = ",GetLastError()); }
      if(OrderType()==OP_SELL) // if there is an open Sell order
        { //2-type_Sell
         if((FraktalDn<=TLDn_[2] ||
            Low[2]<=TLDn_[2]) &&
            (Bid>Low[1] && Low[1]<=TLDn_[1]) &&
            (OrderOpenPrice()-Bid)*Point>0) // not at a loss!
           {//5
            Print(" close by the lower channel line ");
            Close_S_lot();
            // and if the channel is directed upwards
            if(RatePr<0)
              {
               Print(" Open a Buy position ");
               Op_Buy_Ch();
              }
           }//-5
        }//-2 type_Sell
      //------------------------------------------------------------------------+
      // Tracking open BUY positions                   |
      //+=======================================================================+
      else
      if(OrderType()==OP_BUY) // if there is an open Buy order
        { //4-type_Buy
         if((FraktalUp>=TLUp_[2] ||
            High[2]>=TLUp_[2]) &&
            // If the channel is created based on the lower datum points and is directed upwards,
            // while the price has crossed the upper boundary,  and is about to move down,
            //bar "1" was higher than bar "0" and higher than bar "2" which was situated on the upper channel line,
            // this looks like the upper fractal formation and channel size increase.
            // At the same time, Stochastic is above 80.0
            // and it starts going down to cross the signal line.
            // So we should not expect bar "0" to get fully formed as it is highly likely
            // that the price will go down. Therefore close the BUY position.
            (Bid<High[1] && High[1]>=TLUp_[1]) &&
            (Ask-OrderOpenPrice())*Point>0) // not at a loss!
           {//5
            Print(" close by the upper channel line ");
            Close_B_lot();
            // and if the channel is directed downwards
            if(RatePr>0)
              {
               Print(" Open a Sell position ");
               Op_Sell_Ch();
              }
           }//-5
        }//-4-type_Buy
     }//-1 position selection loop
//----------------
   return(0);
  }
//+------------------------------------------------------------------+
Conclusión
Creo que la pregunta sobre la posibilidad de hacer trading en el canal debe tener una respuesta positiva. Estoy deseando recibir cualquier comentario crítico para seguir perfeccionando el Asesor Experto. Espero también que mi experiencia será útil no sólo para los traders principiantes.