• Information
10+ years
experience
58
products
32
demo versions
0
jobs
0
signals
0
subscribers
ALL PRODUCTS ➤➤➤ https://www.mql5.com/en/users/zombiezorrofx/seller

Telegram channel ➤➤➤ @sft_official ( https://t.me/sft_official )
__________________________________
Recommended Forex Broker ➤ https://sureforextrading.ru/rekomenduemye-foreks-brokery/
USEFUL FOREX NEWSLETTER ➤ https://www.subscribepage.com/InfoTradingGo
__________________________________
Blog - https://sureforextrading.ru
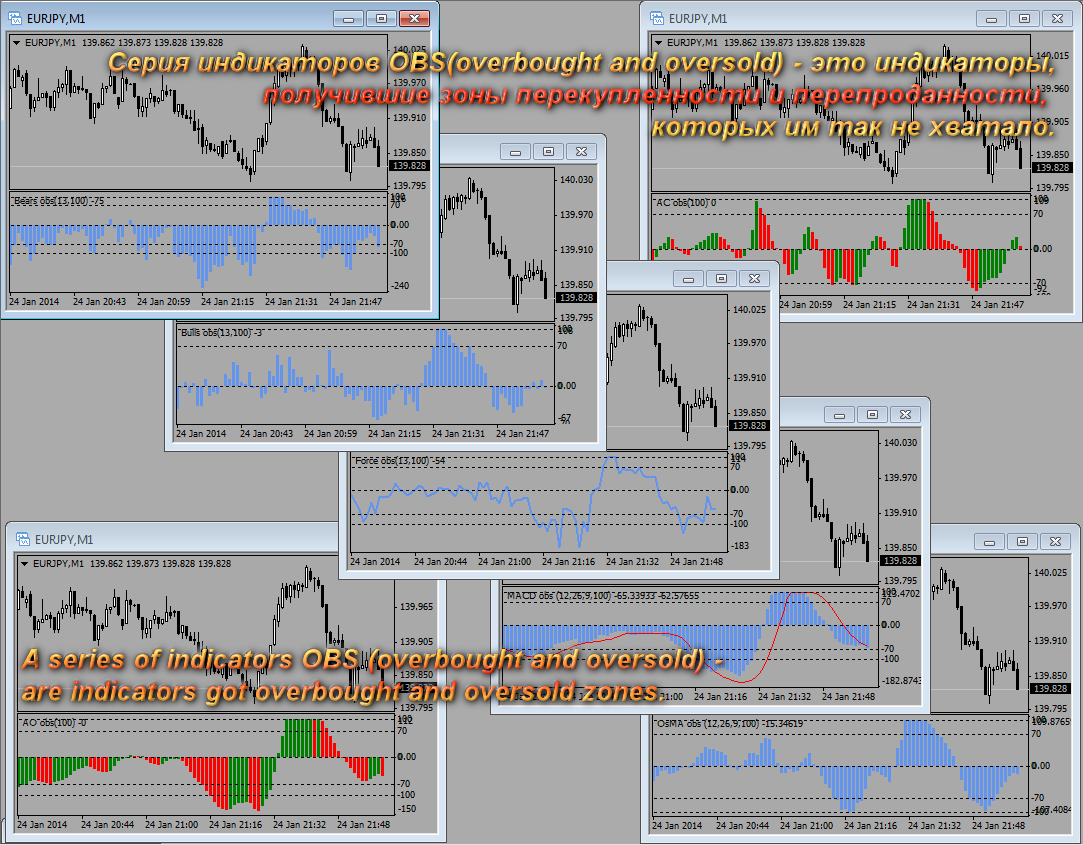
Make available professional software for forex trading
Trading Software - Indicators, Signals, EA's, Trading systems for a confident and profitable trade.
#SFT #sureforextrading #zombiezorrofx
Artem Kuzmin Published product

The support and resistance levels are among the main components of the entire technical analysis. They are used both by professional traders and by beginners. Prices usually move within the price channels. The upper boundary of such a channel is called resistance, and the lower one is support. This indicator plots fractal support and resistance lines at the highest and lowest local price values (fractals). Distinctive features Does not redraw. Clear and understandable signals. It is possible to

Artem Kuzmin
SFT Fractal Support and Resistance https://mql5.com/3gjtw The levels of support and resistance are one of the main components of all technical analysis. They are used both by professional traders and by beginners...
Artem Kuzmin Published product

This is a moving average which can move not only to the right/left, but also up/down. You can also select a mode of displaying the indicator (as a line or as dots) and all other settings of a standard moving average. If you overlay several indicators in one window, you can clearlier determine price channels setting each border individually. Settings Line_or_Dot - mode of displaying the indicator: true - as a line, false - as dots; MA_period - moving average period; MA_shift_X - number of candles

Artem Kuzmin Published product

30.00 USD

The indicator colors bars displaying prices of overbought and oversold areas on the chart. It will help you to estimate moments when market climate changes and the price has its local extreme values. It can be used both independently and as a good supplement to any channel trading system. And this indicator is easy-to-use in expert advisors due to usage of indicator buffers instead of graphical objects. Settings ExtPeriod = 100 — indicator period; Sensitivity = 80 — indicator sensitivity

Artem Kuzmin Published product
Reviews: 1
30.00 USD

The indicator is designed for visual determining market directions. It allows to determine the distance from a price and helps in drawing correct conclusions. Perfectly defines flat zones, horizontal intraday trends and trend movements, and an additional setting allows to use the indicator on any instrument. Does not redraw its readings. You get professional trading indicator for a reasonable price. Settings: Period_FF = 7 - indicator period Sensitivity_FF = 5 - sensitivity in % Wish you all

Artem Kuzmin Published product

30.00 USD

This is an indicator for additional signal filtering. It can be used as an additional filter in a trading system. The indicator does not redraw its data and can be used both in forex trading and with binary options. It has 3 operation modes and flexible sensitivity settings. The indicator uses multiple buffers, therefore it can be easily used in various Expert Advisors

Artem Kuzmin Published product

The indicator builds fractals on extrema of the OsMA indicator Appears on the chart as a fractal or a fractal channel. It has a flexible setting and, in contrast to the standard fractals, lags only by 1 bar. Settings: DeepBars - the indicator's depth of display; Sensitivity_1_or_2 - 1 - for small periods of OsMA, 2 - for large periods; Arrow_or_channel - display on the chart fractals or channel; FastMA - period of the fast moving average;  SlowMA - period of slow moving average; 

Artem Kuzmin Published product

30.00 USD

An indicator for entering with trend and timely exiting. It has sensitivity setting, by adjusting which it can be applied to both long-term and short-term speculation.  The highest sensitivity = 1, with this setup, you can even scalp on M1. No lag, does not withdraw after candlestick closure.  One of the use options: enter after a candlestick closes, if the vertical line consists of squares of the same color; exit if the color of two or more squares changes. Before using it, be sure to

Artem Kuzmin Published product

The indicator is based on pair trading methods. It is not redrawn unlike similar indicators. Shows correlation between two selected instruments in percent for a predetermined period, and the positions of the instruments relative to each other. Has a function for reverse display of any of the analyzed symbols - for instruments with negative correlation. Can be drawn as a line or as a histogram. Settings: Symb1 - first symbol name. Revers1 - reverse display of the first symbol. Symb2 - second

Artem Kuzmin Published product

Awesome oscillator with overbought and oversold zones. A series of OBS indicators (overbought and oversold) - these are indicators enhanced with overbought and oversold zones. This makes it possible to determine when the instrument is trending, as well as when it is flat. Works on all timeframes, all currency pairs, metals and cryptocurrencies. Can be used with binary options. Settings OBS Period - period of overbought and oversold calculation

Artem Kuzmin Published product

The indicator calculates critical price levels. If the level is red, the price has passed it downwards; if the level is blue, the price has passed it upwards. If the price is approaching the blue level from below, that level will most probably be broken through. If the price is approaching it from above, there will most probably be a rollback. Similarly, if the price is approaching the red level from above, the level will most probably be broken through. If the price is approaching it from

Artem Kuzmin Published product

Accelerator indicator with overbought and oversold zones. A series of OBS indicators (overbought and oversold) - these are indicators enhanced with overbought and oversold zones. This is the standard indicator, but it provides additional possibilities for the analysis of any market. Thanks to a special algorithm, this indicator has overbought zones =70 and =100, as well as oversold zones -70 and -100, which allows you to use it to determine the possible reversal or pullback of the price, as well

Artem Kuzmin Published product

The Bears indicator with overbought and oversold zones. Two display options - as a line and as a histogram.  A series of OBS indicators (overbought and oversold) - these are indicators enhanced with overbought and oversold zones. This is the standard indicator, but it provides additional possibilities for the analysis of any market. Thanks to a special algorithm, this indicator has overbought zones =70 and =100, as well as oversold zones -70 and -100, which allows you to use it to determine

Artem Kuzmin Published product

The indicator gives signals on trend reversal or the possible direction of price movement when leaving the flat movement. Features and settings: Sensitivity = 3 - sensitivity from 1 to 5; the higher the value, the more signals (example displayed in the screenshot below). DeepBars = 3000 - indicator display depth. ZeroBarCalc = false - use a zero bar in the calculations; if yes, the signal will appear earlier, but it may disappear before the current candlestick is closed. UseAlert = false -

Artem Kuzmin Published product

Bulls indicator with overbought and oversold zones. Two display options - as a line and as a histogram. OBS (overbought and oversold) indicator series - are indicators that have been provided with overbought and oversold zones. This is the standard indicator, but it provides additional possibilities for the analysis of any market. Thanks to a special algorithm, this indicator has overbought zones =70 and =100, as well as oversold zones -70 and -100, which allows you to use it to determine the

Artem Kuzmin Published product

The Force Index indicator with overbought and oversold zones. Two display options - as a line and as a histogram.  A series of OBS indicators (overbought and oversold) - these are indicators enhanced with overbought and oversold zones. Settings OBS Period - overbought/oversold calculation period Force Period - period of Force Price MA - prices for MA calculation Method MA - MA calculation method Line or Histo - display by line or histogram

Artem Kuzmin Published product

The Accumulation indicator with overbought and oversold zones. Two display options - as a line and as a histogram.  A series of OBS indicators (overbought and oversold) - these are indicators enhanced with overbought and oversold zones.  Simple and straightforward settings that are easy to match to the right tool In the indicator, you can adjust: Display depth of the indicator Color of indicator levels

Artem Kuzmin Published product

MTF Moving Averages indicator with overbought and oversold zones. Two display options - as a line and as a histogram. A series of OBS (overbought and oversold) indicators - these are indicators that have been enhanced with overbought and oversold zones. Another feature of this indicator is that the lines of the  indicator s (when analyzing several  indicator s in a single window) are not redrawn relative to each other when scrolling the chart. Settings OBS Period - period of

Artem Kuzmin Published product

Multicurrency indicator Any chart obs is a price chart with a percentage scale. Can be displayed as a line and as a histogram. There is also a reverse function available, it mirrors the chart. The name of an instrument to be displayed is specified in the input parameters, the current symbol is used on default. The indicator doesn't have lags as it is not smoothed with any formulas, but bound to a percentage scale, what allows detecting the price equilibrium, the overbought and oversold state

Artem Kuzmin
Artem Kuzmin
Серия индикаторов OBS (overbought and oversold) - это индикаторы, получившие зоны перекупленности и перепроданности, которых им так не хватало.