Crude Oil, Gold Stalling as SPX 500 Sinks Back to Trend Support
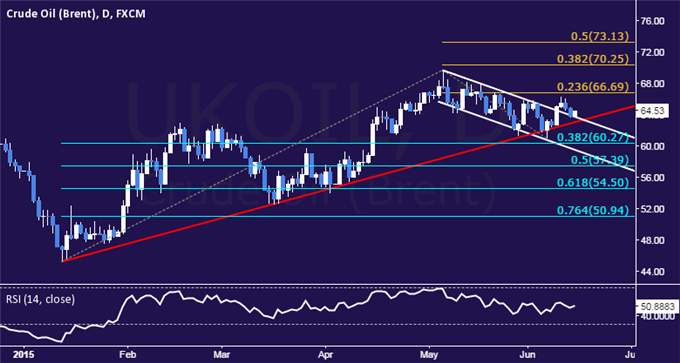
CRUDE OIL TECHNICAL ANALYSIS – Prices may be resuming the recovery launched from mid-January lows after completing a Flag continuation pattern. Near-term resistance is at 66.69, the 23.6% Fibonacci expansion, with a break above that exposing the 38.2% level at 70.25. Alternatively, a move below the 62.93-63.56 area (Flag top resistance-turned-support at, rising trend line) targets the 38.2% Fib retracement at 60.27.
Crude Oil, Gold Stalling as SPX 500 Sinks Back to Trend Support
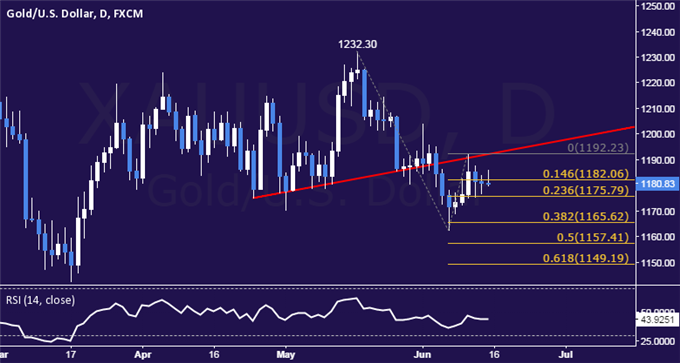
GOLD TECHNICAL ANALYSIS – Prices continue to tread water below the $1200/oz figure. A break below the 23.6% Fibonacci expansion at 1175.79 exposes the 38.2% level at 1165.62. Alternatively, a move above the 14.6% Fib at 1182.06 targets the June 10 high at 1192.23.
Crude Oil, Gold Stalling as SPX 500 Sinks Back to Trend Support
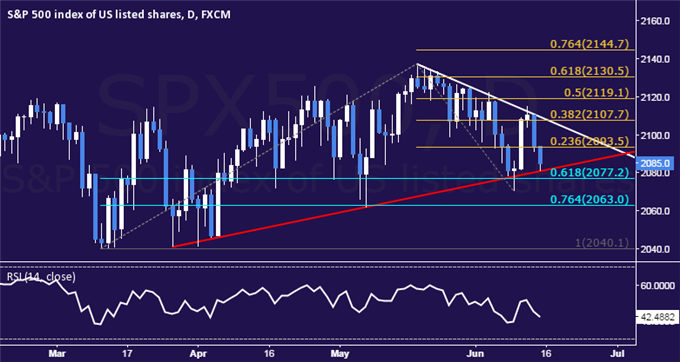
S&P 500 TECHNICAL ANALYSIS – Prices pulled back to test rising trend line support set from late-March lows once again, a barrier reinforced by the 61.8% Fibonacci retracement at 2077.20. A break below that targets the 76.4% level at 2063.00. Alternatively, a turn above the 23.6% Fib expansion at 2093.50 targets the 38.2% threshold at 2107.70.
Crude Oil, Gold Stalling as SPX 500 Sinks Back to Trend Support
Talking Points: US Dollar Treading Water After Hitting Three-Week Low S&P 500 Challenging Rising Trend Support Once Again Crude Oil, Gold Prices Stalling at Familiar Chart Levels
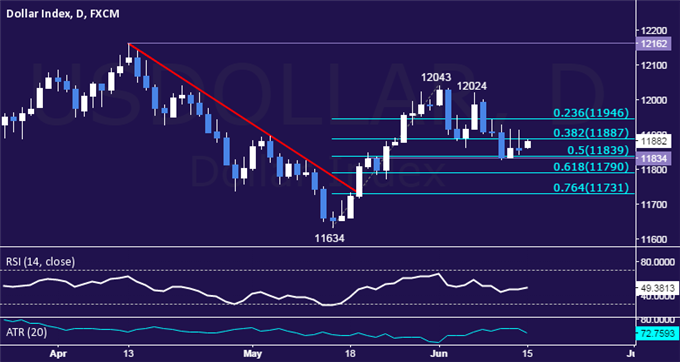
Try the USD basket on Mirror Trader. ** US DOLLAR TECHNICAL ANALYSIS – Prices continues to tread water after sliding to a three-week low last week. A daily close below the 11834-9 area (May 20 close, 50% Fibonacci retracement) exposes the 61.8% level at 11790. Alternatively, a push above the 38.2% Fib at 11887 clears the way for a test of the 23.6% retracement at 11946.
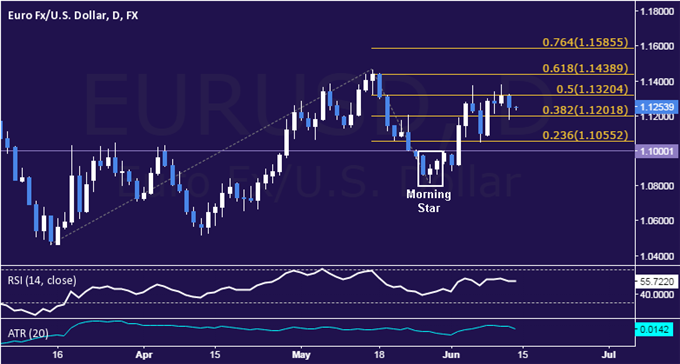
EUR/USD Technical Analysis: Waiting for Cues Above 1.12
Talking Points: EUR/USD Technical Strategy: Flat Support: 1.1202, 1.1005, 1.0818 Resistance:1.1320, 1.1439, 1.1585 The Euro rebounded against the US Dollar as expected having produced a bullish Morning Star candlestick pattern. A daily close above the 50% Fibonacci expansion at 1.1320 exposes the 61.8% level at 1.1439. Alternatively, a turn below the 38.2% Fib at 1.1202 opens the door for a challenge of the 1.1000-55 area (23.6% expansion, horizontal pivot).