selvajose / Profile
Friends
1081
Requests
Outgoing
selvajose

USDOLLAR Sharp Outside Day Reversal from Uptrend Resistance
“The last several July’s have been important for USDOLLAR. An important top registered in July 2013. In 2014 (low was June 30th and rally began on 7/2), an important low formed. The index is not at a trend extreme but it is at an important technical level; the 61.8% retracement of the June decline and slope resistance.” The push above the line that extends off of the April-June high negates anything bearish for now. Watch for support at 11970. A drop below 11918 (treated as the breakout day low) would indicate that this breakout was ‘false’.
“The last several July’s have been important for USDOLLAR. An important top registered in July 2013. In 2014 (low was June 30th and rally began on 7/2), an important low formed. The index is not at a trend extreme but it is at an important technical level; the 61.8% retracement of the June decline and slope resistance.” The push above the line that extends off of the April-June high negates anything bearish for now. Watch for support at 11970. A drop below 11918 (treated as the breakout day low) would indicate that this breakout was ‘false’.

selvajose

USD/CHF Technical Analysis: Franc Gains Most in 2 Weeks
Talking Points:
USD/CHF Technical Strategy: Flat
Support:0.9170, 0.9071, 0.8960
Resistance: 0.9426, 0.9542, 0.9653
The US Dollar turned sharply lower against the Swiss Franc, producing the largest daily decline in two weeks. Near-term rising trend line support is at 0.9170, with a break below that on a daily closing basis exposing the May 7 low at 0.9071. Alternatively, a turn above the June 29 high at 0.9426 clears the way for a test of the May 27 top at 0.9542.

selvajose

EUR/USD Technical Analysis: 1.12 Breaks Despite Down Gap
Talking Points:
EUR/USD Technical Strategy: Flat
Support: 1.1188, 1.1098, 1.1043
Resistance:1.1261, 1.1334, 1.1424
The Euro gapped sharply lower against the US Dollarbut a swift intraday recovery brought prices back above the 1.12 figure. Near-term resistance is at 1.1261, the 50% Fibonacci expansion, with a break above that on a daily closing basis exposing the 61.8% level at 1.1334. Alternatively, a reversal below the 38.2% Fib at 1.1188 clears the way for a test of the 23.6% expansion at 1.1098.

selvajose

USD/JPY Technical Analysis: Range Support Pressured Anew
Talking Points:
USD/JPY Technical Strategy: Flat
Support:122.36, 121.54, 120.52
Resistance:123.18, 124.20, 124.83
The US Dollar declined against the Japanese Yen as expected, sinking back to range support above the 122.00 figure. Near-term support is at 122.36, the 50% Fibonacci retracement, with a break below that on a daily closing basis exposing the 61.8% level at 121.54. Alternatively, a turn above the 38.2% Fibat 123.18 clears the way for a challenge of the 23.6% retracement at 124.20.

selvajose

US Dollar Technical Analysis: Gap Fails to Disturb Range
Talking Points:
US Dollar Technical Strategy: Holding Long via Mirror Trader Basket **
Support: 11829, 11792, 11732
Resistance: 11888, 11937, 11985
The Dow Jones FXCM US Dollar Index advanced as expected after prices put in a bullish Morning Star candlestick pattern. Near-term resistance is at 11888, the 38.2% Fibonacci expansion, with a break above that on a daily closing basis exposing the 50% level at 11937. Alternatively, a move below the 23.6% Fib at 11829 opens the door for a challenge of the 14.6% level at 11792.

selvajose

Crude Oil Breaks 5-Month Uptrend, SPX 500 Drops Most in Over a Year
CRUDE OIL TECHNICAL ANALYSIS – Prices broke support at a rising trend line capping losses since mid-January, hinting the longer-term down trend may be resuming. A break below the 60.27-61.37 area (38.2% Fibonacci retracement, April 22 low) exposes the 50% level at 57.39. Alternatively, a move back above the trend line – now at 63.56 – targets the 23.6% Fib expansion at 66.69.
CRUDE OIL TECHNICAL ANALYSIS – Prices broke support at a rising trend line capping losses since mid-January, hinting the longer-term down trend may be resuming. A break below the 60.27-61.37 area (38.2% Fibonacci retracement, April 22 low) exposes the 50% level at 57.39. Alternatively, a move back above the trend line – now at 63.56 – targets the 23.6% Fib expansion at 66.69.

selvajose

Crude Oil Breaks 5-Month Uptrend, SPX 500 Drops Most in Over a Year
GOLD TECHNICAL ANALYSIS – Prices continue to consolidate above two-month support after failing to hold up above the $1200/oz figure. A break below the 1170.30-86 area (May 1 low, 50% Fibonacci expansion) exposes the 61.8% level at 1162.64. Alternatively, a move above the 38.2% Fib at 1179.07 targets the 23.6% expansion at 1189.24.
GOLD TECHNICAL ANALYSIS – Prices continue to consolidate above two-month support after failing to hold up above the $1200/oz figure. A break below the 1170.30-86 area (May 1 low, 50% Fibonacci expansion) exposes the 61.8% level at 1162.64. Alternatively, a move above the 38.2% Fib at 1179.07 targets the 23.6% expansion at 1189.24.

selvajose

Crude Oil Breaks 5-Month Uptrend, SPX 500 Drops Most in Over a Year
S&P 500 TECHNICAL ANALYSIS – Prices accelerated downward after reversing lower as expected. From here, a break below the 123.6% Fibonacci expansion at 2047.40exposes the 2037.70-2040.10 area (March 11 low, 138.2% level). Alternatively, a reversal above the 100% Fib at 2063.10 targets the 76.4% expansion at 2078.80.
S&P 500 TECHNICAL ANALYSIS – Prices accelerated downward after reversing lower as expected. From here, a break below the 123.6% Fibonacci expansion at 2047.40exposes the 2037.70-2040.10 area (March 11 low, 138.2% level). Alternatively, a reversal above the 100% Fib at 2063.10 targets the 76.4% expansion at 2078.80.

selvajose

Crude Oil Breaks 5-Month Uptrend, SPX 500 Drops Most in Over a Year
Talking Points:
US Dollar Fails to Range Bounds Despite Large Weekend Gap
S&P 500 Accelerates Lower, Posts Largest Drop in 14 Months
Crude Oil Breaks Five-Month Trend, Gold in Familiar Range
Talking Points:
US Dollar Fails to Range Bounds Despite Large Weekend Gap
S&P 500 Accelerates Lower, Posts Largest Drop in 14 Months
Crude Oil Breaks Five-Month Trend, Gold in Familiar Range

selvajose
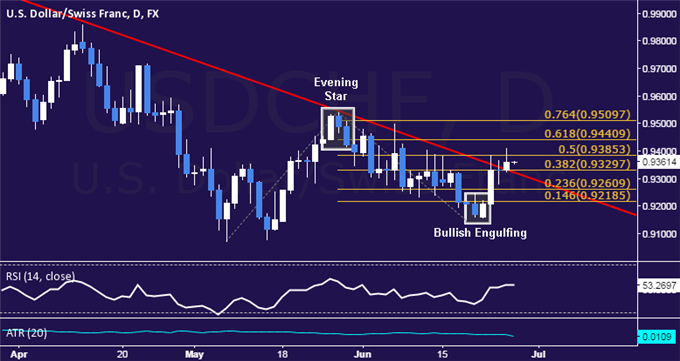

USD/CHF Technical Analysis: 3-Month Resistance Broken
Talking Points:
USD/CHF Technical Strategy: Flat
Support:0.9330, 0.9261, 0.9219
Resistance: 0.9385, 0.9441, 0.9510
The US Dollar looks poised to rise against the Swiss Franc after prices cleared resistance at a trend line capping gains since mid-March. A daily close above the 50% Fibonacci expansion at 0.9385 exposes the 61.8% level at 0.9441. Alternatively, a reversal below 0.9330 (trend line, 38.2% Fib) opens the door for a challenge of the 23.6% expansion at 0.9261.

[Deleted]
2015.06.27
а если я на японском вспомню Мать Вашу,??? уж башляешь ...... Где кириллица? хрен не русский:)
selvajose
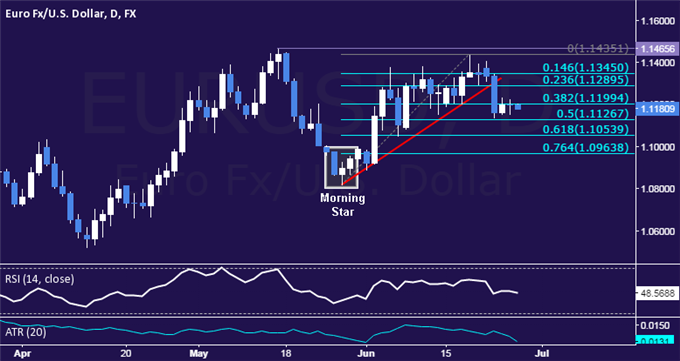
EUR/USD Technical Analysis: Quiet Consolidation Continues
Talking Points:
EUR/USD Technical Strategy: Flat
Support: 1.1127, 1.1054, 1.0964
Resistance:1.1199, 1.1290, 1.1345
Talking Points:
EUR/USD Technical Strategy: Flat
Support: 1.1127, 1.1054, 1.0964
Resistance:1.1199, 1.1290, 1.1345

selvajose
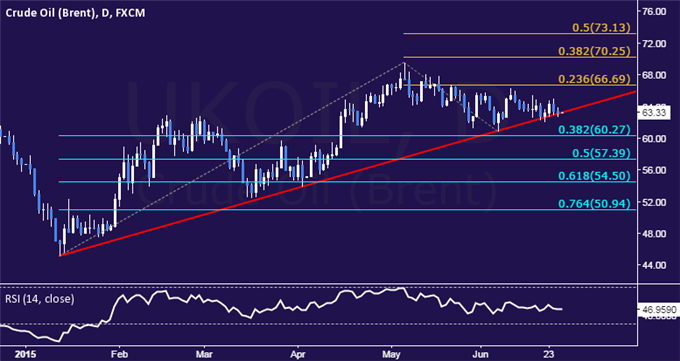
Crude Oil and Gold Mark Time as SPX 500 Retreat Continues
CRUDE OIL TECHNICAL ANALYSIS – Prices continue to stall at trend line support guiding the recovery from mid-January. A break below this barrier – now at 63.25 – exposes the 38.2% Fibonacci retracement at 60.27. Alternatively, a move above the 23.6% Fib expansion at 66.69 targets the 38.2% threshold at 70.25.
CRUDE OIL TECHNICAL ANALYSIS – Prices continue to stall at trend line support guiding the recovery from mid-January. A break below this barrier – now at 63.25 – exposes the 38.2% Fibonacci retracement at 60.27. Alternatively, a move above the 23.6% Fib expansion at 66.69 targets the 38.2% threshold at 70.25.

selvajose
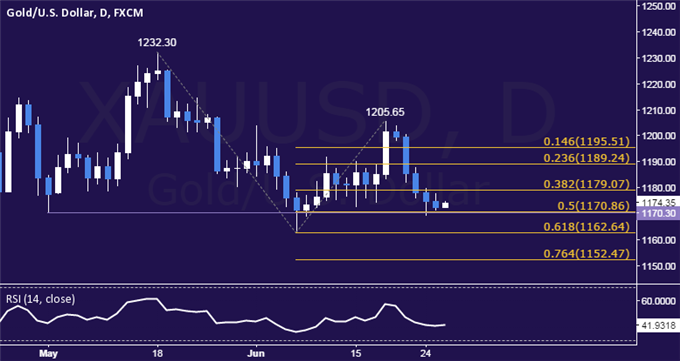

Crude Oil and Gold Mark Time as SPX 500 Retreat Continues
GOLD TECHNICAL ANALYSIS – Prices have slumped back to two-month support after failing to hold up above the $1200/oz figure. A break below the 1170.30-86 area (May 1 low, 50% Fibonacci expansion) exposes the 61.8% level at 1162.64. Alternatively, a move above the 38.2% Fib at 1179.07 targets the 23.6% expansion at 1189.24.
GOLD TECHNICAL ANALYSIS – Prices have slumped back to two-month support after failing to hold up above the $1200/oz figure. A break below the 1170.30-86 area (May 1 low, 50% Fibonacci expansion) exposes the 61.8% level at 1162.64. Alternatively, a move above the 38.2% Fib at 1179.07 targets the 23.6% expansion at 1189.24.

selvajose
Crude Oil and Gold Mark Time as SPX 500 Retreat Continues
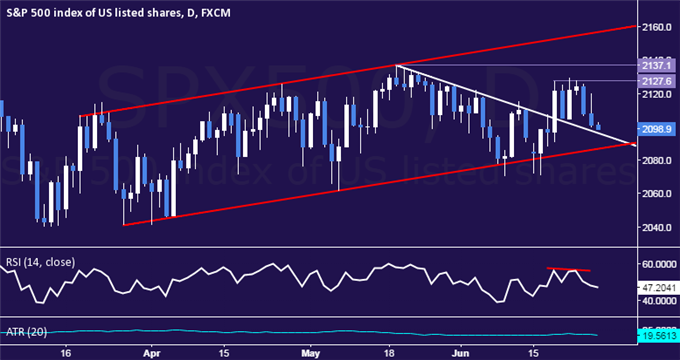
S&P 500 TECHNICAL ANALYSIS – Prices declined as expected after negative RSI divergence argued for ebbing upside momentum. From here, a break below trend line resistance-turned-support at 2096.20exposes the channel floor at 2086.90. Alternatively, a push above the 2127.60-37.10 area (May 19, June 18 highs) targets channel top resistance at 2156.20.
S&P 500 TECHNICAL ANALYSIS – Prices declined as expected after negative RSI divergence argued for ebbing upside momentum. From here, a break below trend line resistance-turned-support at 2096.20exposes the channel floor at 2086.90. Alternatively, a push above the 2127.60-37.10 area (May 19, June 18 highs) targets channel top resistance at 2156.20.

selvajose
Crude Oil and Gold Mark Time as SPX 500 Retreat Continues
Talking Points:
US Dollar Struggling to Overcome Monthly Channel Resistance
S&P 500 Pullback Continues as Prices Retreat to Weekly Low
Gold, Crude Oil Prices Stalling at Familiar Technical Barriers
Talking Points:
US Dollar Struggling to Overcome Monthly Channel Resistance
S&P 500 Pullback Continues as Prices Retreat to Weekly Low
Gold, Crude Oil Prices Stalling at Familiar Technical Barriers

selvajose
USD/JPY Technical Analysis: Familiar Range Still in Play
Talking Points:
USD/JPY Technical Strategy: Flat
Support: 123.18, 122.36, 121.54
Resistance: 124.09, 125.11, 125.93
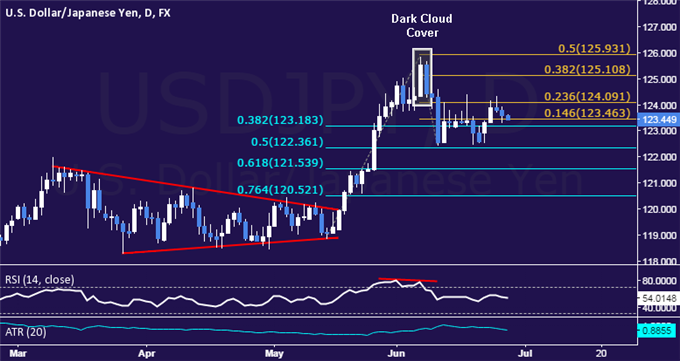
The US Dollar continues to trade sideways in a choppy above the 122.00 figure against the Japanese having turned declined as expected. A daily close above the 23.6% Fibonacci expansion at 124.09 exposes the 38.2% level at 125.11. Alternatively, a turn below the 38.2% Fibretracement at 123.18 opens the door for a test of the 50% threshold at 122.36.

selvajose
US Dollar Technical Analysis: Channel Top Under Pressure
Talking Points:
US Dollar Technical Strategy: Holding Long via Mirror Trader Basket **
Support: 11829, 11792, 11732
Resistance: 11860, 11888, 11937
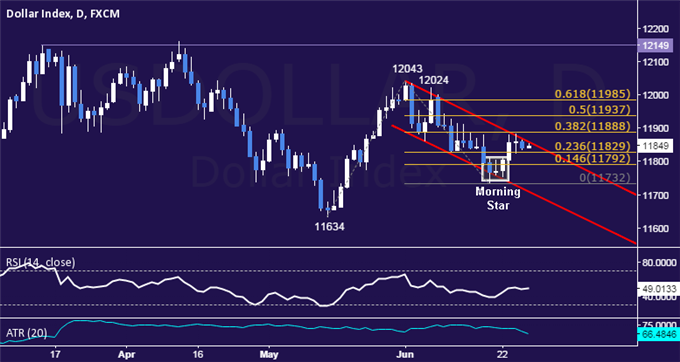
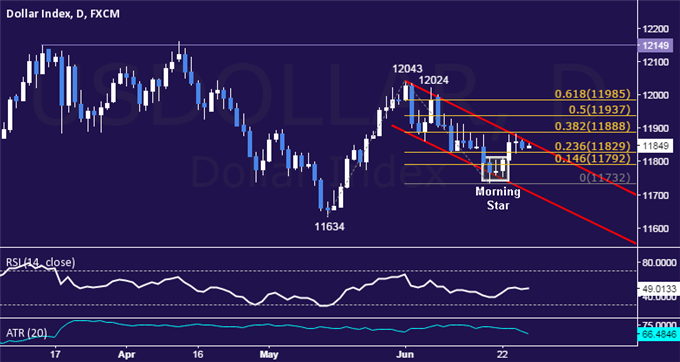
The Dow Jones FXCM US Dollar Index moved higher as expected after producing a bullish Morning Star candlestick pattern. A daily close above channel top resistance at 11860 exposes the 38.2% Fibonacci expansion at 11888. Alternatively, a reversal below the 23.6% Fib at 11829 clears the way for a test of the 14.6% level at 11792.

selvajose


NZD/USD Technical Analysis: Rebound May Be Brewing
Talking Points:
NZD/USD Technical Strategy: Flat
Support: 0.6956, 0.6871, 0.6786
Resistance:0.7061, 0.7126, 0.7231
The New Zealand Dollar may be preparing to turn higher against its US namesake as positive RSI divergence hints at warning downward momentum. A daily close below the 38.2% Fibonacci expansionat 0.6956 exposes the 50% level at 0.6871. Alternatively, a push above the 0.7024-61 area (June 5 low, 23.6% Fib) clears the way for a challenge of the 14.6% expansion at 0.7126.

selvajose

EUR/JPY Technical Analysis: Support Above 137.00 in Focus
Talking Points:
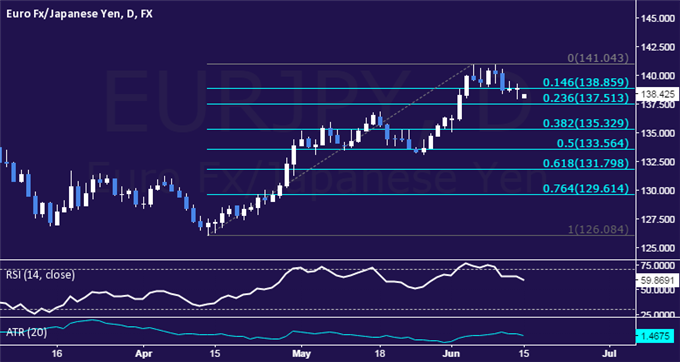
EUR/JPY Technical Strategy: Flat
Support: 137.51, 135.33, 133.56
Resistance:138.86, 141.04, 142.51
The Euro continues to mark time in a narrow range above the 137.00 figure against the Japanese Yen. Near-term support is at 137.51, the 23.6% Fibonacci retracement, with a break below that on a daily closing basis exposing the 38.2% level at 135.33. Alternatively, a turn back above the 14.6% Fib at 138.86 opens the door for a challenge of the June 4 high at 141.04.

selvajose

GBP/JPY Technical Analysis: Waiting to Re-Enter Short
Talking Points:
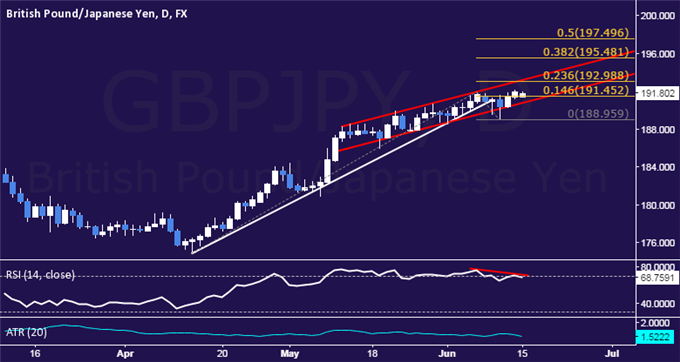
GBP/JPY Technical Strategy: Short at 190.74
Support: 191.45, 190.76, 188.96
Resistance: 192.99, 195.48, 197.50
The British Pound narrowly set a monthly high against the Japanese Yen, with prices seemingly aiming to make a move toward the 193.00 figure. Near-term resistance is at 192.99 (channel top, 23.6% Fibonacci expansion), with a break above that on a daily closing basis exposing the 38.2% level at 195.48. Alternatively, a turn below the 14.6% Fib at 191.45 opens the door for a challenge of channel floor support at 190.76.

: