EURUSD Trades to 200 Day Average for First Time in 13 Months
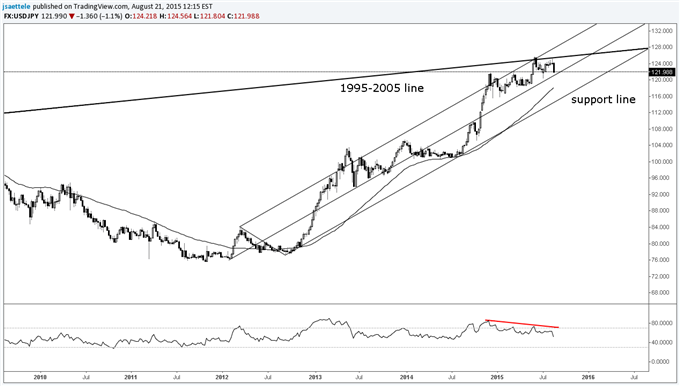
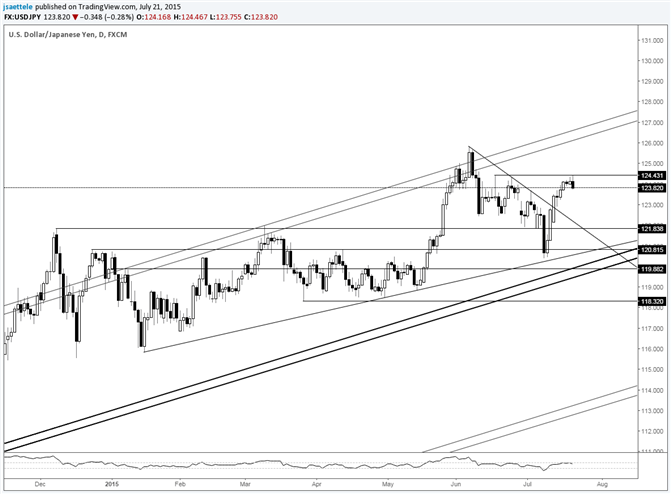
-“A USDJPY breakout from the 6 month coil would open up 123.16-124.13 (high close from June 2007 and 2007 high). A measured objective from the pattern yields 125.72 and 128.12.” -“USDJPY ended up trading to 125.85 (the mentioned 125.72 was the December range x .618 + the December high…basically a Fibonacci range expansion). Failure at long term uptrend resistance indicates potential for an important top to form. As I type, there are 2 days left in June and USDJPY is little changed for the month (month open is 124.10). In other words, a monthly doji could form…at a 20 year trendline (former support…may provide resistance now)!” -“June’s trade produced a monthly key reversal in USDJPY.” USDJPY has snapped back but a break above the long term resistance confluence (uptrend resistance and the line from the 1995 and 2005 highs) is still needed in order to minimize downside risk.” -Weakness below 123 has triggered a failed short term bullish pattern and consequently a bearish signal. Given where USDJPY is declining from (significant long term resistance), this decline could be precipitous.
EURUSD Trades to 200 Day Average for First Time in 13 Months
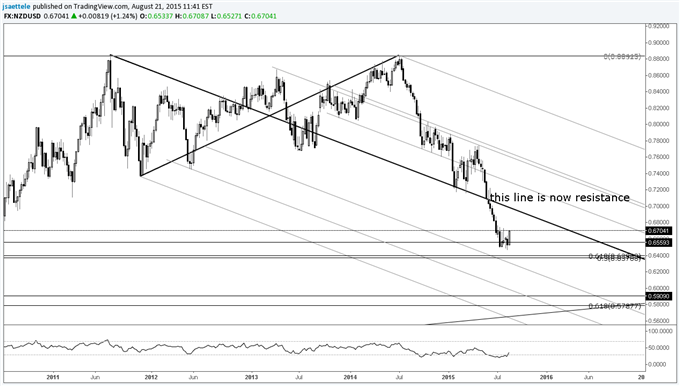
Automate trades with Mirror Trader -“One can’t help but notice that an epic double top is possible with a target of .5898. That would trigger on a drop below .7370.” -“A bearish wedge pattern has formed and yields an objective of .6607.” Look towards the mentioned objectives (.6607 and .5898). The wedge objective has been reached as has the 2010 low at .6560. The next levels to be aware of are .64 (61.8% retracement of the 2009-2011 rally and 50% retracement of the 2000-2011 rally) and .60 (long term double top target). -“A break above .6650 would trigger a bullish bias towards .6900-.7000.” The break materialized so look towards the mentioned zone.
EURUSD Trades to 200 Day Average for First Time in 13 Months
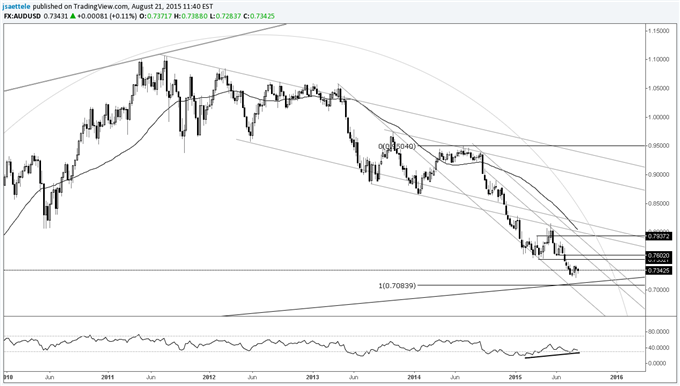
“A slope confluence pinpointed the May high, which keeps the broader trend pointed lower. A long term level to be aware of in AUDUSD is the line that connects the 2001 and 2008 lows, which is near .7100.” -“The immediate picture is bearish. Range expansion objectives yield .7143 and .6902.” The former level is joined by the trendline that extends off of the 2001 and 2008 lows. The decline from the 2011 high would consist of 2 equal legs (subdivided with the 2013 low and 2014 high) at .7084. Exceeding .7450 would indicate a change in behavior for Aussie and point towards longer term downtrend resistance in the high .7600s. Outside day reversals and volume considerations do point to capitulation.
EURUSD Trades to 200 Day Average for First Time in 13 Months
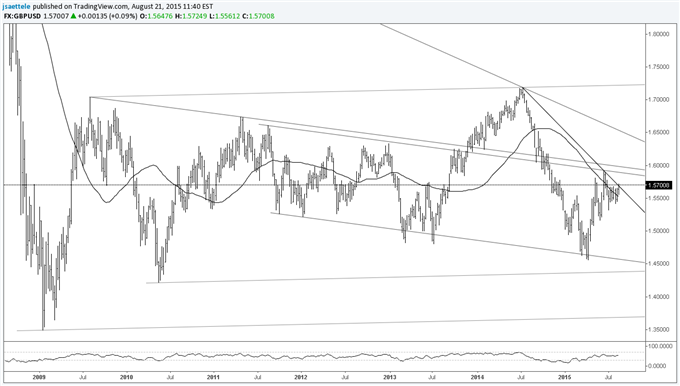
Automate trades with Mirror Trader -“GBPUSD has broken above its 52 week average for the first time since September 2013. There are hurdles to clear from slope resistance (on various time frames) up to about 1.60. As such, a period of consolidation below 1.60 may be in store before an attempt on 1.64+ (2 equal legs from the April low).” -“The ‘period of consolidation’ turned into a 6 figure decline from well-defined slope resistance. The rate has turned down from below the well-defined 1.5700.” GBPUSD hasn’t done much of anything in the last 5 weeks…so be on high alert for something big! Extremely tight periods of consolidation can precede strong directional moves. Daily slope remains bullish.
EURUSD Trades to 200 Day Average for First Time in 13 Months
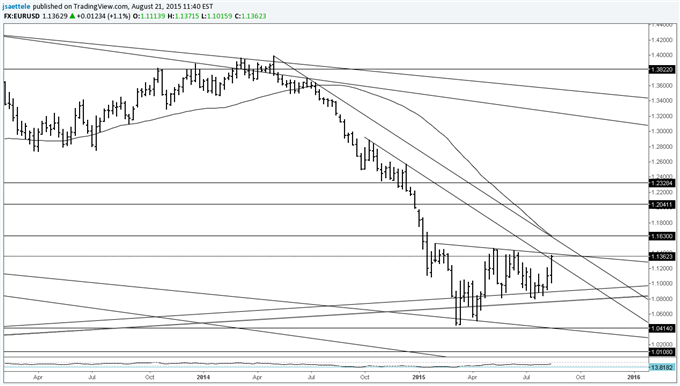
“EURUSD continues to hold up at the line that extends off of the 2000 and 2001 lows. The slope of this line is similar to the slope of the line that connects the 1995 (synthetic rate) and 2008 highs. A parallel extended from the 2000 low creates a channel so don’t dismiss resistance breaks on the daily (from long term support). Above 1.1050 signals that the long side is viable towards the top of the multi-month range.” -“The top of the multi-month range is in play. Price action since the March low may compose a triangle. Under this scenario, EURUSD could rally into 1.1400 before rolling over again.” Here we are! EURUSD faces a big test from the top of the range and 200 DMA. A breakout would target 1.1811-1.2086.
USD/JPY Technical Analysis: Waiting for Directional Spark
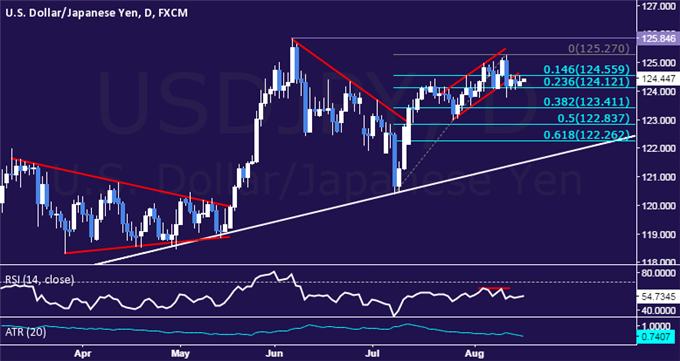
Talking Points: USD/JPY Technical Strategy: Flat Support: 124.12, 123.41, 122.84 Resistance: 124.56, 125.27, 125.85 The US Dollar is marking time against the Japanese Yen after recording the largest daily decline in a month last week. A daily closing below the 23.6% Fibonacci retracementat 124.12 exposes the 38.2% level at 123.41. Alternatively, a move above the 14.6% Fib at 124.56 opens the door for a challenge of the August 12 high at 125.27.
USD/JPY Technical Analysis: Waiting for Directional Spark
Talking Points: USD/JPY Technical Strategy: Flat Support: 124.12, 123.41, 122.84 Resistance: 124.56, 125.27, 125.85 The US Dollar is marking time against the Japanese Yen after recording the largest daily decline in a month last week. A daily closing below the 23.6% Fibonacci retracementat 124.12 exposes the 38.2% level at 123.41. Alternatively, a move above the 14.6% Fib at 124.56 opens the door for a challenge of the August 12 high at 125.27.
US Dollar Technical Analysis: Testing Trend-Defining Support
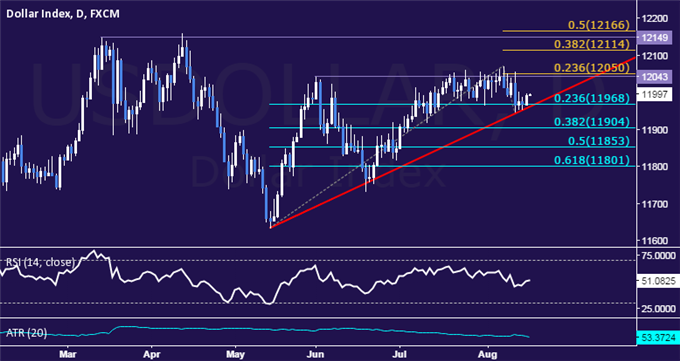
Talking Points: US Dollar Technical Strategy: Holding Long via Mirror Trader Basket ** Support: 11968, 11904, 11853 Resistance: 12050, 12114, 12166 The Dow Jones FXCM US Dollar continues to stall at trend line support guiding the move higher since early May. A daily close below 11968 (trend line, 23.6% Fibonacci retracement) exposes the 38.2% level at 11904. Alternatively, a push above the 12043-50 area (June 1 high, 23.6% Fib expansion) clears the way for a test of the 38.2% threshold at 12114.
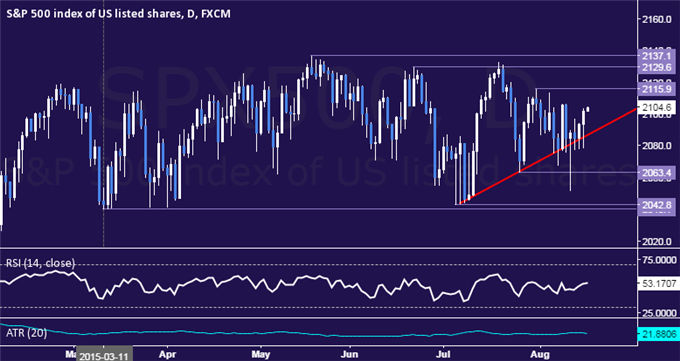
SPX 500 Technical Analysis: Still Waiting for Direction Cues
Talking Points: Support: 2085.00, 2063.40, 2040.10 Resistance: 2115.90, 2129.60, 2137.10 For more, visit our SPX 500 page The SPX 500 continues to wait for clear-cut direction cues, with prices treading water at monthly trend support. Near-term resistance is at 2115.90, the July 31 high, with a break above that on a daily closing basis exposing the June 22 top at 2129.60. Alternatively, a move below trend line support at 2086.50 opens the door for a test of the July 27 low at 2063.40.
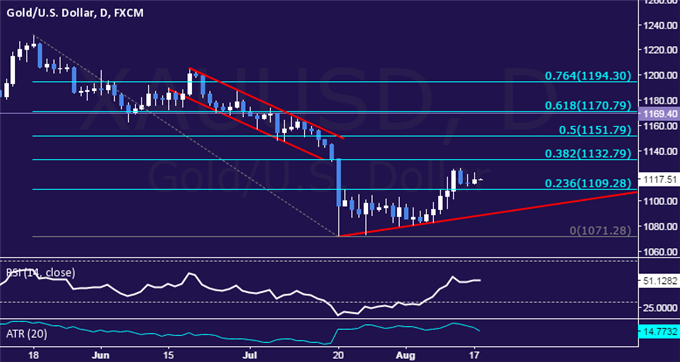
Talking Points: Support: 1109.28, 1087.47, 1071.28 Resistance: 1132.79, 1151.79, 1170.79 For more analysis, visit our gold page Gold prices paused to consolidate after issuing the largest daily advance in three months, snapping a five-day winning streak. Near-term resistance is at 1132.79, the 38.2% Fibonacci retracement, with a break above that on a daily closing basis exposing the 50% level at 1151.79. Alternatively, a move below the 23.6% Fib at 1109.28opens the door for a challenge of rising trend line support at 1088.45.
Crude Oil Technical Analysis: Support Above 48.00 Holding
Talking Points: Support: 48.22, 45.11, 41.68 Resistance: 51.34, 53.27, 56.39 Visit our crude oil page for more Crude oil prices put in a Bullish Engulfing candlestick pattern, hinting a move higher may be brewing ahead. A daily close above the 14.6% Fibonacci retracementat 51.34 exposes the 23.6% level at 53.27. Alternatively, a move below the 48.22-54 area (76.4% Fib expansion, August 10 low) opens the door for a test of the 45.11-17 zone (100% expansion, January 13 low).
USD/JPY Technical Analysis: Resistance Now Above 125.00
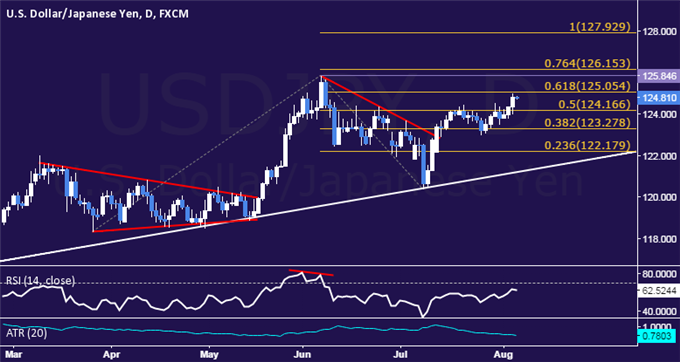
Talking Points: USD/JPY Technical Strategy: Flat Support: 124.17, 123.28, 122.18 Resistance: 125.05, 126.15, 127.93 The US Dollar continued to push upward against the Japanese Yen, advancing to the highest level in two months. A daily close above the 61.8% Fibonacci expansion at 125.05 exposes the 125.85-126.15 area (June 5 high, 76.4% level). Alternatively, a turn back below the 50% Fib at 124.17 opens the door for a test of the 38.2% expansion at 123.28.
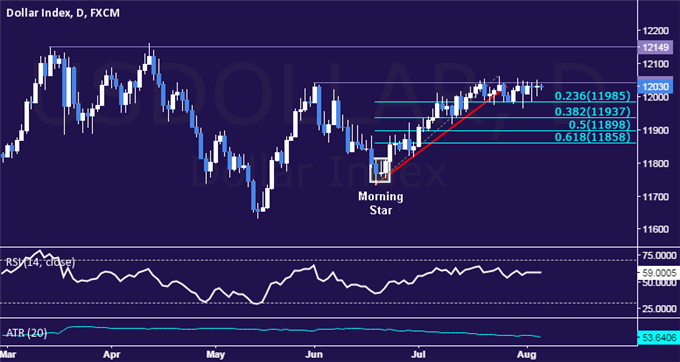
US Dollar Technical Analysis: Marking Time at Range Top
Talking Points: US Dollar Technical Strategy: Holding Long via Mirror Trader Basket ** Support: 11985, 11937, 11898 Resistance: 12043, 12149, 12204 The Dow Jones FXCM US Dollar continues to grind against monthly highs after rebounding from range support. A daily close above the June 1 highat 12043 exposes a double top at 12149. Alternatively, a turn below the 23.6% Fibonacci retracement at 11985 clears the way for a test of the 38.2% level at 11937.
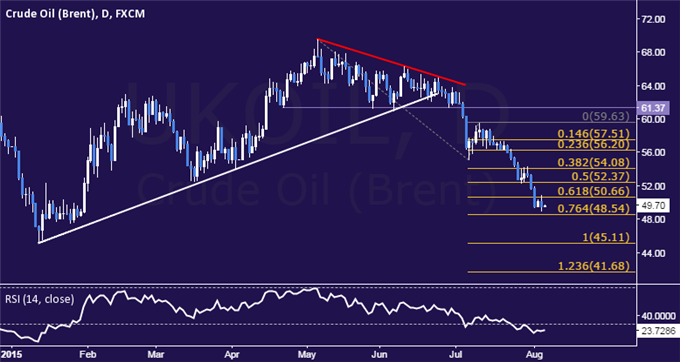
Crude Oil Technical Analysis: Prices Set New Six-Month Low
Talking Points: Support: 48.54, 45.11, 41.68 Resistance: 50.66, 52.37, 54.08 Visit our crude oil page for more Crude oil is attempting to renew its downward push, with prices slipping below the $50/barrel mark anew to set another six-month low. Near-term support is at 48.54, the 76.4% Fibonacci expansion, with a break below that on a daily closing basis exposing the 100% level at 45.11. Alternatively, a turn above the 61.8% Fib at 50.66clears the way for a challenge of the 50% expansion at 52.37.
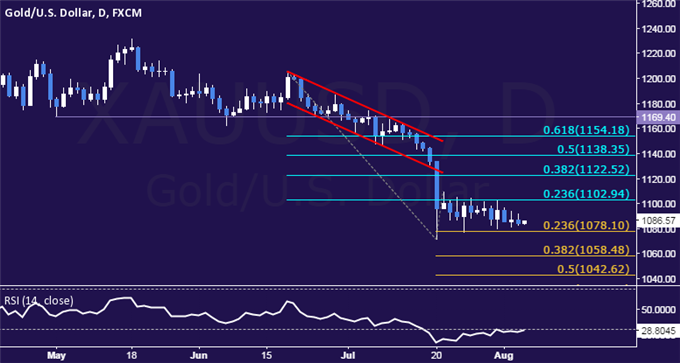
Gold Technical Analysis: Still Drifting Along Range Support
Talking Points: Support:1078.10, 1058.48, 1042.62 Resistance:1102.94, 1122.52, 1138.35 For more analysis, visit our gold page Gold prices remain locked in a well-defined range near the $1100/oz figure as markets mark time until a new directional trigger emerges. A daily close below the 23.6% Fibonacci expansionat 1078.10 exposes the 38.2% level at 1058.48. Alternatively, a move above the 23.6% Fib retracement at 1102.94 opens the door for a challenge of the 38.2% threshold at 1122.52.
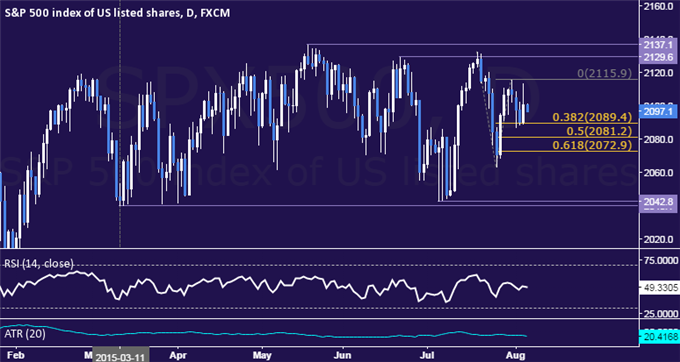
SPX 500 Technical Analysis: Interim Support Found Sub-2100
Talking Points: Support: 2089.40, 2081.20, 2072.90 Resistance: 2115.90, 2137.10, 2157.50 For more, visit our SPX 500 page The SPX 500 has transitioned into consolidation mode after finding interim support below the 2100 figure. A daily close below the 38.2% Fibonacci expansion at 2089.40 exposes the 50% level at 2081.20. Alternatively, a reversal above the July 31 high at 2115.90 clears the way for a challenge of range resistance in the 2129.60-37.10 area.
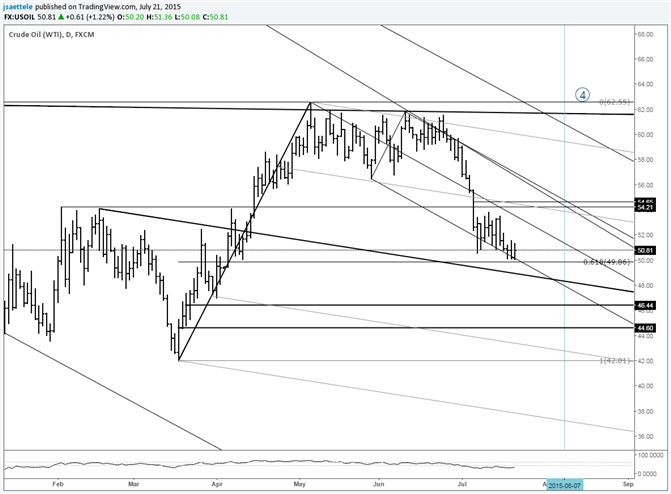
Crude at Support from Downtrend Line and Fibonacci
Crude has dropped into short term downtrend support and consolidated for 3 days. The 61.8% retracement of the rally from the March low is just below at 49.86. In other words, this isn’t a bad spot for a more important turn up but also expect resistance near 53.00/50 if reached this week.
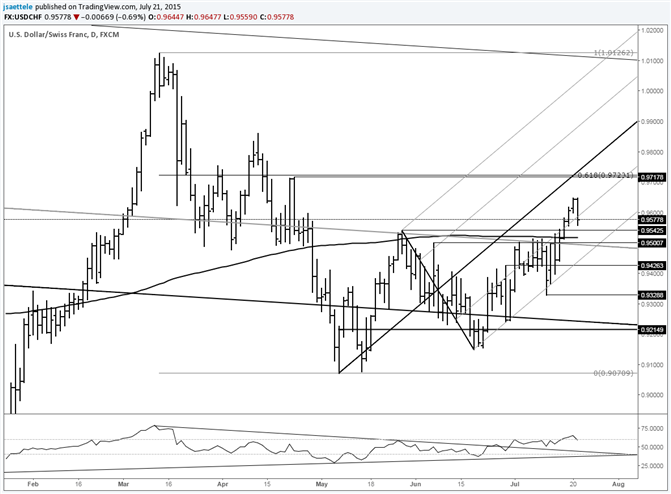
USD/CHF Former Resistance May Provide Support at .9500
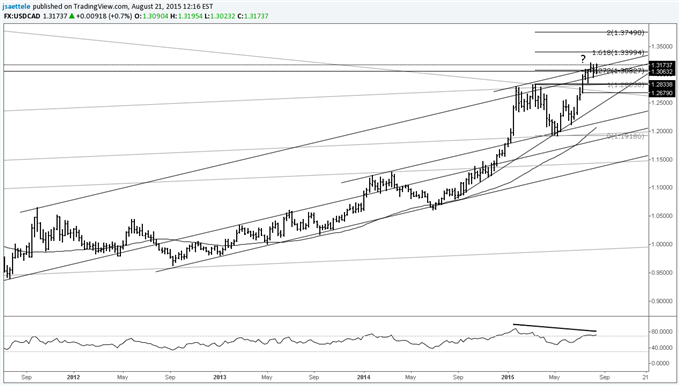
-“The next move for USDCHF is huge. The rate has failed at the 200 day average several times in recent months so a push above would indicate an important break above resistance. At the same time, shorts playing the range towards .9215 or so are afforded tight stops.” USDCHF has broken above key resistance (from long term slope and the long term MA. Focus is on .9720 (61.8% retracement of March-May decline and 4/23 high).
“Range expansion objectives from the December and March ranges are 125.72 and 128.12. Be aware of a long term slope level, especially in light of today’s (6/2) outside reversal. Tops formed at this line in March and July 2013. Bigger tops formed following ‘blow-offs’ through the line.” -“The gap through a minor support line warns of a larger decline in its early stages.” A bigger top is still possible but the break above short term resistance negates a short term bearish outlook. Watch 121.85 for support now.