mazen nafee / Profile
- Information
|
9+ years
experience
|
0
products
|
0
demo versions
|
|
0
jobs
|
0
signals
|
0
subscribers
|
Friends
956
Requests
Outgoing
mazen nafee
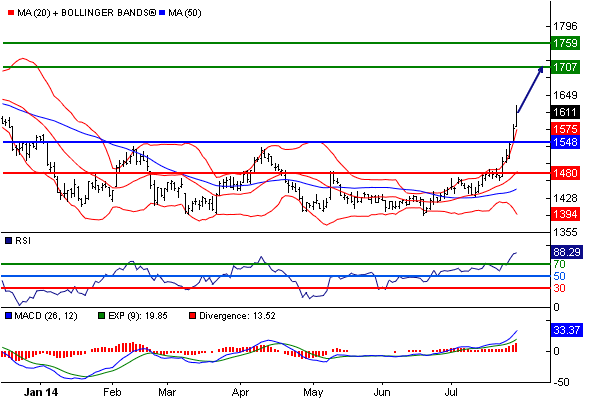
CSI 300 Materials index ST: the RSI is overbought
Our pivot point stands at 1548.
Our preference: the upside prevails as long as 1548 is support.
Alternative scenario: the downside breakout of 1548 would call for 1505 and 1480.
Comment: the RSI is above 70. It could mean either that the index is in a lasting uptrend or just overbought and therefore bound to correct (look for bearish divergence in this case). The MACD is above its signal line and positive. The configuration is positive. CSI 300 Materials index is trading above both its 20 and 50 period MA (respectively at 1484.36 and 1447.89). Finally, the CSI 300 Materials index is trading above its upper Bollinger band (standing at 1576.96).
Supports and resistances:
1759 **
1733 *
1707 **
1680
1610.836 last
1565
1548 **
1505 *
1480 **

mazen nafee
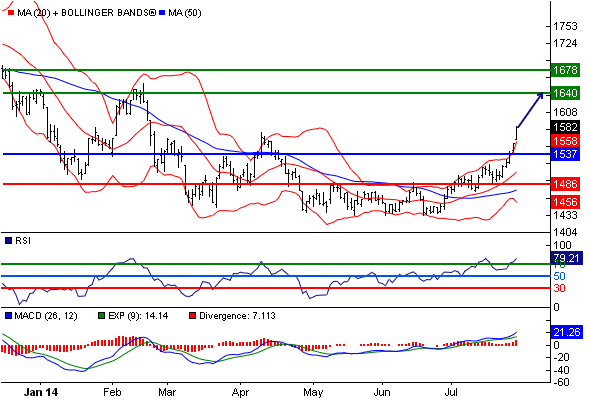
CSI 300 Industrials index ST: the RSI is overbought
Our pivot point is at 1537.
Our preference: the upside prevails as long as 1537 is support.
Alternative scenario: below 1537, expect 1505 and 1486.
Comment: the RSI is trading above 70. This could mean that either the index is in a lasting uptrend or just overbought and that therefore a correction could shape (look for bearish divergence in this case). The MACD is above its signal line and positive. The configuration is positive. CSI 300 Industrials index is trading above both its 20 and 50 period MA (respectively at 1506.96 and 1476.31). Finally, the CSI 300 Industrials index has crossed above its upper daily Bollinger band (1559.75).
Supports and resistances:
1678 **
1659 *
1640 **
1621
1582.462 last
1549
1537 **
1505 *
1486 **

mazen nafee
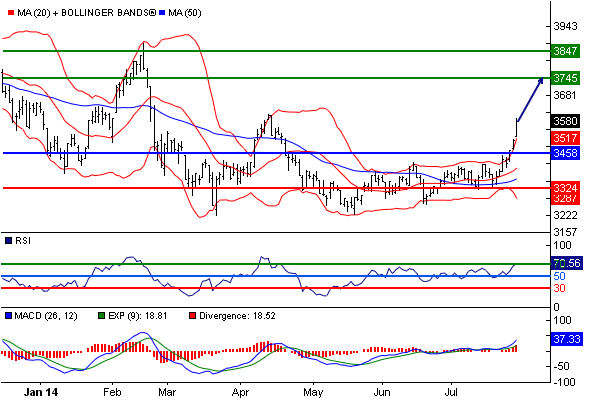
CSI 300 Consumer Discretionary index ST: above its upper Bollinger band
3458 is our pivot point.
Our preference: the upside prevails as long as 3458 is support.
Alternative scenario: the downside breakout of 3458 would call for 3374 and 3324.
Comment: the RSI is above 70. It could mean either that the index is in a lasting uptrend or just overbought and therefore bound to correct (look for bearish divergence in this case). The MACD is above its signal line and positive. The configuration is positive. CSI 300 Consumer Discretionary index is trading above both its 20 and 50 period MA (respectively at 3402.16 and 3361.57). Finally, the CSI 300 Consumer Discretionary index has crossed above its upper daily Bollinger band (3520.22).
Supports and resistances:
3847 **
3796 *
3745 **
3695
3579.814 last
3491
3458 **
3374 *
3324 **

mazen nafee
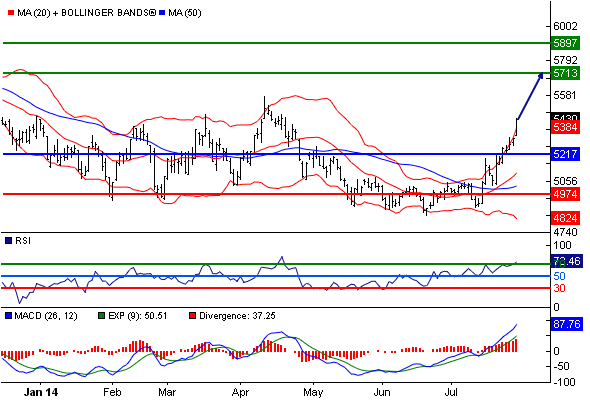
CSI 300 Consumer Staples index ST: the RSI is overbought
Our pivot point is at 5217.
Our preference: the upside prevails as long as 5217 is support.
Alternative scenario: the downside breakout of 5217 would call for 5065 and 4974.
Comment: the RSI is above 70. It could mean either that the index is in a lasting uptrend or just overbought and therefore bound to correct (look for bearish divergence in this case). The MACD is above its signal line and positive. The configuration is positive. CSI 300 Consumer Staples index is above its 20 and 50 period MA (respectively at 5104.27 and 5025.24). Finally, the CSI 300 Consumer Staples index has crossed above its upper daily Bollinger band (5391.71).
Supports and resistances:
5897 **
5805 *
5713 **
5621
5430.494 last
5277
5217 **
5065 *
4974 **

mazen nafee
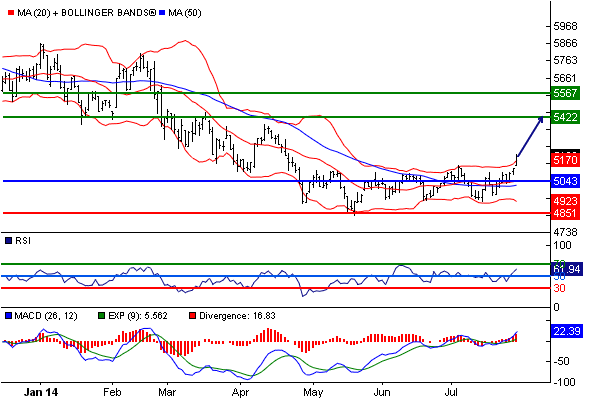
CSI 300 Health Care index ST: above its upper Bollinger band
Our pivot point is at 5043.
Our preference: the upside prevails as long as 5043 is support.
Alternative scenario: below 5043, expect 4923 and 4851.
Comment: the RSI is above 50. The MACD is positive and above its signal line. The configuration is positive. CSI 300 Health Care index is above its 20 and 50 period MA (respectively at 5046.33 and 5020.75). Finally, the CSI 300 Health Care index is trading above its upper Bollinger band (standing at 5172.72).
Supports and resistances:
5567 **
5494 *
5422 **
5349
5192.317 last
5091
5043 **
4923 *
4851 **

mazen nafee
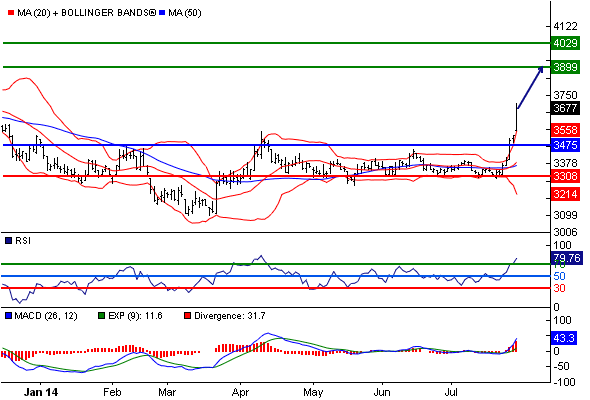
CSI 300 Financials index ST: the RSI is overbought
Our pivot point stands at 3475.
Our preference: the upside prevails as long as 3475 is support.
Alternative scenario: below 3475, expect 3370 and 3308.
Comment: the RSI is above 70. It could mean either that the index is in a lasting uptrend or just overbought and therefore bound to correct (look for bearish divergence in this case). The MACD is positive and above its signal line. The configuration is positive. CSI 300 Financials index is trading above both its 20 and 50 period MA (respectively at 3385.83 and 3369.1). Finally, the CSI 300 Financials index has crossed above its upper daily Bollinger band (3562.23).
Supports and resistances:
4029 **
3964 *
3899 **
3834
3676.914 last
3517
3475 **
3370 *
3308 **

mazen nafee
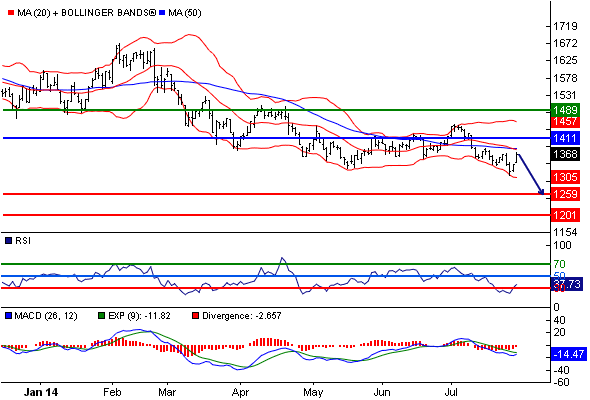
CSI 300 Information Technology index ST: gap
Our pivot point is at 1411.
Our preference: the downside prevails as long as 1411 is resistance.
Alternative scenario: above 1411, look for 1460 and 1489.
Comment: the RSI is below 50. The MACD is below its signal line and negative. The configuration is negative. CSI 300 Information Technology index is trading under both its 20 and 50 period MA (respectively at 1380.99 and 1384.23).
Supports and resistances:
1489 **
1460 *
1411 **
1391
1367.822 last
1288
1259 **
1230 *
1201 **

mazen nafee
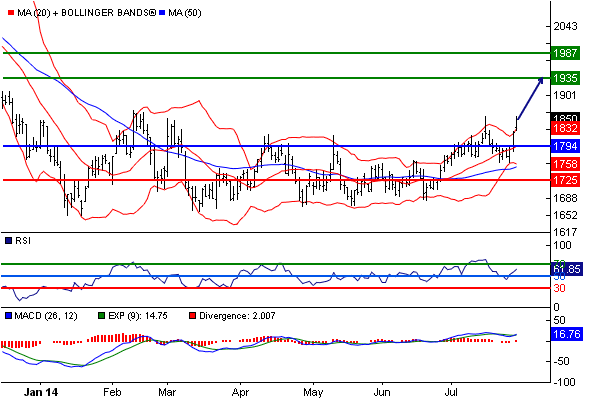
CSI 300 Telecommunication Services index ST: above its upper Bollinger band
1794 is our pivot point.
Our preference: the upside prevails as long as 1794 is support.
Alternative scenario: the downside breakout of 1794 would call for 1751 and 1725.
Comment: the RSI is above its neutrality area at 50. The MACD is positive and above its signal line. The configuration is positive. CSI 300 Telecommunication Services index is above its 20 and 50 period MA (respectively at 1795.24 and 1752.5). Finally, the CSI 300 Telecommunication Services index is trading above its upper Bollinger band (standing at 1833.21).
Supports and resistances:
1987 **
1961 *
1935 **
1909
1849.763 last
1811
1794 **
1751 *
1725 **

mazen nafee
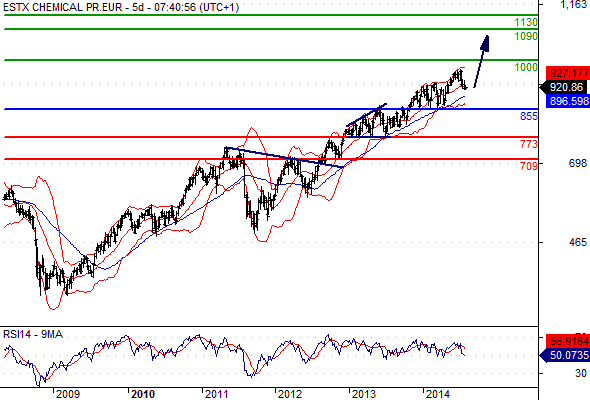
EURO STOXX Chemicals MT: the upside prevails
855 is our pivot point.
Our preference: As long as 855 is not broken down, we favour an upmove with 1000 and then 1090 as next targets.
Alternative scenario: below 855 expect a drop to 773 and 709.
Comment: The weekly indicators are bullish and call for further upside.
Trend: ST rise; MT bullish.
Supports and resistances:
1130 **
1090 **
1000 **
920.86 Last
855 **
773 **
709 **

mazen nafee
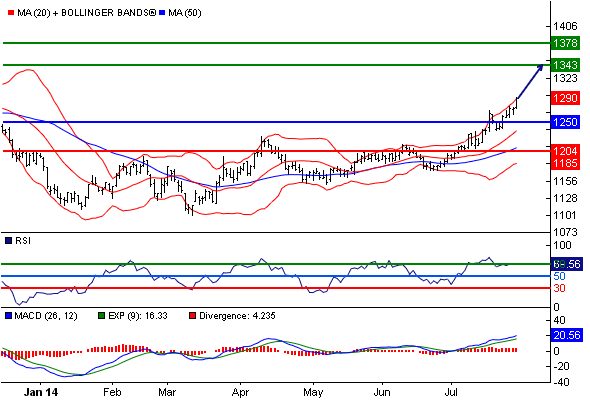
CSI 300 Utilities index ST: the upside prevails as long as 1250 is support
Our pivot point is at 1250.
Our preference: the upside prevails as long as 1250 is support.
Alternative scenario: below 1250, expect 1221 and 1204.
Comment: the RSI is above its neutrality area at 50. The MACD is positive and above its signal line. The configuration is positive. CSI 300 Utilities index is trading above both its 20 and 50 period MA (respectively at 1237.46 and 1209.95).
Supports and resistances:
1378 **
1361 *
1343 **
1326
1288.765 last
1262
1250 **
1221 *
1204 **

mazen nafee
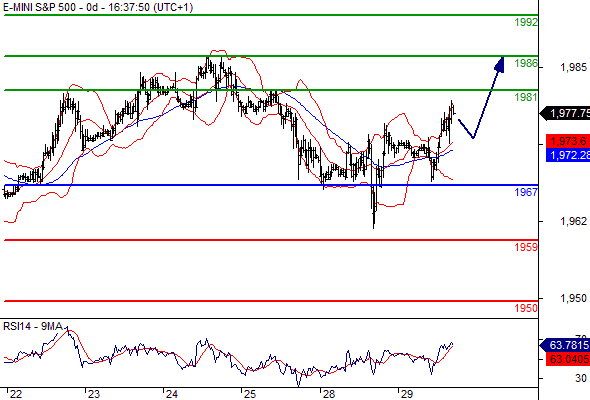
S&P500 (CME) (U4) Intraday: limited upside.
Pivot: 1967
Our preference: Long positions above 1967 with targets @ 1981 & 1986 in extension.
Alternative scenario: Below 1967 look for further downside with 1959 & 1950 as targets.
Comment: The RSI is above its neutrality area at 50%.
Supports and resistances:
1992 **
1986 **
1981 **
1978 Last
1967 **
1959 **
1950 **

mazen nafee
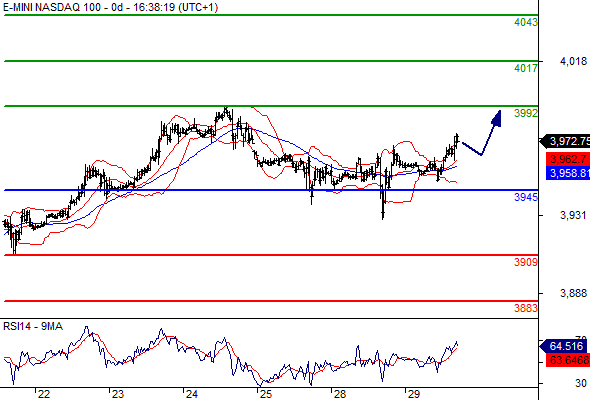
Nasdaq 100 (CME) (U4) Intraday: limited upside.
Pivot: 3945
Our preference: Long positions above 3945 with targets @ 3992 & 4017 in extension.
Alternative scenario: Below 3945 look for further downside with 3909 & 3883 as targets.
Comment: The RSI is above its neutrality area at 50%.
Supports and resistances:
4043 **
4017 **
3992 **
3973 Last
3945 **
3909 **
3883 **

mazen nafee

Dow Jones (CBT) (U4) Intraday: limited upside.
Pivot: 16875
Our preference: Long positions above 16875 with targets @ 17005 & 17070 in extension.
Alternative scenario: Below 16875 look for further downside with 16805 & 16725 as targets.
Comment: The RSI is above its neutrality area at 50%.
Supports and resistances:
17130 **
17070 **
17005 **
16978 Last
16875 **
16805 **
16725 **

mazen nafee
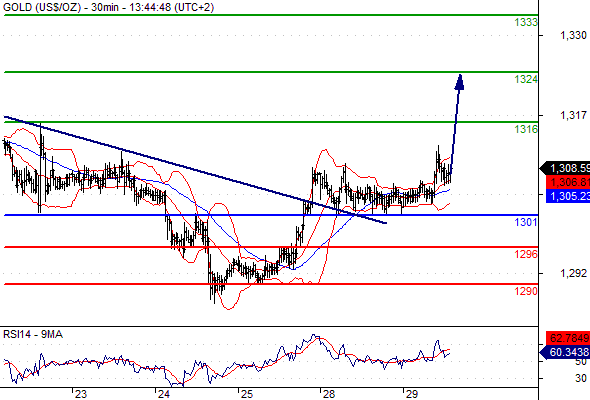
Gold spot Intraday: continuation of the rebound.
Pivot: 1301
Our preference: Long positions above 1301 with targets @ 1316 & 1324 in extension.
Alternative scenario: Below 1301 look for further downside with 1296 & 1290 as targets.
Comment: The RSI is bullish and calls for further upside. Prices broke above a declining trend line in place since July 10th intraday top.
Supports and resistances:
1333
1324
1316
1308.7 Last
1301
1296
1290

mazen nafee
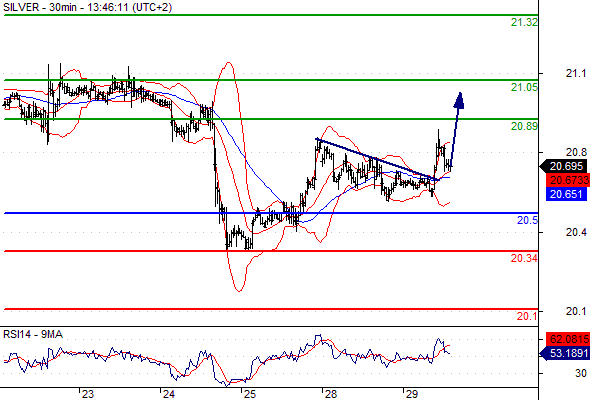
Silver spot Intraday: turning up.
Pivot: 20.5
Our preference: Long positions above 20.5 with targets @ 20.89 & 21.05 in extension.
Alternative scenario: Below 20.5 look for further downside with 20.34 & 20.1 as targets.
Comment: The RSI advocates for further advance.
Supports and resistances:
21.32
21.05
20.89
20.695 Last
20.5
20.34
20.1

mazen nafee
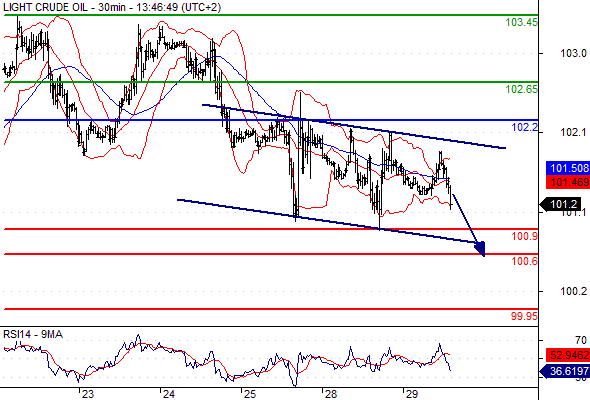
Crude Oil (NYMEX) (U4) Intraday: under pressure.
Pivot: 102.2
Our preference: Short positions below 102.2 with targets @ 100.9 & 100.6 in extension.
Alternative scenario: Above 102.2 look for further upside with 102.65 & 103.45 as targets.
Comment: The immediate trend remains down but the momentum is weak.
Supports and resistances:
103.45
102.65
102.2
101.19 Last
100.9
100.6
99.95

mazen nafee
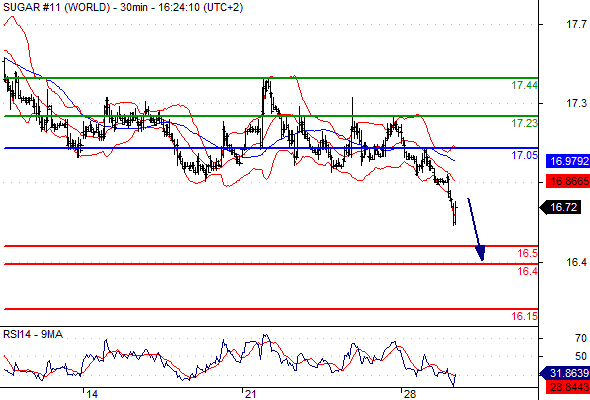
Sugar (ICE) (V4) Intraday: under pressure.
Pivot: 17.05
Our preference: Short positions below 17.05 with targets @ 16.5 & 16.4 in extension.
Alternative scenario: Above 17.05 look for further upside with 17.23 & 17.44 as targets.
Comment: The RSI is bearish and calls for further downside.
Supports and resistances:
17.44
17.23
17.05
16.72 Last
16.5
16.4
16.15

mazen nafee
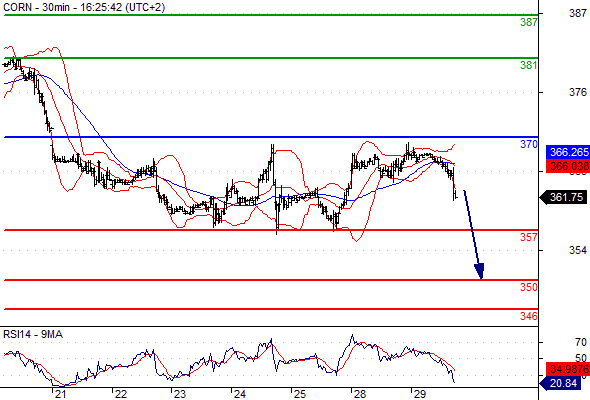
Corn (CME) (Z4) Intraday: under pressure.
Pivot: 370
Our preference: Short positions below 370 with targets @ 357 & 350 in extension.
Alternative scenario: Above 370 look for further upside with 381 & 387 as targets.
Comment: The RSI advocates for further decline.
Supports and resistances:
387
381
370
362 Last
357
350
346
Pivot: 370
Our preference: Short positions below 370 with targets @ 357 & 350 in extension.
Alternative scenario: Above 370 look for further upside with 381 & 387 as targets.
Comment: The RSI advocates for further decline.
Supports and resistances:
387
381
370
362 Last
357
350
346

mazen nafee
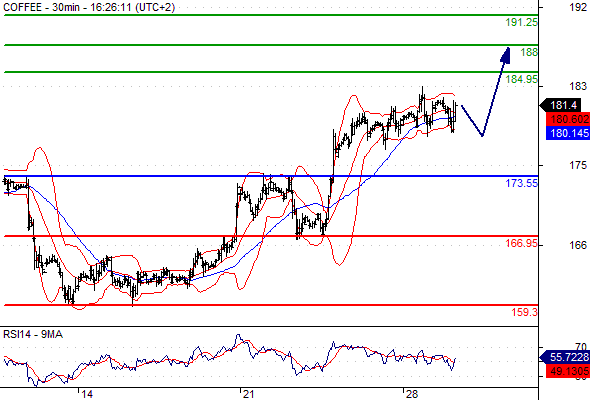
Coffee (ICE) (U4) Intraday: the upside prevails.
Pivot: 173.55
Our preference: Long positions above 173.55 with targets @ 184.95 & 188 in extension.
Alternative scenario: Below 173.55 look for further downside with 166.95 & 159.3 as targets.
Comment: The RSI is above its neutrality area at 50%.
Supports and resistances:
191.25
188
184.95
181.2 Last
173.55
166.95
159.3

mazen nafee
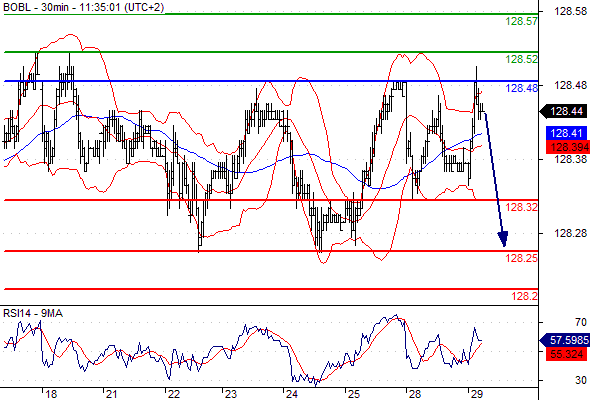
Bobl (U4) Intraday: under pressure.
Pivot: 128.48
Our preference: Short positions below 128.48 with targets @ 128.32 & 128.25 in extension.
Alternative scenario: Above 128.48 look for further upside with 128.52 & 128.57 as targets.
Comment: The RSI lacks upward momentum.
Supports and resistances:
128.57
128.52
128.48
128.44 Last
128.32
128.25
128.2

: