• Information
9+ years
experience
11
products
89
demo versions
0
jobs
0
signals
0
subscribers
Viktor Macariola
Viktor Macariola
Presenting the Trend Navigator for MT4 - https://www.youtube.com/watch?v=p8DODzCaZcE
Viktor Macariola
Viktor Macariola
The ✨ Volume by Price ✨ is a volume-based indicator for MT4 that reveals price levels with the most and least volume for each bar within a given period. Try now ➡️ https://www.mql5.com/en/market/product/82633
Viktor Macariola
Viktor Macariola
The Candle Volume Heatmap indicator for MT4 merges volume with price by applying gradient-colored dots on the bars. It can also detect bars that have the most volume and the least volume.👉 https://www.mql5.com/en/market/product/82632
Viktor Macariola
Viktor Macariola
"What you do makes a difference, and you have to decide what kind of difference you want to make." - Jane Goodall
Viktor Macariola
Viktor Macariola
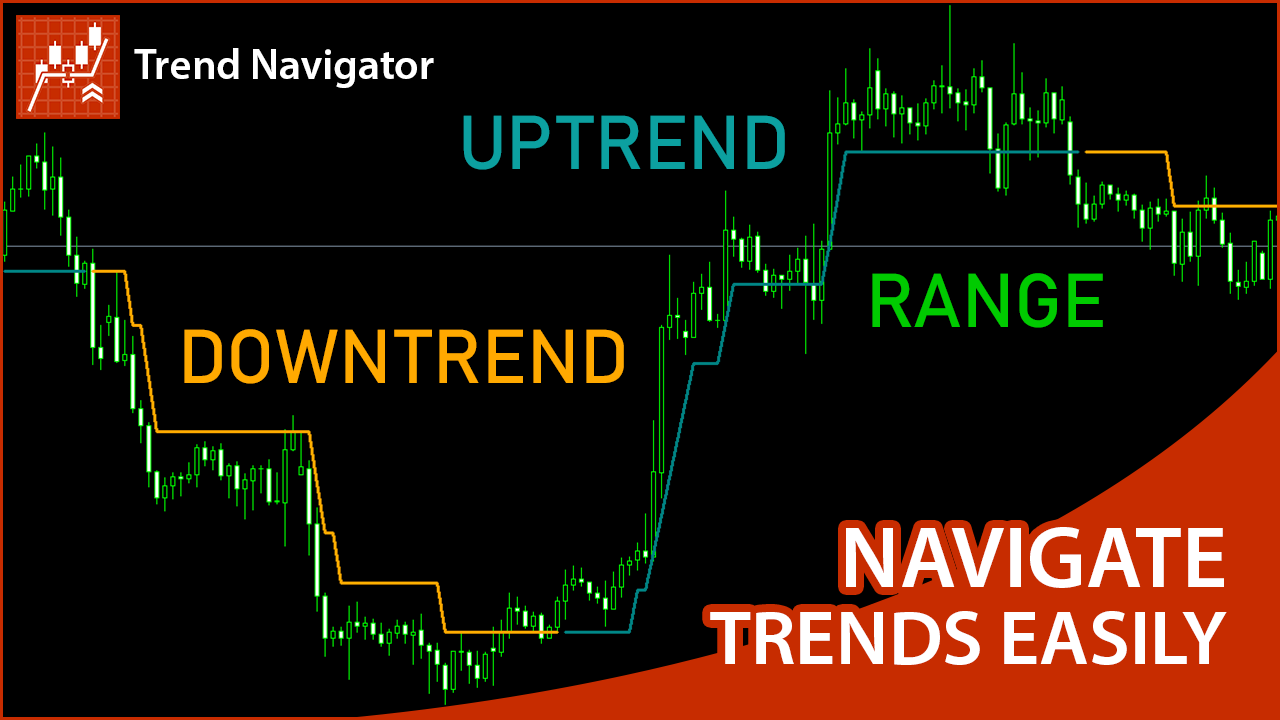
Trading Indicator Lab’s Trend Navigator for MT4 is an indicator that can help you reveal the underlying trends in any chart on any timeframe. 👉 https://www.mql5.com/en/market/product/82559?source=Site+Profile
Viktor Macariola
Viktor Macariola
TIL Daily OHLC indicator for MT4 is now FREE. Download now - https://www.mql5.com/en/market/product/46631
Viktor Macariola Published product

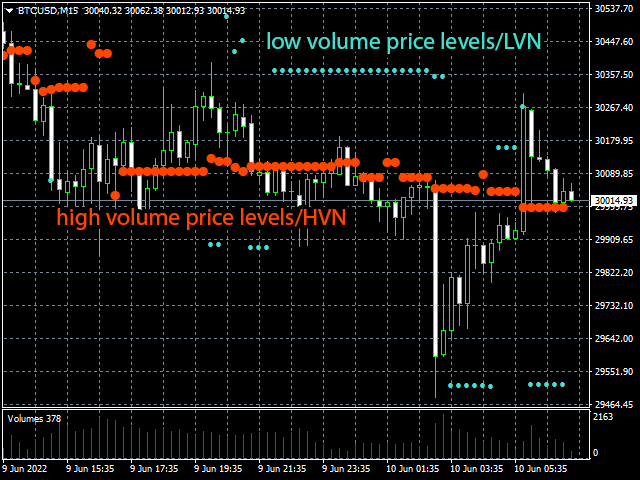
Trading Indicator Lab's Volume by Price is a volume-based indicator for MT4 that reveals price levels with the most and least volume for each bar within a given period. How It Works You can think of the indicator as a running volume profile that displays the most voluminous price level and the price level that has the least volume. For each bar, the indicator calculates the volume vertically in the price axis. As this is calculated, the indicator creates 2 signals: (1) a large red dot which

Viktor Macariola Published product

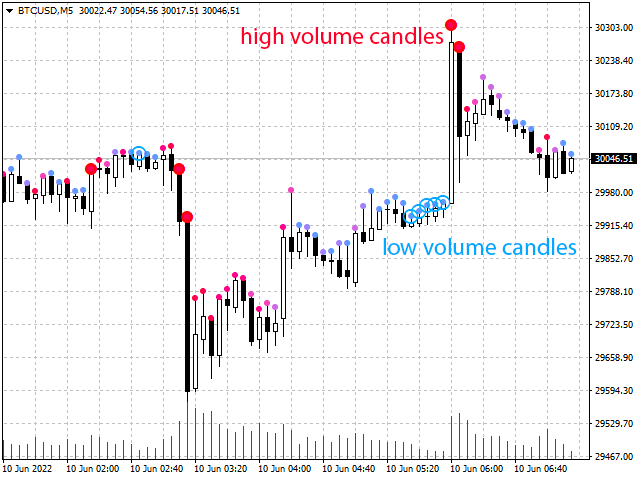
Trading Indicator Lab’s Candle Volume Heatmap for MT4 merges volume with price by applying gradient-colored dots on the bars. It can also detect bars that have the most volume and the least volume. Gradient Coloring When applied to a chart, the Candle Volume Heatmap indicator applies colored dots to each bar which may vary according to its volume. The chart becomes a heatmap where you can easily spot which parts of the bar history are “hottest” or the bars that had the greatest number of volume

Viktor Macariola Published product

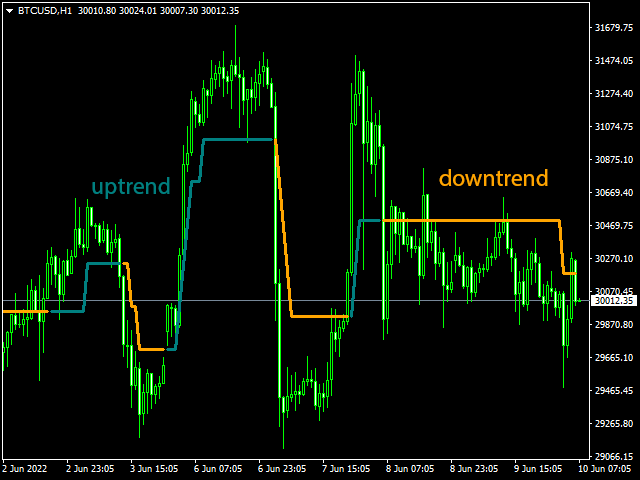
Trading Indicator Lab’s Trend Navigator for MT4 is an indicator that can help you reveal the underlying trends in any chart on any timeframe. Determining Trends It only takes a minute or two to analyze the indicator with its simple yet insightful methods of representing bullish, bearish and ranging price action across the chart. It forms a single line that runs in 3 directions: Upward direction – represents a significant bullish price action Horizontal direction – represents ranging price action
Viktor Macariola
Viktor Macariola
Reveal the underlying trends with the TIL Timeframe Overlay indicator. https://www.mql5.com/en/market/product/7162
Viktor Macariola
Viktor Macariola
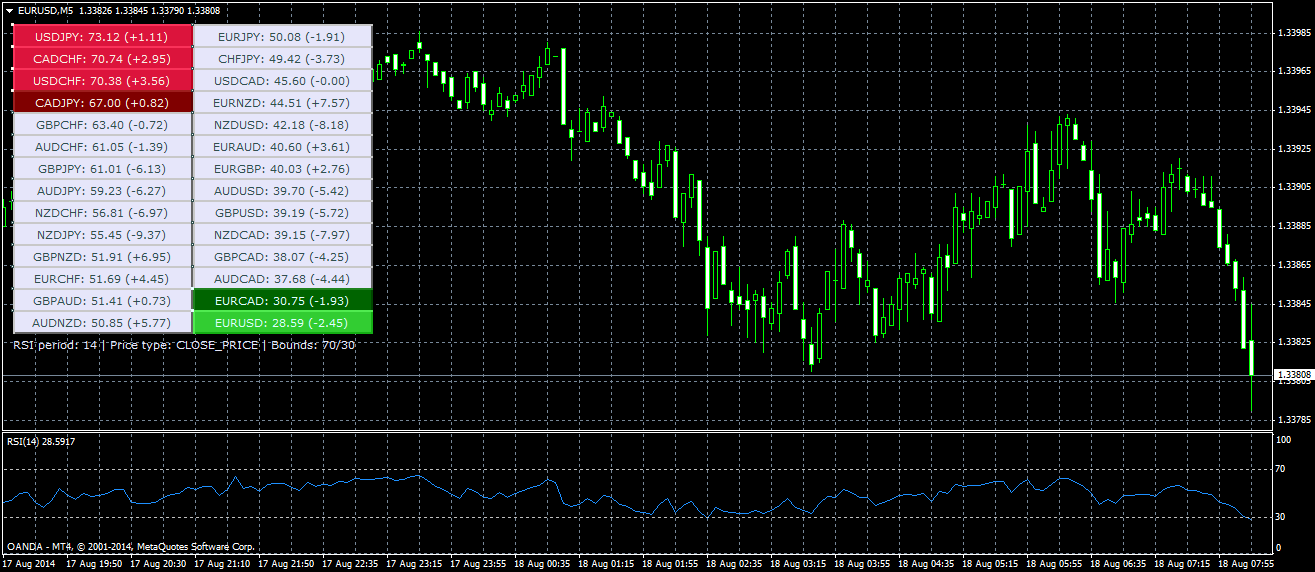
Gain the ability to monitor the RSI of 28 currency pairs at once with the TIL Multi RSI Indicator for MT4 - https://www.mql5.com/en/market/product/6063
Viktor Macariola
Viktor Macariola
See the bigger picture with the TIL Timeframe Overlay indicator. https://www.mql5.com/en/market/product/7162
Viktor Macariola
Viktor Macariola
Get the full version of the TIL New Bar Timer Indicator here for only $49 https://www.mql5.com/en/market/product/6042
Viktor Macariola
Viktor Macariola
Try our newest product - the TIL Daily OHLC indicator for the MT4 platform! A simple and effective tool to keep track of yesterday's last OPEN, HIGH, LOW, and CLOSE price levels with ALERT function. https://www.mql5.com/en/market/product/46631
Viktor Macariola Published product

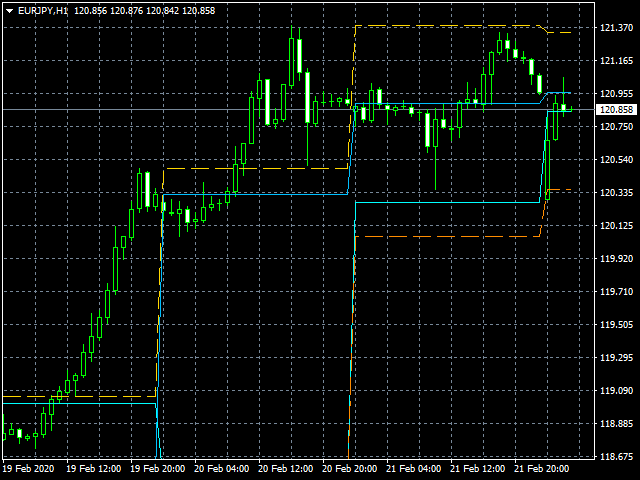
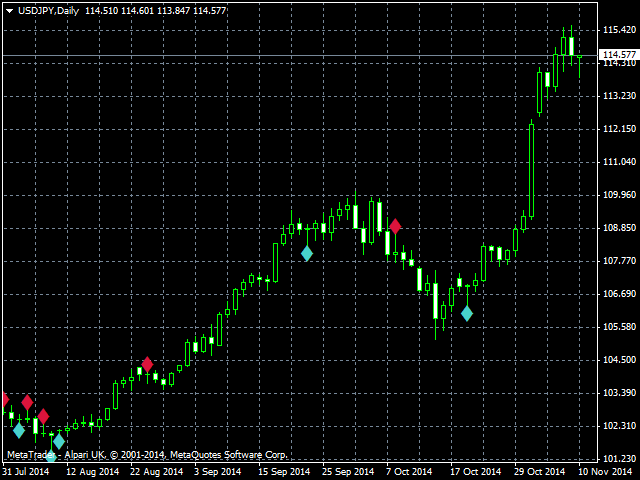
As the name implies, TIL Daily OHLC is a simple, straightforward yet effective tool to keep track of yesterday’s last Open, High, Low and Close prices. Any experienced trader knows the importance of these price levels – they are often used to navigate and predict the current day’s trend and price action as strong support and resistance. When applied to a chart, the indicator shows 4 plots that projects the 4 price levels from the previous day to the next one. Each price level is color coded and

Viktor Macariola Published product

Fibonacci retracement is one of the most reliable and used technical analysis tools for trading. It uses the so called “golden ratio” to predict certain levels of support (price movement reverses from downward to upward) and resistance (price movement reverses from upward to downward) which is a mathematical pattern seen through out nature and even the universe. Because so many traders make use of this trading strategy and watch these price levels, more often than not the Fibonacci levels become
Viktor Macariola
Viktor Macariola
Our new Doji Price Action indicator now includes Alerts! Try it now - https://www.mql5.com/en/market/product/6841
Viktor Macariola
Viktor Macariola
Monitor RSI signals of 28 currency pairs simultaneously with this nifty MT4 indicator - Multi RSI https://www.mql5.com/en/market/product/6063
Viktor Macariola
Viktor Macariola
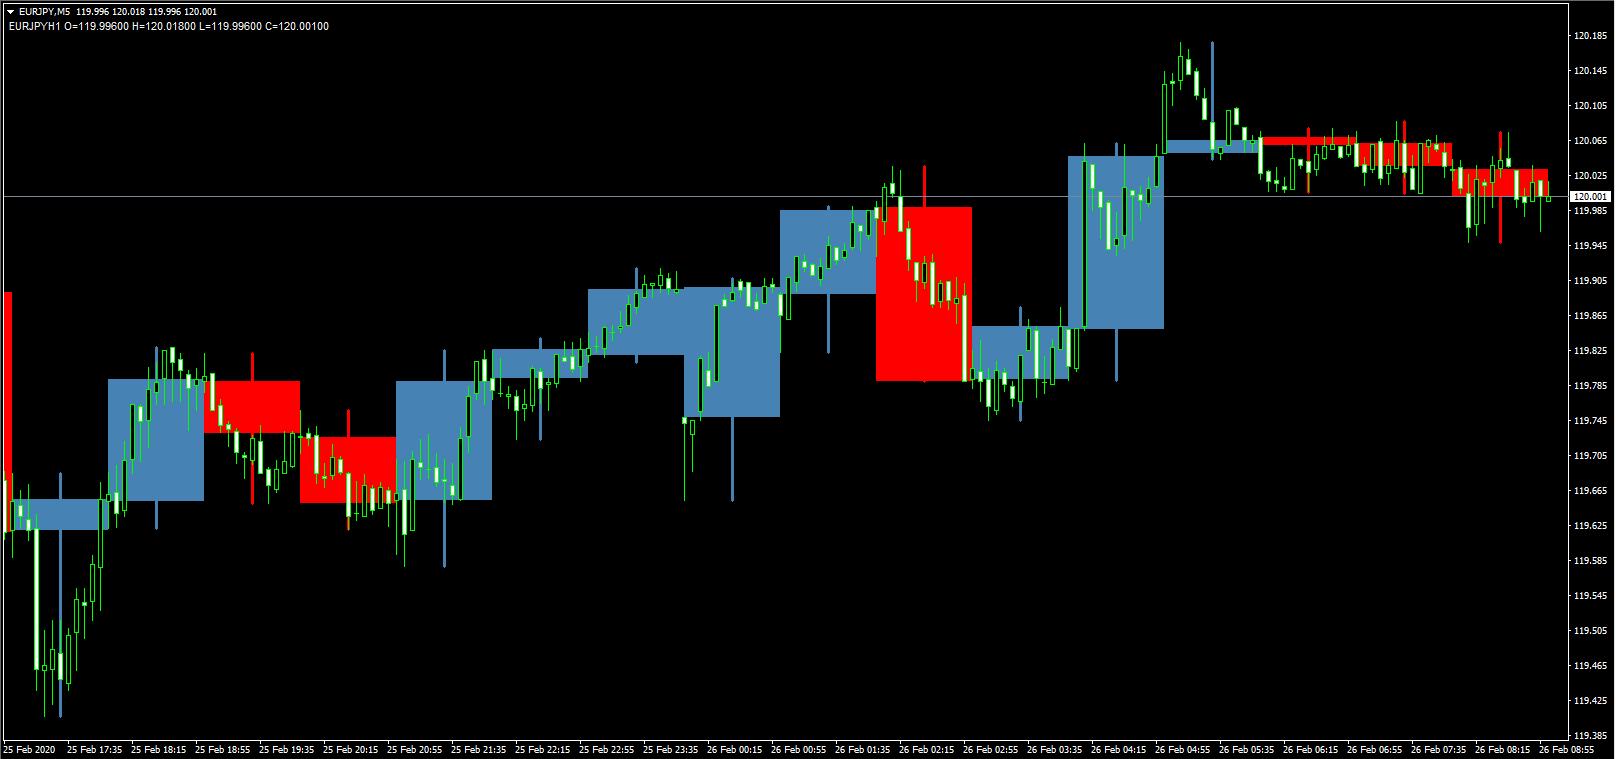
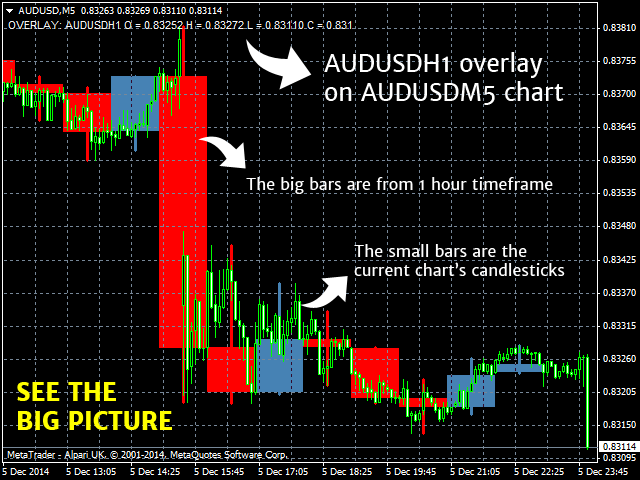
This indicator allows you to overlay candlesticks from a higher timeframe over a lower one - a great tool for multi-timeframe analysis

Timeframe Overlay Indicator for MT4 https://www.mql5.com/en/market/product/7162
Viktor Macariola
Viktor Macariola
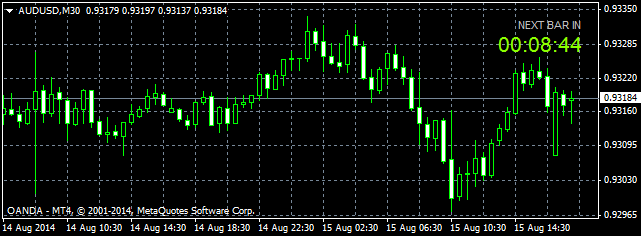
Featuring our simple yet powerful tool - New Bar Timer indicator https://www.mql5.com/en/market/product/6042
12