ADIKALARAJ / Profile
I love a good challenge and I'm as ambitious and dedicated as they come .I work in tandem toward a common goal of success.
Friends
1085
Requests
Outgoing
ADIKALARAJ
EUR/USD Technical Strategy:
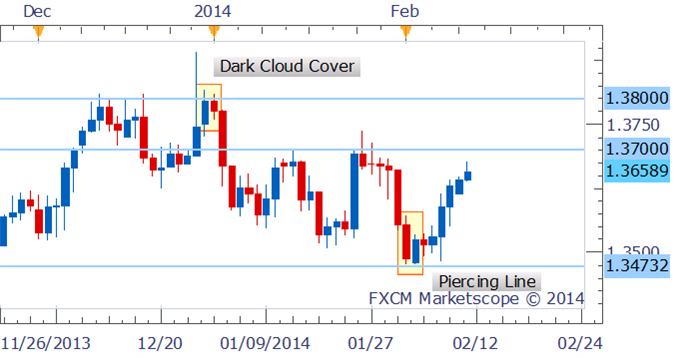
Recent Piercing Line candlestick pattern resulted in 5 straight days of gains
Overhanging resistance at 1.3700 may cap further gains and present selling opportunity
The recent Piercing Line candlestick formation has continued to result in further gains for EUR/USD. The absence of a bearish reversal pattern leaves a bullish bias for the pair. However, resistance looming overhead at the 1.3700 handle may leave further upside potential for the Euro limited.

ADIKALARAJ
GOLD TECHNICAL ANALYSIS –
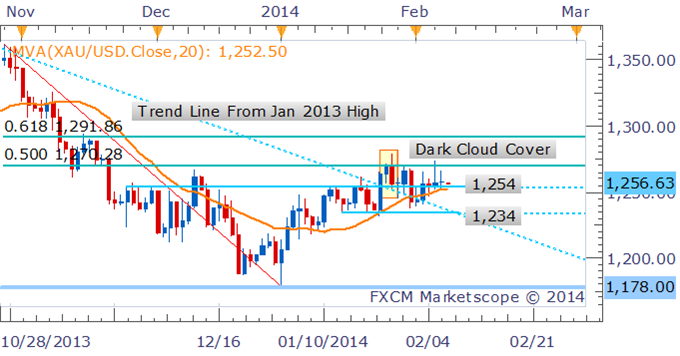
The consolidation in gold has continued in recent trading with buyers sitting at 1,254 helping to support prices while overhanging resistance at 1,270 has capped further gains. A daily close below 1,254 may help support a bearish bias for the precious metal.
The consolidation in gold has continued in recent trading with buyers sitting at 1,254 helping to support prices while overhanging resistance at 1,270 has capped further gains. A daily close below 1,254 may help support a bearish bias for the precious metal.

ADIKALARAJ
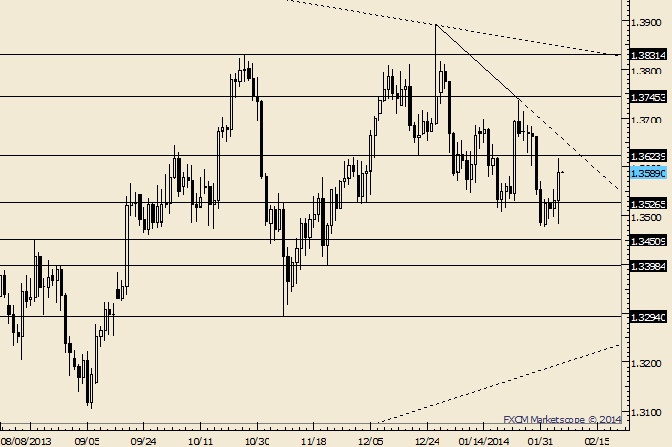
EUR/USD 1.3624 and Trend lines in Play for NFP:=
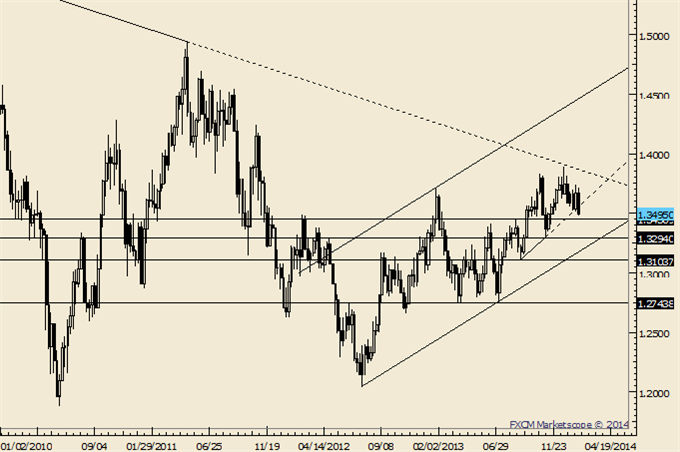
EURUSD is a sloppy mess near term. Resistance is estimated from the December 20th low at 1.3625 and a trendline at about 1.3660 on Friday. Support is estimated from 1.3527/55.
-Bigger picture, the response in late December from the trendline that extends off of the 2008 and 2011 highs does suggest that the market may have made an important top.
LEVELS: 1.3472 1.35271.3555 | 1.3625 1.3688 1.3745.

ADIKALARAJ
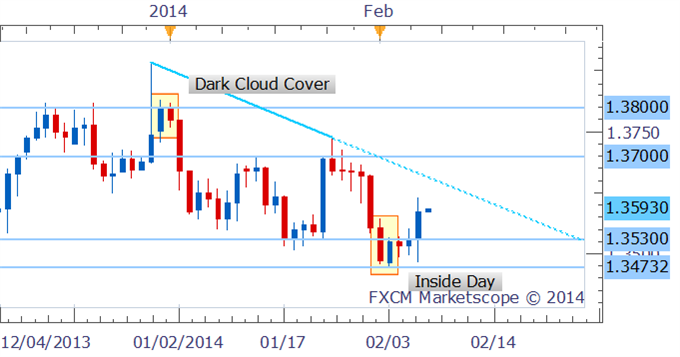
{EUR/USD Receives Confirmation of Bullish Pattern}
EUR/USD Technical Strategy: Inside Day confirmation hints at further gains
Euro breaks above resistance at 1.3530 suggesting renewed upside momentum
Downtrend and other bearish signals suggesting overall technical mixed bias for EUR/USD
The confirmation of an Inside Day / Piercing Line candle pattern recently suggests that further gains may eventuate for EUR/USD. However, other technical signals including a prevailing downtrend on the daily supports a bearish bias. This leaves an overall mixed technical bias for the pair.

ADIKALARAJ

EUR/USD Technical Strategy: Holding short from 1.3757
• Prices put in a Bearish Engulfing candlestick pattern, hinting at a reversal lower
• The first major downside objective is at 1.3209 (23.6% Fibonacci expansion)
• Prices put in a Bearish Engulfing candlestick pattern, hinting at a reversal lower
• The first major downside objective is at 1.3209 (23.6% Fibonacci expansion)

ADIKALARAJ
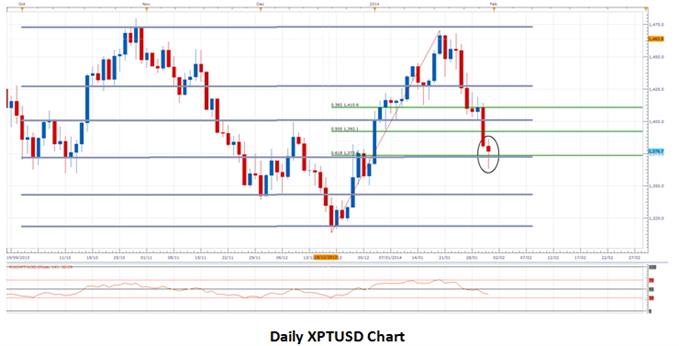
Technical Analysis Hints At Bullish Outlook for the Metals:-
A number of key technical indications suggest that, over the coming days, both copper and platinum may regain some strength.
A number of key technical indications suggest that, over the coming days, both copper and platinum may regain some strength.

ADIKALARAJ
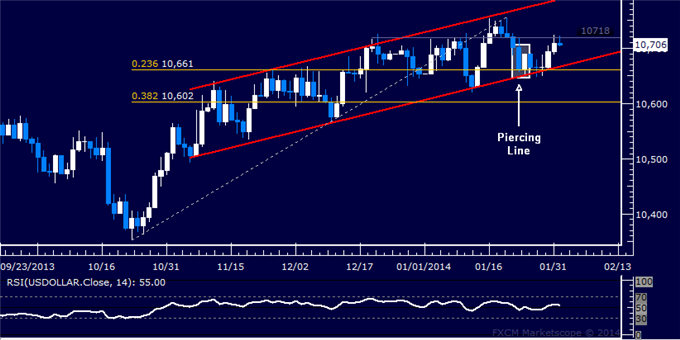
US DOLLAR TECHNICAL ANALYSIS –
Prices rose as expected after putting in a bullish Piercing Line candlestick pattern above support at 10661, marked by the bottom of a rising channel set from November and the 23.6% Fibonacci retracement. The bulls are now testing resistance at 10718 – a horizontal pivot barrier in play since mid-December. A daily close above this threshold initially exposes the January high at 10756, followed by the channel top at 10789. Alternatively, a turn below support in the 1.3545-52 area targets the 38.2% Fib at 10602
Prices rose as expected after putting in a bullish Piercing Line candlestick pattern above support at 10661, marked by the bottom of a rising channel set from November and the 23.6% Fibonacci retracement. The bulls are now testing resistance at 10718 – a horizontal pivot barrier in play since mid-December. A daily close above this threshold initially exposes the January high at 10756, followed by the channel top at 10789. Alternatively, a turn below support in the 1.3545-52 area targets the 38.2% Fib at 10602

ADIKALARAJ
GOLD TECHNICAL ANALYSIS –
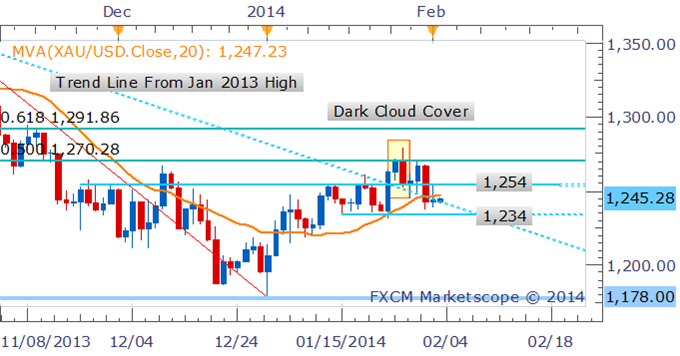
Following the declines from $1,270 a Dark Cloud Cover candlestick formation may be warning of further falls for the precious metal. A confluence of additional technical signals is required before a more meaningful reversal could be suggested including a break below support at $1,234.
Following the declines from $1,270 a Dark Cloud Cover candlestick formation may be warning of further falls for the precious metal. A confluence of additional technical signals is required before a more meaningful reversal could be suggested including a break below support at $1,234.

ADIKALARAJ
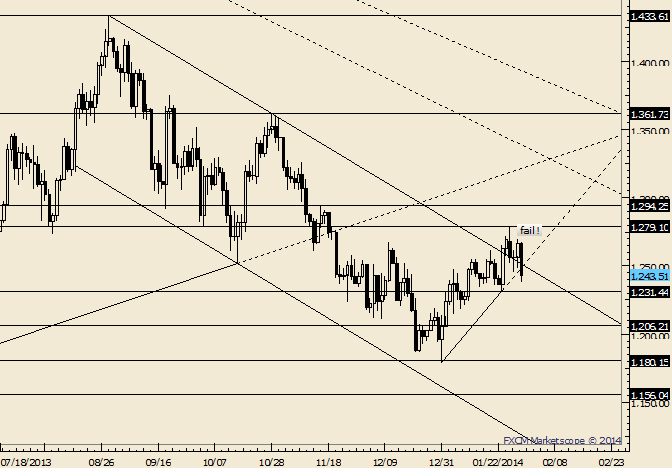
Gold at Risk of Failed Breakout; 1231 is Significant.
The levels are given,
LEVELS: 1206 1219 1231 | 1250 1261 1279 .
The levels are given,
LEVELS: 1206 1219 1231 | 1250 1261 1279 .

ADIKALARAJ
US Dollar Technical Analysis – Bullish Scenario :
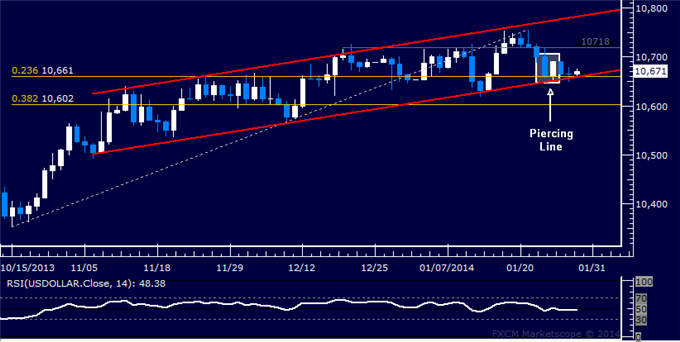
A bullish Piercing Line candle pattern hints a move higher is ahead.
Pushing above 10718 (horizontal pivot) exposes 10756-84 (Jan high, channel top).
Turning below 10661 (23.6% Fib ret, channel floor) targets 10602 (38.2% Fib ret.).
A bullish Piercing Line candle pattern hints a move higher is ahead.
Pushing above 10718 (horizontal pivot) exposes 10756-84 (Jan high, channel top).
Turning below 10661 (23.6% Fib ret, channel floor) targets 10602 (38.2% Fib ret.).

ADIKALARAJ
US Dollar Rebound Hinted, SPX 500 at Pivotal Chart Support:-
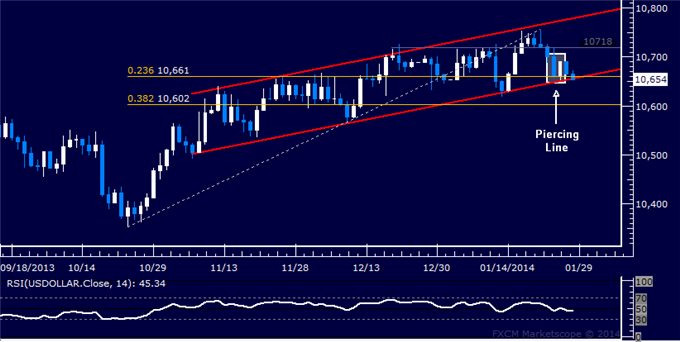
US DOLLAR TECHNICAL ANALYSIS – Prices put in a bullish Piercing Line candlestick pattern above support in the 10656-61 area, marked by the bottom of a rising channel set from November and the 23.6% Fibonacci retracement. A break above initial resistance at 10718 – a horizontal pivot – targets the January high at 10756 and the channel top at 10779. Alternatively, reversing below support exposes the 38.2% Fib at 10602.
US DOLLAR TECHNICAL ANALYSIS – Prices put in a bullish Piercing Line candlestick pattern above support in the 10656-61 area, marked by the bottom of a rising channel set from November and the 23.6% Fibonacci retracement. A break above initial resistance at 10718 – a horizontal pivot – targets the January high at 10756 and the channel top at 10779. Alternatively, reversing below support exposes the 38.2% Fib at 10602.

ADIKALARAJ
Forex: USD/JPY Technical Analysis – 105.00 Held as Resistance -
http://t.co/iZl3IGqttF
Please go through this link and tell me when I can buy or sell?
http://t.co/iZl3IGqttF
Please go through this link and tell me when I can buy or sell?
ADIKALARAJ
Current Forex trading news:
• Dollar Progress Needs an Active Catalyst – Like Risk Aversion
• Euro Enjoys Capital Flows, Policy Makers Take Greater Risks
• Yen Crosses Fail to Take New Highs, BoJ Decision Next Week
• Dollar Progress Needs an Active Catalyst – Like Risk Aversion
• Euro Enjoys Capital Flows, Policy Makers Take Greater Risks
• Yen Crosses Fail to Take New Highs, BoJ Decision Next Week
ADIKALARAJ


Which Software / robot is used to generate such screenshot to tell buy sell signals of the screenshot? please reply .
http://www.myfxbook.com/files/Ramin_Rostami/Ramin_Screen_shot_%23333_wx.jpg .....
http://www.myfxbook.com/files/Ramin_Rostami/Ramin_Screen_shot_%23333_wx.jpg .....
Sergey Golubev
2014.01.14
this software is metatrader, and the arrows on the chart are the places where EA traded. Seems - EA traded on M1 or M5 timeframe, but the author zoomed out the chart (using metatrader) to show many arrows (just to attact the users for example) ... nothing special sorry
Mohammad Aghigh
2014.01.14
hi friend be carefully about This Signal And This person
He Is A lying man
He Is A lying man
ADIKALARAJ
There are many online trading companies of forex. are they safe to trade in and as I am a beginner so do I need any certification to trade currency or can iinvest and trade my money without any certification ?
:
