Young Ho Seo / Profile
- Information
|
10+ years
experience
|
62
products
|
1170
demo versions
|
|
4
jobs
|
0
signals
|
0
subscribers
|
Harmonic Pattern Indicator - Repainting + Japanese Candlestick Pattern Scanner + Automatic Channel + Many more
https://www.mql5.com/en/market/product/4488
https://www.mql5.com/en/market/product/4475
https://algotrading-investment.com/portfolio-item/harmonic-pattern-plus/
Non Repainting and Non Lagging Harmonic Pattern Indicator – Customizable Harmonic + Japanese Candlestic Pattern Scanner + Advanced Channel + Many more
https://www.mql5.com/en/market/product/41993
https://www.mql5.com/en/market/product/41992
https://algotrading-investment.com/portfolio-item/profitable-pattern-scanner/
Supply Demand Indicator – Multiple Timeframe Scanning Added + Non Repainting + Professional Indicator
https://www.mql5.com/en/market/product/40076
https://www.mql5.com/en/market/product/40075
https://algotrading-investment.com/portfolio-item/ace-supply-demand-zone/
Momentum Indicator – Path to Volume Spread Analysis
https://www.mql5.com/en/market/product/30641
https://www.mql5.com/en/market/product/30621
https://algotrading-investment.com/portfolio-item/excessive-momentum-indicator/
Elliott Wave Indicator for the Power User
https://www.mql5.com/en/market/product/16479
https://www.mql5.com/en/market/product/16472
https://algotrading-investment.com/portfolio-item/elliott-wave-trend/
Forex Prediction - Turn Support and Resistance to the Advanced Strategy
https://www.mql5.com/en/market/product/49170
https://www.mql5.com/en/market/product/49169
https://algotrading-investment.com/portfolio-item/fractal-pattern-scanner/
MetaTrader 4 and MetaTrader 5 Product Page: https://www.mql5.com/en/users/financeengineer/seller#products
Free Forex Prediction with Fibonacci Analysis: https://algotrading-investment.com/2020/10/23/forex-prediction-with-fibonacci-analysis/
Free Harmonic Pattern Signal: https://algotrading-investment.com/2020/12/17/harmonic-pattern-signal-for-forex-market/
============================================================================================================================
Here are the trading education books. We recommend reading these books if you are a trader or investor in Forex and Stock market. In the list below, we put the easy to read book on top. Try to read the easy to read book first and try to read the harder book later to improve your trading and investment.
First Link = amazon.com, Second Link = Google Play Books, Third Link = algotrading-investment.com, Fourth Link = Google Books
Technical Analysis in Forex and Stock Market (Supply Demand Analysis and Support Resistance)
https://www.amazon.com/dp/B09L55ZK4Z
https://play.google.com/store/books/details?id=pHlMEAAAQBAJ
https://algotrading-investment.com/portfolio-item/technical-analysis-in-forex-and-stock-market/
https://books.google.co.kr/books/about?id=pHlMEAAAQBAJ
Science Of Support, Resistance, Fibonacci Analysis, Harmonic Pattern, Elliott Wave and X3 Chart Pattern (In Forex and Stock Market Trading)
https://www.amazon.com/dp/B0993WZGZD
https://play.google.com/store/books/details?id=MME3EAAAQBAJ
https://algotrading-investment.com/portfolio-item/science-of-support-resistance-fibonacci-analysis-harmonic-pattern/
https://books.google.co.kr/books/about?id=MME3EAAAQBAJ
Profitable Chart Patterns in Forex and Stock Market (Fibonacci Analysis, Harmonic Pattern, Elliott Wave, and X3 Chart Pattern)
https://www.amazon.com/dp/B0B2KZH87K
https://play.google.com/store/books/details?id=7KrQDwAAQBAJ
https://algotrading-investment.com/portfolio-item/profitable-chart-patterns-in-forex-and-stock-market/
https://books.google.com/books/about?id=7KrQDwAAQBAJ
Guide to Precision Harmonic Pattern Trading (Mastering Turning Point Strategy for Financial Trading)
https://www.amazon.com/dp/B01MRI5LY6
https://play.google.com/store/books/details?id=8SbMDwAAQBAJ
http://algotrading-investment.com/portfolio-item/guide-precision-harmonic-pattern-trading/
https://books.google.com/books/about?id=8SbMDwAAQBAJ
Scientific Guide to Price Action and Pattern Trading (Wisdom of Trend, Cycle, and Fractal Wave)
https://www.amazon.com/dp/B073T3ZMBR
https://play.google.com/store/books/details?id=5prUDwAAQBAJ
https://algotrading-investment.com/portfolio-item/scientific-guide-to-price-action-and-pattern-trading/
https://books.google.com/books/about?id=5prUDwAAQBAJ
Predicting Forex and Stock Market with Fractal Pattern: Science of Price and Time
https://www.amazon.com/dp/B086YKM8BW
https://play.google.com/store/books/details?id=VJjiDwAAQBAJ
https://algotrading-investment.com/portfolio-item/predicting-forex-and-stock-market-with-fractal-pattern/
https://books.google.com/books/about?id=VJjiDwAAQBAJ
Trading Education Book 1 in Korean (Apple, Google Play Book, Google Book, Scribd, Kobo)
https://books.apple.com/us/book/id1565534211
https://play.google.com/store/books/details?id=HTgqEAAAQBAJ
https://books.google.co.kr/books/about?id=HTgqEAAAQBAJ
https://www.scribd.com/book/505583892
https://www.kobo.com/ww/en/ebook/8J-Eg58EDzKwlpUmADdp2g
Trading Education Book 2 in Korean (Apple, Google Play Book, Google Book, Scribd, Kobo)
https://books.apple.com/us/book/id1597112108
https://play.google.com/store/books/details?id=shRQEAAAQBAJ
https://books.google.co.kr/books/about?id=shRQEAAAQBAJ
https://www.scribd.com/book/542068528
https://www.kobo.com/ww/en/ebook/X8SmJdYCtDasOfQ1LQpCtg
About Young Ho Seo
Young Ho Seo is an Engineer, Financial Trader, and Quantitative Developer, working on Trading Science and Investment Engineering since 2011. He is the creator of many technical indicators, price patterns and trading strategies used in the financial market. He is also teaching the trading practice on how to use the Supply Demand Analysis, Support, Resistance, Trend line, Fibonacci Analysis, Harmonic Pattern, Elliott Wave Theory, Chart Patterns, and Probability for Forex and Stock Market. His works include developing scientific trading principle and mathematical algorithm in the work of Benjamin Graham, Everette S. Gardner, Benoit Mandelbrot, Ralph Nelson Elliott, Harold M. Gartley, Richard Shabacker, William Delbert Gann, Richard Wyckoff and Richard Dennis. You can find his dedicated works on www.algotrading-investment.com . His life mission is to connect financial traders and scientific community for better understanding of this world and crowd behaviour in the financial market. He wrote many books and articles, which are helpful for understanding the technology and application behind technical analysis, statistics, time series forecasting, fractal science, econometrics, and artificial intelligence in the financial market.
If you are interested in our software and training, just visit our main website: www.algotrading-investment.com
Young Ho Seo
Optimized Harmonic Pattern
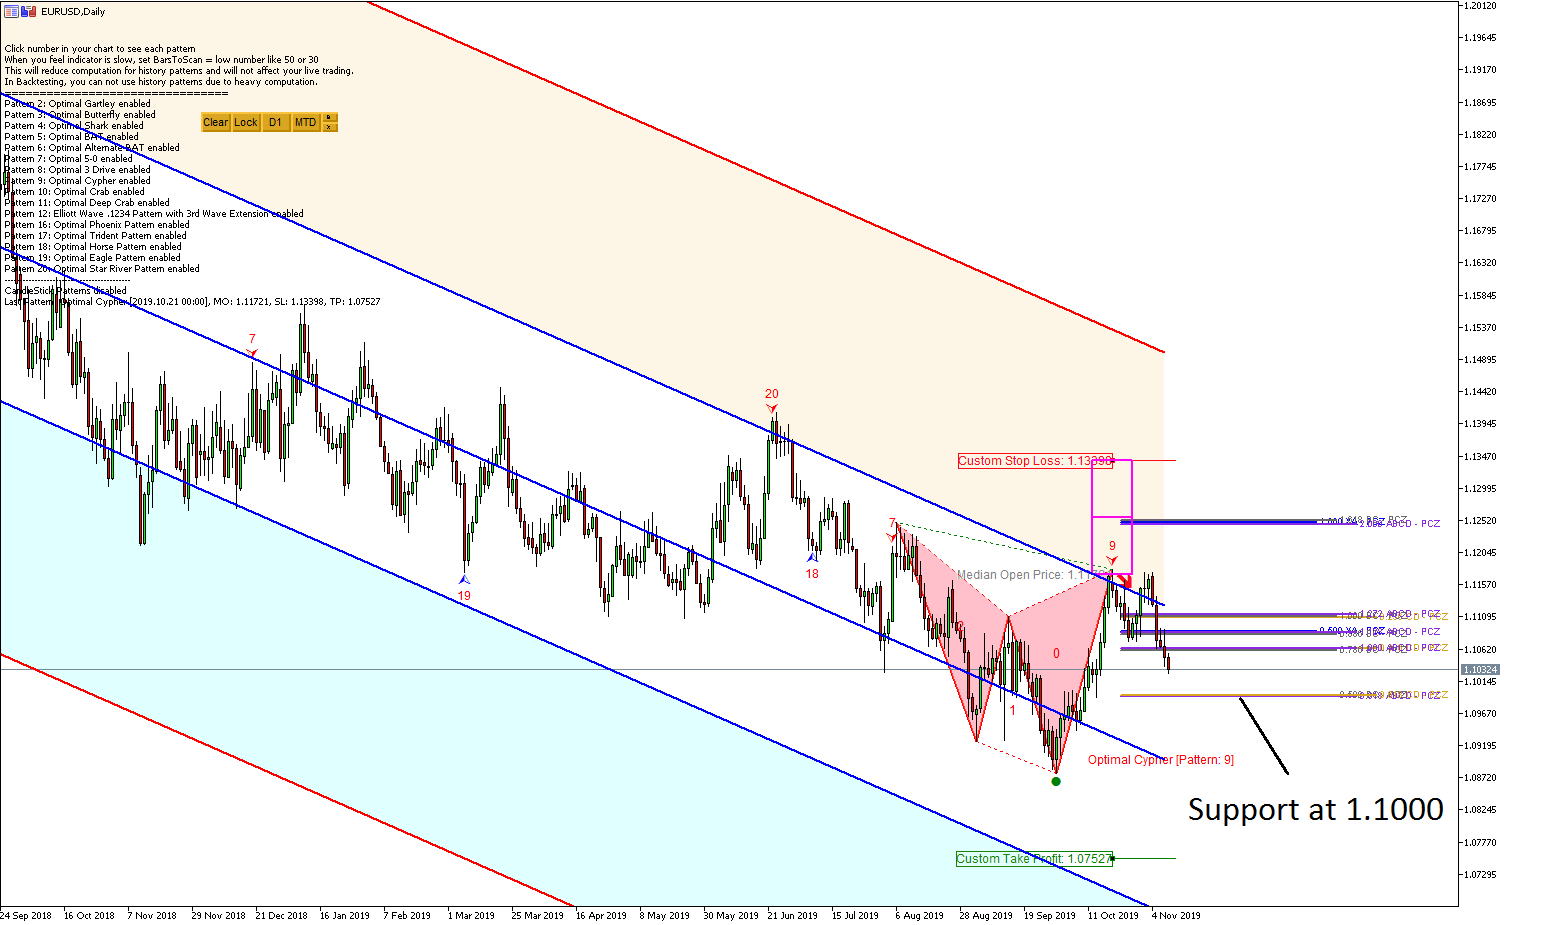
Have you ever thought that you could optimize the ratio of each Harmonic Pattern to improve your profit ? In real world trading, each currency or stock can behave differently with different dominating Fibonacci ratios. In addition, we can not assume that one harmonic pattern structure will work best across all currencies and stocks. Hence, there comes the idea of Optimizing the ratio of Harmonic Pattern. For example, you could modify or tune the ratio of Gartley Pattern, Butterfly Pattern, Bat Pattern, Crab Pattern, Cypher Pattern, 5-0 Pattern and so on for each currency or stock if you wish. Or you can modify or tune each Harmonic Pattern to get the overall performance better across all currencies and stocks. It is even better if you can apply the same idea when you trade with Elliott Wave patterns too.
To optimize each Harmonic pattern, you need a tool to visualize the true performance of each Harmonic Pattern through the historical data. It is better if you can see the historical performance directly from your chart without using any other complicated tools or tester or etc.
With X3 Chart Pattern Scanner, you can check the historical performance of Harmonic Pattern for any symbol immediately when you attach it to the chart. This sort of feature is very powerful but unique to X3 Chart Pattern Scanner. For example, You can not check the historical performance of Harmonic Pattern with repainting Harmonic pattern indicator. Since X3 Chart Pattern Scanner is non repainting, non lagging, synced between historical and live pattern, this is possible.
You can trade with optimized strategy in live trading. With X3 Chart Pattern Scanner, you can get the practical performance insight for each Harmonic pattern in few weeks with the historical information. This is really good to learn through your tool direclty and to trade with the same tool. Optimized Harmonic Pattern is a great way of improving your profit. With X3 Chart Pattern Scanner, you can modify or tune each Harmonic Pattern to optimize their trading performance using historical data. You can simply modify the ratio of each Harmonic Pattern in input setting. Below is the link to Non Repainting and Non Lagging Harmonic Pattern and Elliott Wave Pattern Indicator.
https://algotrading-investment.com/portfolio-item/profitable-pattern-scanner/
https://www.mql5.com/en/market/product/41993
https://www.mql5.com/en/market/product/41992
This Youtube video will explain some features of X3 Chart Pattern Scanner, the non repainting, non lagging harmonic pattern and Elliott Wave pattern indicator. Please watch the video to find out more about the non repainting Harmonic Pattern indicator.
YouTube: https://www.youtube.com/watch?v=uMlmMquefGQ&feature=youtu.be
YouTube: https://www.youtube.com/watch?v=2HMWZfchaEM
YouTube: https://youtu.be/x-ZIipaG4Hg

Young Ho Seo
Volume Spread Analysis Indicator List
We provide three different Volume Spread Analysis indicators and volume based tools. Our volume spread analysis tools are the hybrid of volume spread analysis and signal processing theory.
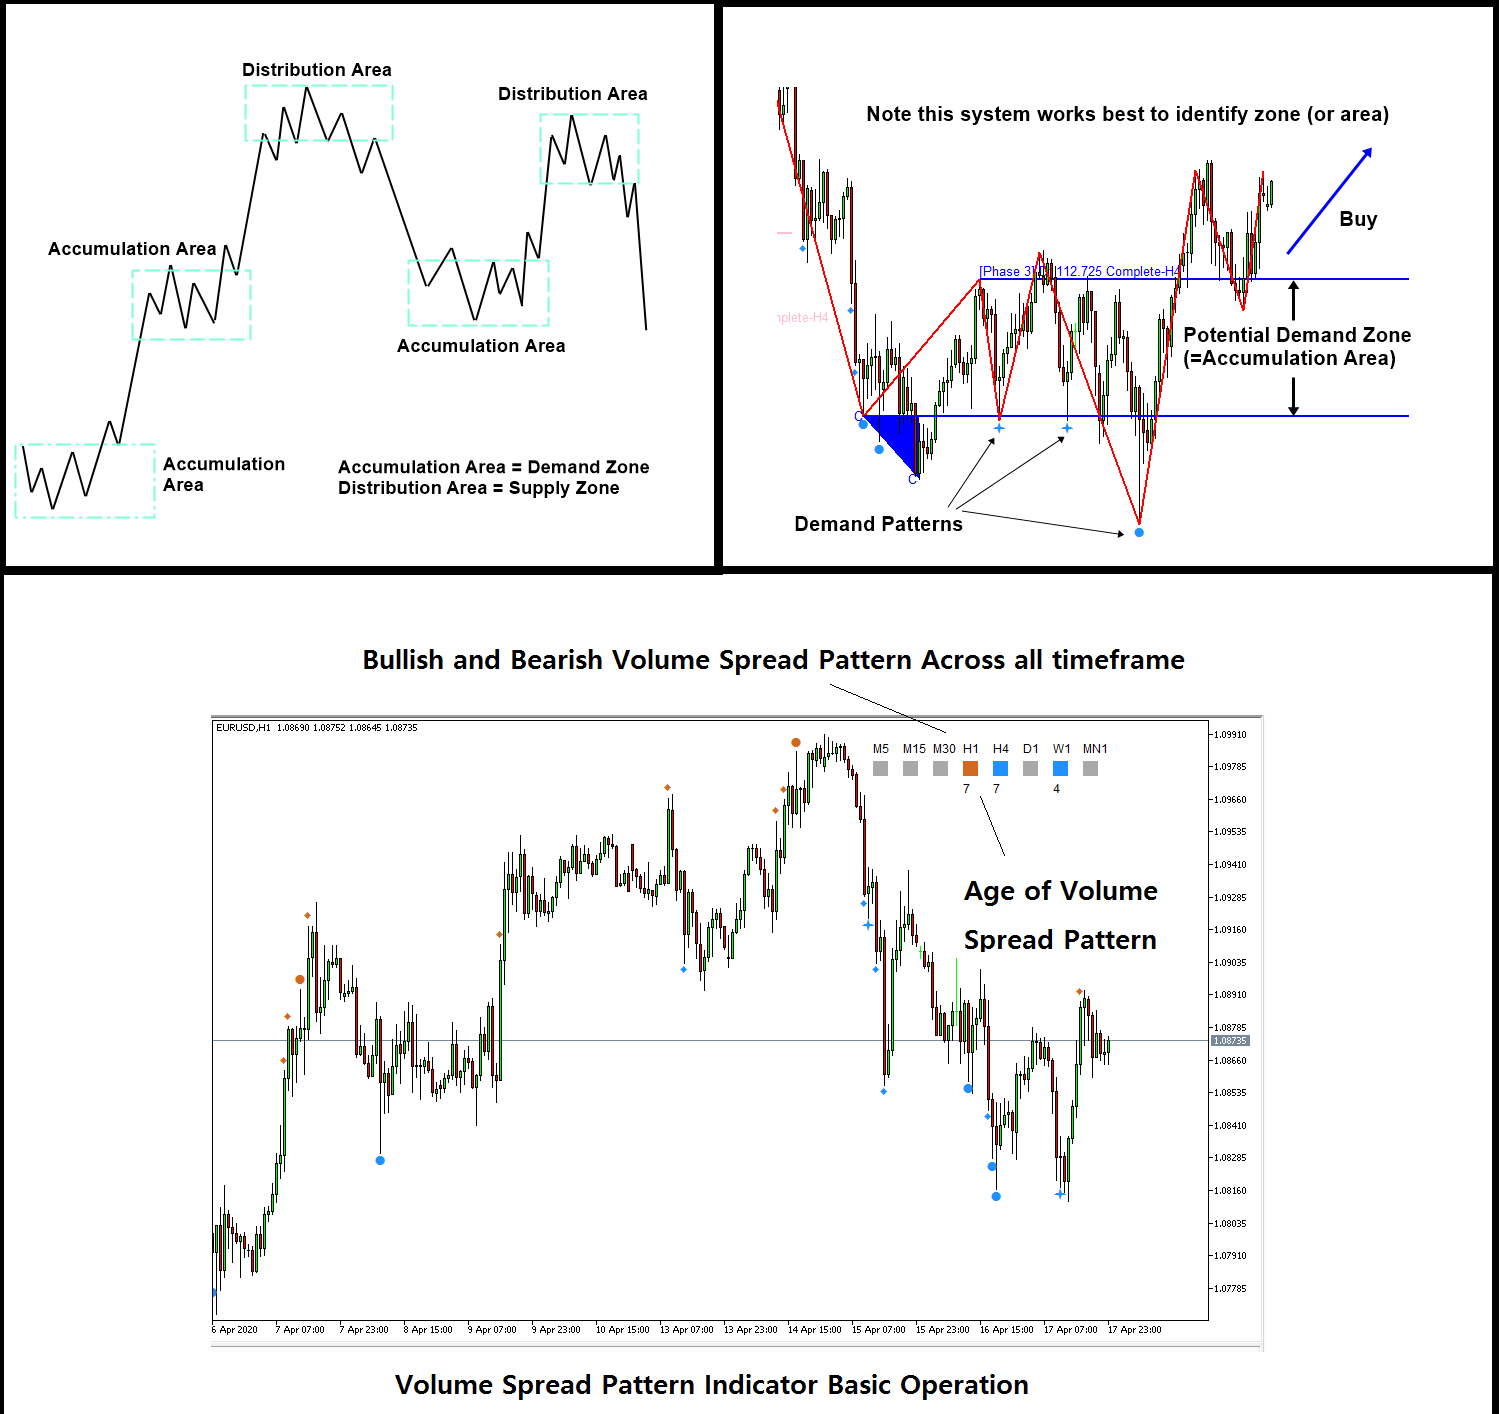
These tools will help you to complete your trading decision with high precision. As long as you understand the concept of the Accumulation and Distribution area in the volume spread analysis, these tools will help you to predict the presence of Accumulation and Distribution area. Hence, you can predict the best trading opportunity.
Firstly, Volume Spread Pattern Indicator is the powerful volume spread analysis indicator that operated across multiple timeframe. Volume Spread Pattern Indicator will not only provide the bearish and bullish volume spread pattern in the current time frame but also it will detect the same patterns across all timeframe. You just need to open one chart and you will be notified bullish and bearish patterns in all timeframe in real time.
Here is the link to Volume Spread Pattern Indicator.
https://www.mql5.com/en/market/product/32961
https://www.mql5.com/en/market/product/32960
https://algotrading-investment.com/portfolio-item/volume-spread-pattern-indicator/
Secondly, Volume Spread Pattern Detector is the light version of Volume Spread Pattern Indicator above. This is free tool with some limited features. However, Volume Spread Pattern Detector is used by thousands of traders. Especially, it works great with the support and resistance to confirm the turning point. This is free tool. Just grab one.
https://www.mql5.com/en/market/product/28438
https://www.mql5.com/en/market/product/28439
https://algotrading-investment.com/portfolio-item/volume-spread-pattern-detector/
Both Volume Spread Pattern Indicator and Volume Spread Pattern Detector works well with Excessive Momentum indicator as Excessive Momentum indicator helps to detect the potential Accumulation and Distribution area automatically. Hence, if you are using Excessive Momentum Indicator, then you can use one between Volume Spread Pattern Indicator or Volume Spread Pattern Detector. In addition, we provide the YouTube video to accomplish the basic operations of Excessive Momentum Indicator.
YouTube Video (Momentum Indicator): https://youtu.be/oztARcXsAVA
Here is link to Excessive Momentum Indicator for MetaTrader 4 and MetaTrader 5.
https://algotrading-investment.com/portfolio-item/excessive-momentum-indicator/
https://www.mql5.com/en/market/product/30641
https://www.mql5.com/en/market/product/30621
Thirdly, we provide the volume Zone Oscillator. This is another useful free tool that utilizes the volume information for your trading. You can use these tools for volume spread analysis, Harmonic Pattern, Elliott Wave Pattern, X3 Price Pattern further. This is free tool. Just grab one.
https://algotrading-investment.com/portfolio-item/volume-zone-oscillator/

Young Ho Seo
Elliott Wave Trend Tutorial 1
In this article, we will provide a simple tutorial for Elliott Wave Trend in Forex and Stock trading. Elliott Wave Trend is a good tool to identify the Elliott Wave Pattern in your chart. With some knowledge of Elliott Wave analysis, this tool get rid of a lot of manual wave analysis to save your time and effort. However, it can be more accurate through as it provides wave score for impulse wave and corrective wave. Elliott Wave Trend provides you a lot of features for your trading. Of course, many automatic analysis in Elliott Wave Trend is handy and convenient. Elliott Wave Trend consists of the following features:
Turning point strength
Turning Point strength Indicator for multiple time frame scanning
Automatic Wave Analysis with Template and Pattern Approach
Manual Wave Analysis with Template and Pattern Approach
Wave Analysis saving and sharing System
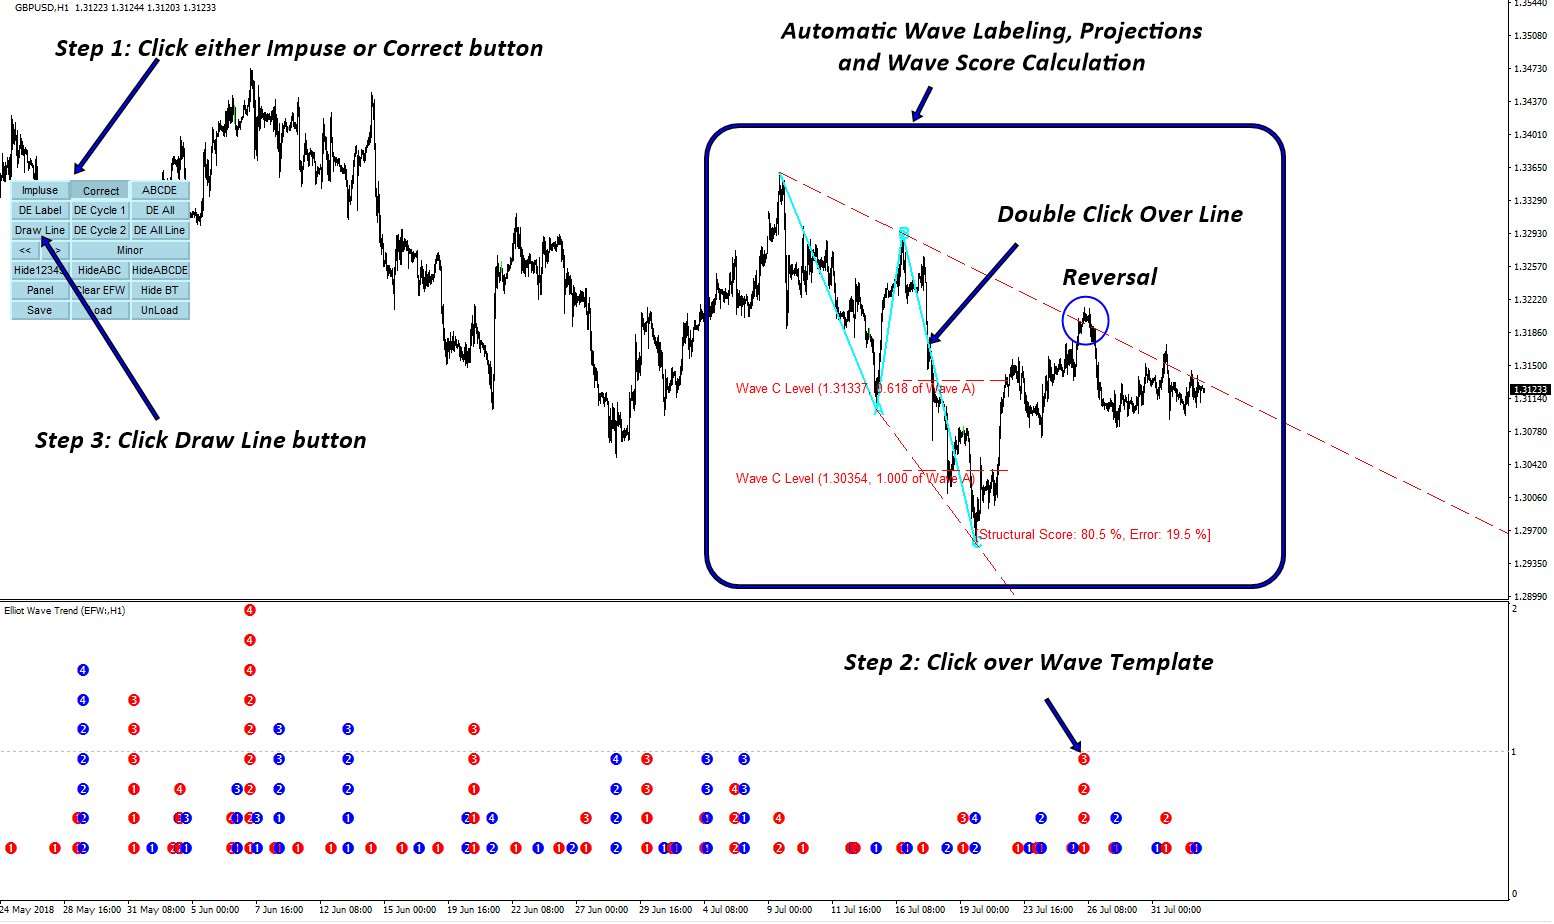
This tutorial is not necessarily covering everything. But this tutorial will try to give some intuition over the automatic Wave Analysis. Automatic Wave Analysis is based on the template and pattern approach described in the book: Financial Trading with Five Regularities of Nature (Scientific Guide to Price Action and Pattern Trading).
Steps to perform the automatic wave analysis.
For Automatic Wave Analysis, you can only perform with Impulse and Corrective Waves.
Click either Impulse or Correct button
Click any wave template in the sub window (i.e. small blue and red circles).
Click Draw Line button.
Use either position rule or Wave Score to accept and to reject your analysis.
Your trading will be based on the levels and turning point projected from your analysis.
Along with this article, you can have a look at this YouTube video about Elliott Wave Analysis. With this video, you will find more practical way of applying Elliott Wave for Forex and Stock trading.
YouTube Link: https://youtu.be/Oftml-JKyKM
Here are the links for Elliott Wave Trend.
https://algotrading-investment.com/portfolio-item/elliott-wave-trend/
https://www.mql5.com/en/market/product/16479
https://www.mql5.com/en/market/product/16472
If you need more complete tutorial on Elliott Wave Analysis, visit this link:
https://algotrading-investment.com/2018/10/25/how-elliott-wave-can-improve-your-trading-performance/
When you want to set any trading alert after you wave analysis, you can use our free Auto Chart Alert.
https://algotrading-investment.com/portfolio-item/auto-chart-alert/

Young Ho Seo
Order Management for Harmonic Pattern
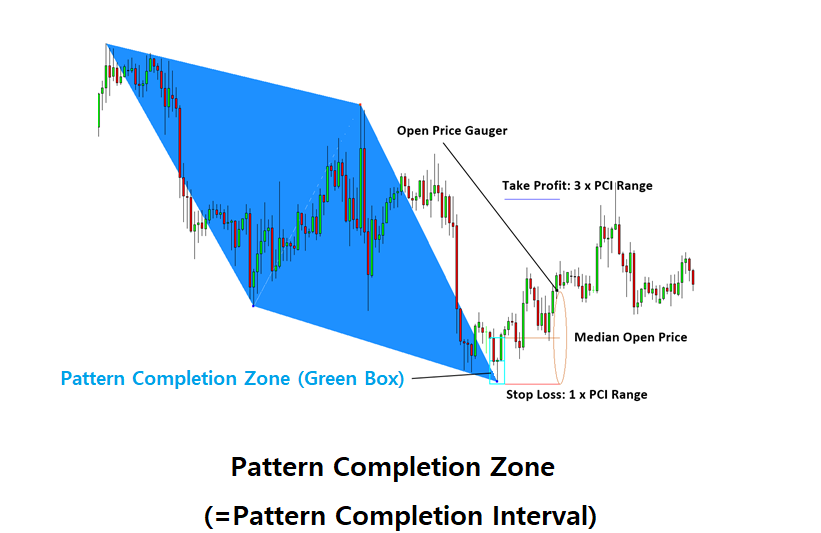
This article will provide some ideas of managing buy and sell orders in Forex trading with the Pattern Compltion Interval in Harmonic Pattern. Many harmonic pattern trader use some arbitrary order management. Some uses Fibonacci levels but they are not able to measure or think how each winning and losing trades can affect their trading balance. You do need to know this to grow your capital safely. Risk and Order management is not the concept you can skip regardless of your trading strategy. So how can we manage buy and sell orders when we are trading with harmonic patterns like Gartley Pattern, Butterfly Pattern, Bat Pattern, Crab Pattern, Cypher Pattern, 5-0 Pattern ? The simple and effective way is to use Pattern Completion Zone. Pattern Completion Zone is a trading zone around Point D of Harmonic Pattern. In Harmonic Pattern, Pattern Completion Zone can help you to achieve the desired Reward to Risk ratio, which is the most important success factor for your trading.
Pattern Completion Interval (=Pattern Completion Zone) was introduced in the Book: Guide to Precision Harmonic Pattern Trading to help you to trade with harmonic pattern with more scientific risk management. Of course, you can find more details about the Pattern Completion Interval from the book.
Link to Book: https://algotrading-investment.com/portfolio-item/guide-precision-harmonic-pattern-trading/
Here is one of many approaches how you may use the Pattern Completion Interval concept for your trading. Of course, this approach is compatible with your Harmonic Pattern Plus and Harmonic Pattern Scenario Planner. We produce this diagram so you can understand this approach intuitively without any calculator in your hands. Tr = Take Profit Ratio and Sr = Stop Loss Ratio. The diagram shows the case of two orders but you can even generate more orders taking this example further. Hopefully this new diagram is easier to understand than previous one.
Of course, this precision trading frame work is inclusive to our Harmonic Pattern Indicators including Harmonic Pattern Plus and Harmonic Pattern Scenario Planner and X3 Chart Pattern Scanner. These indicators are available for both MetaTrader 4 and MetaTrader 5 platforms.
https://algotrading-investment.com/portfolio-item/harmonic-pattern-plus/
https://algotrading-investment.com/portfolio-item/harmonic-pattern-scenario-planner/
https://algotrading-investment.com/portfolio-item/profitable-pattern-scanner/

Young Ho Seo
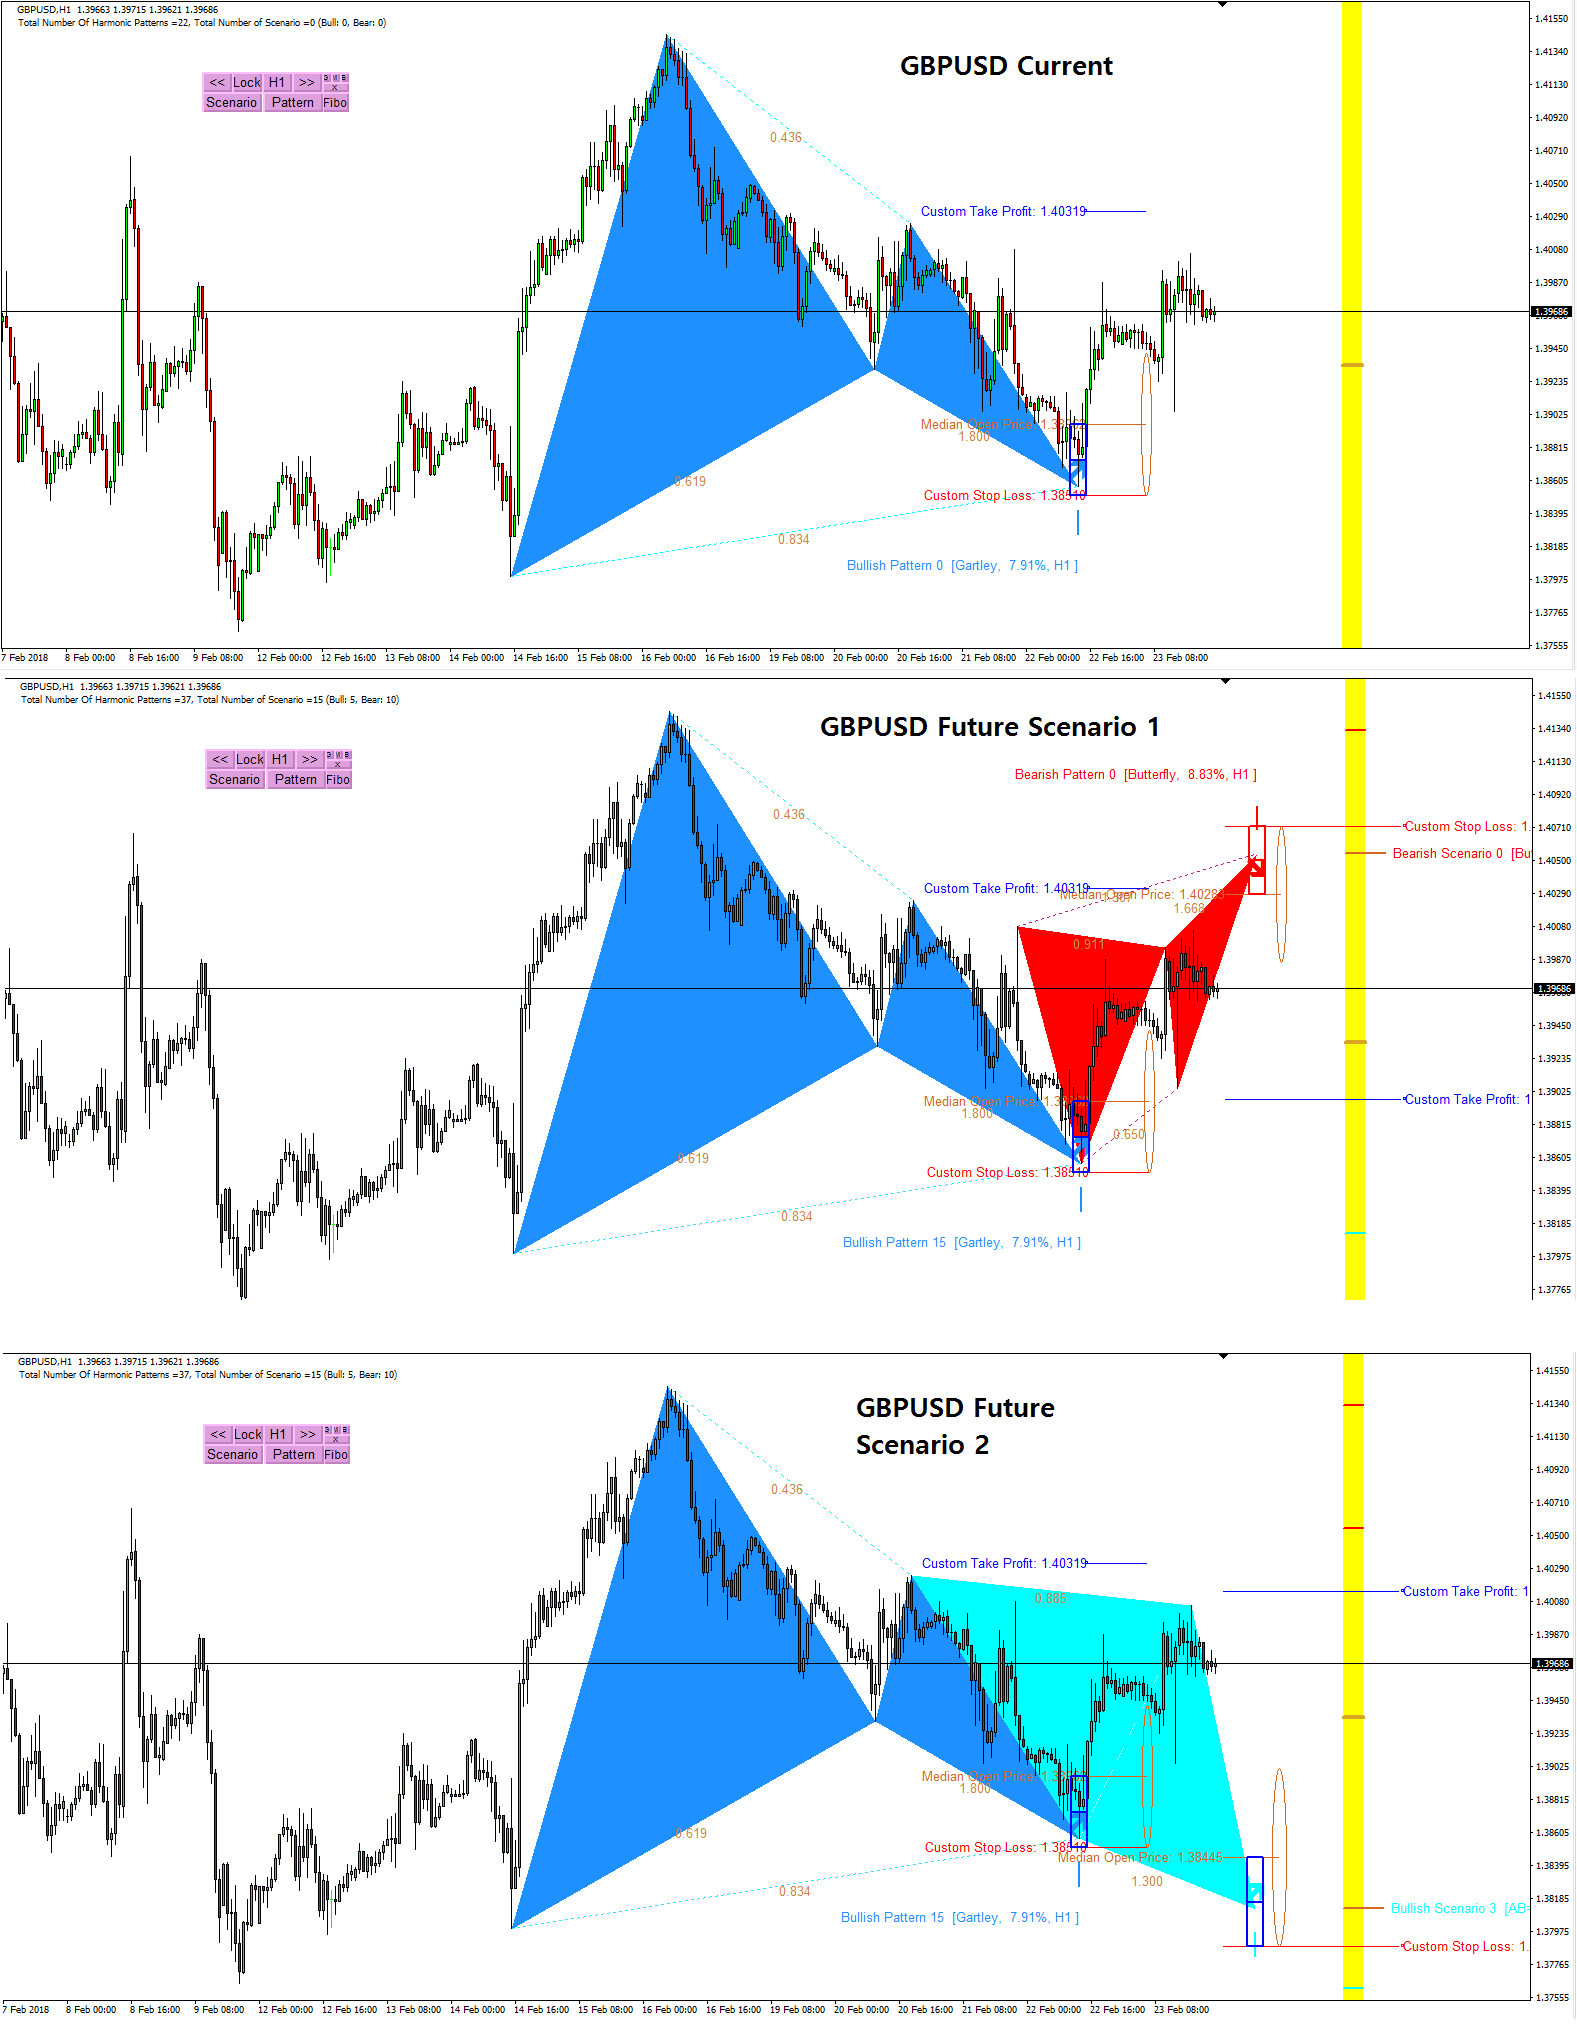
Price Action and Pattern Trading
Price Action, Price Pattern, and Chart Pattern are the direct price analysis used by many top trader in Forex and Stock market. After the intensive research in Forex and Stock market, we found the most powerful weapon is our own intuition or something close to our own intuition. We have ability to detect the risk and profitable opportunity and we are born with this ability naturally. Some people found the ways to transfer this ability for trading and investment. Some people still not have found the ways to use them yet for trading and investment. So what is this ability exactly ? or How to describe this ability in detail ? So you can understand and have some clue about the profitable trading. After removing all the technical language, if we have to say it one word, it is the human’s ability to interpret the geometry of the price. We are naturally born with the ability to recognize or to interpret the geometric pattern like a triangle, circle, squre, rectangle and so on. People often use this ability to interpret the geometry voluntarily and involuntarily to sense the risk and opportunity in our life. It is the same that a successful trader knows how to apply this ability in trading and investment.
Price Action, Price Pattern, and Chart Pattern are the technical language that transfer the ability to interpret the geometry in the financial trading. In another words, Price Action, Price Pattern, and Chart Pattern are the technical analysis that predict the financial market using the geometric pattern. Hence, technically, the price action and pattern trading is based on the pattern recognition ability, which is possessed by all human being. Pattern recognition is the most accurate weapon we have. We use them every day in our life. We use it to find out our friends, lover, enemy, good house, bad house, and so on. For forex and stock trading, this is also the precious weapon to select good stocks and bad stocks to trade. It is also used to predict potential bullish and bearish trend as well as to predict the turning point. Price patterns in charts are aligned with your intuition for your trading. Fortunately, we have made many trials and errors of using this price action, price pattern, and chart pattern in the market to find out the best practical application. Here is one secret of best trading practice.
The very essence of best trading practice come down to the words, “superimposed pattern”. That is to say, that you make trading decision based on multiple of patterns aligned in chart to get the highest accuracy as possible (=superimposed pattern trading). This follows the typical wisdom taught in many trading schools and textbooks, “trade with multiple evidences”.
Geometry and patterns are not rocket science. Anyone can understand and use them for your trading. Some example of superimposed pattern trading principle and some recipes are introduced in my book.
https://algotrading-investment.com/portfolio-item/guide-precision-harmonic-pattern-trading/
https://algotrading-investment.com/portfolio-item/scientific-guide-to-price-action-and-pattern-trading/
At the same time, Harmonic Pattern Scenario Planner is an excellent geometric pattern regognition tool that can predict the bullish and bearish turning point. Harmonic Pattern Scenario Planner is available in both MetaTrader 4 and MetaTrader 5 platform.
https://www.mql5.com/en/market/product/6101
https://www.mql5.com/en/market/product/6240
https://algotrading-investment.com/portfolio-item/harmonic-pattern-scenario-planner/
Here is the great range of technical analysis package for your Price Action and Pattern Trading. We have developed many years to increase your trading performance. These technical analysis tools include the technical indicator, inter-market analysis tools and pattern scanner making the best use of Support, Resistance, Fibonacci Analysis, Harmonic Pattern, Elliott Wave, Supply Demand Analysis, Volume Spread Analysis and Market Volatility.
https://www.mql5.com/en/users/financeengineer/seller
https://algotrading-investment.com/technical-indicator-expert-advisor/

Young Ho Seo
Potential Continuation Zone with Harmonic Pattern
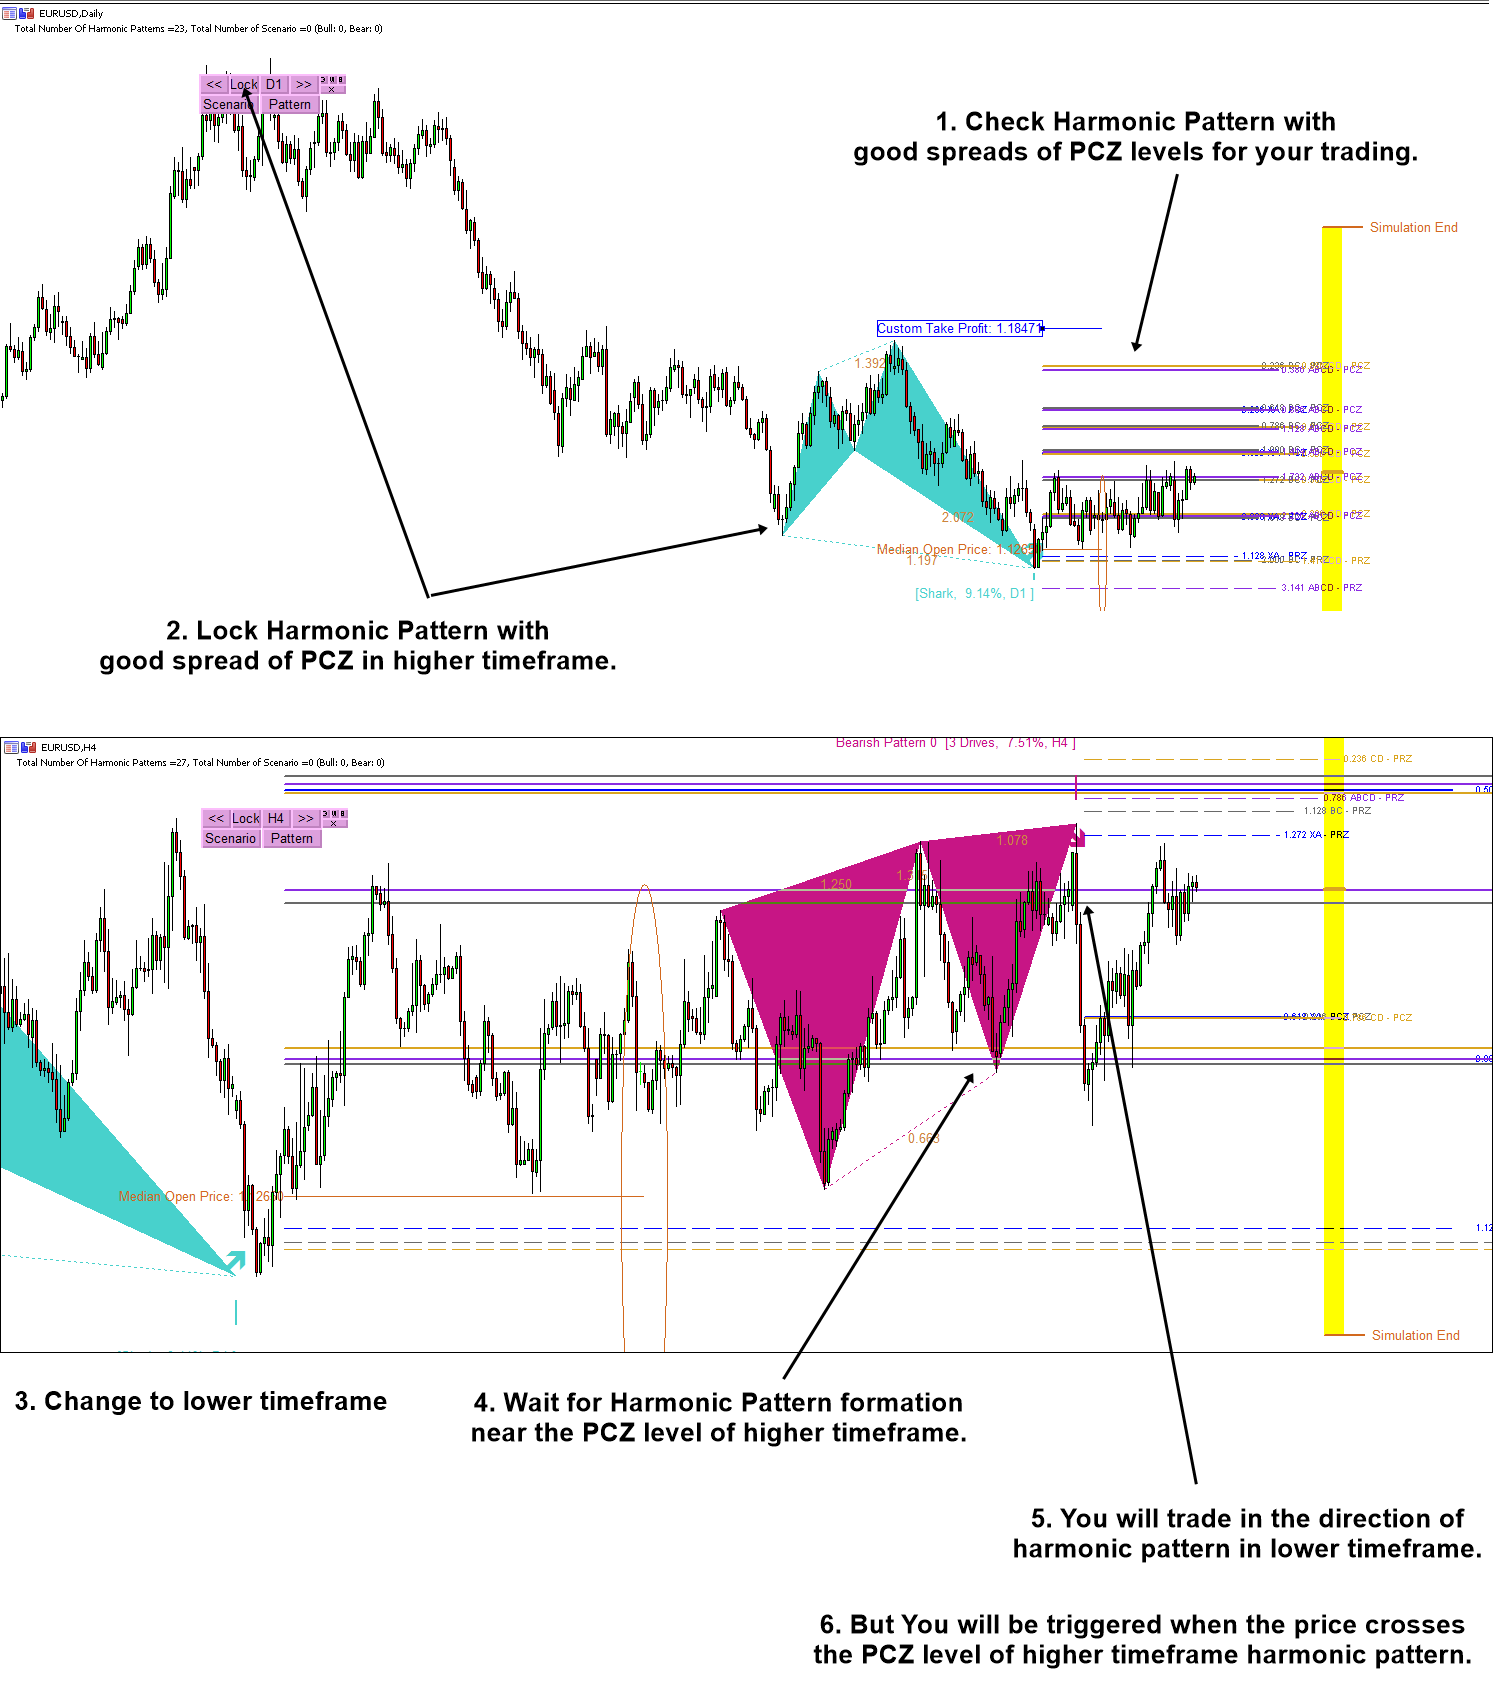
Potential Continuation zone is a powerful concept for Harmonic Pattern Trading. Potential Continuation Zone was introduced first in the book: Guide to Precision Harmonic Pattern Trading. Simply speaking, the potential continuation zone is the opposite concpet to the potential reversal zone (PRZ). Typically, potential continuation zone is placed above the point D of the bullish Harmonic Pattern. Likewise, it is placed below the point D of bearish Harmonic Pattern. At simplest level, you can use the Potential Continuation Zone like support and resistance. Here we will show you how to improve your Harmonic trading marginally using this powerful PCZ concept.
As it was shown in the book, good harmonic patterns for your trading have a well balanced Potential Continuation Zone and Potential Reversal Zone. Typically harmonic patterns with good spread of PCZ levels will help your trading immensely. In this technique, you will be looking at those harmonic patterns in higher timeframe first. Then lock the pattern in your chart. Now change your timeframe to lower like M30 or H1 or H4, etc.
You will wait for the formation of Harmonic pattern near the PCZ level of higher timeframe. Once you have found the harmonic pattern near PCZ level, then there is potential entry for you. You will be triggered when the price crosses the PCZ level and you will trade in the direction of Harmonic pattern in lower timeframe.
This is one of the technique you can trade with Potential Continuation zone. If the formation of harmonic pattern in lower timeframe coincide with Potential Reversal Zone of higher timeframe, you can still make the same trading decision as I have described before.
With this technique, your accuracy of harmonic trading will increase marginally. This technique works well because you have good grab of market insight in both higher and lower timeframe.
Here is further tip when you are using Harmonic Pattern Scenario Planner. In this case, you will follow step 1, 2 and 3 in the screenshot. With Harmonic Pattern Scenario Planner, you can predict potential harmonic pattern formation in advance in lower timeframe. So you could anticipate at which level you will be trading before other trader. Prediction future harmonic pattern is real good stuff from Harmonic Pattern Scenario Planner.
As it was mentioned in the book: Guide to Precision Harmonic Pattern Trading, your best harmonic pattern trading opportunity will appear when you blend the three concepts well in your trading including Potential Reversal Zone, Potential Continuation Zone and Pattern Completion Zone (Or Pattern Completion Interval).
We hope you to become truly incredible trader with our cutting edge trading technology. Here are some excellent Harmonic Pattern Indicators for your trading. We will share the links to the landing page of these Harmonic Pattern indicators. Both Harmonic pattern indicators are available for MetaTrader 4 and MetaTrader 5.
Harmonic Pattern Plus
https://www.mql5.com/en/market/product/4488
https://www.mql5.com/en/market/product/4475
https://algotrading-investment.com/portfolio-item/harmonic-pattern-plus/
Harmonic Pattern Scenario Planner
https://www.mql5.com/en/market/product/6101
https://www.mql5.com/en/market/product/6240
https://algotrading-investment.com/portfolio-item/harmonic-pattern-scenario-planner/

Young Ho Seo
Introduction to Excessive Momentum Indicator
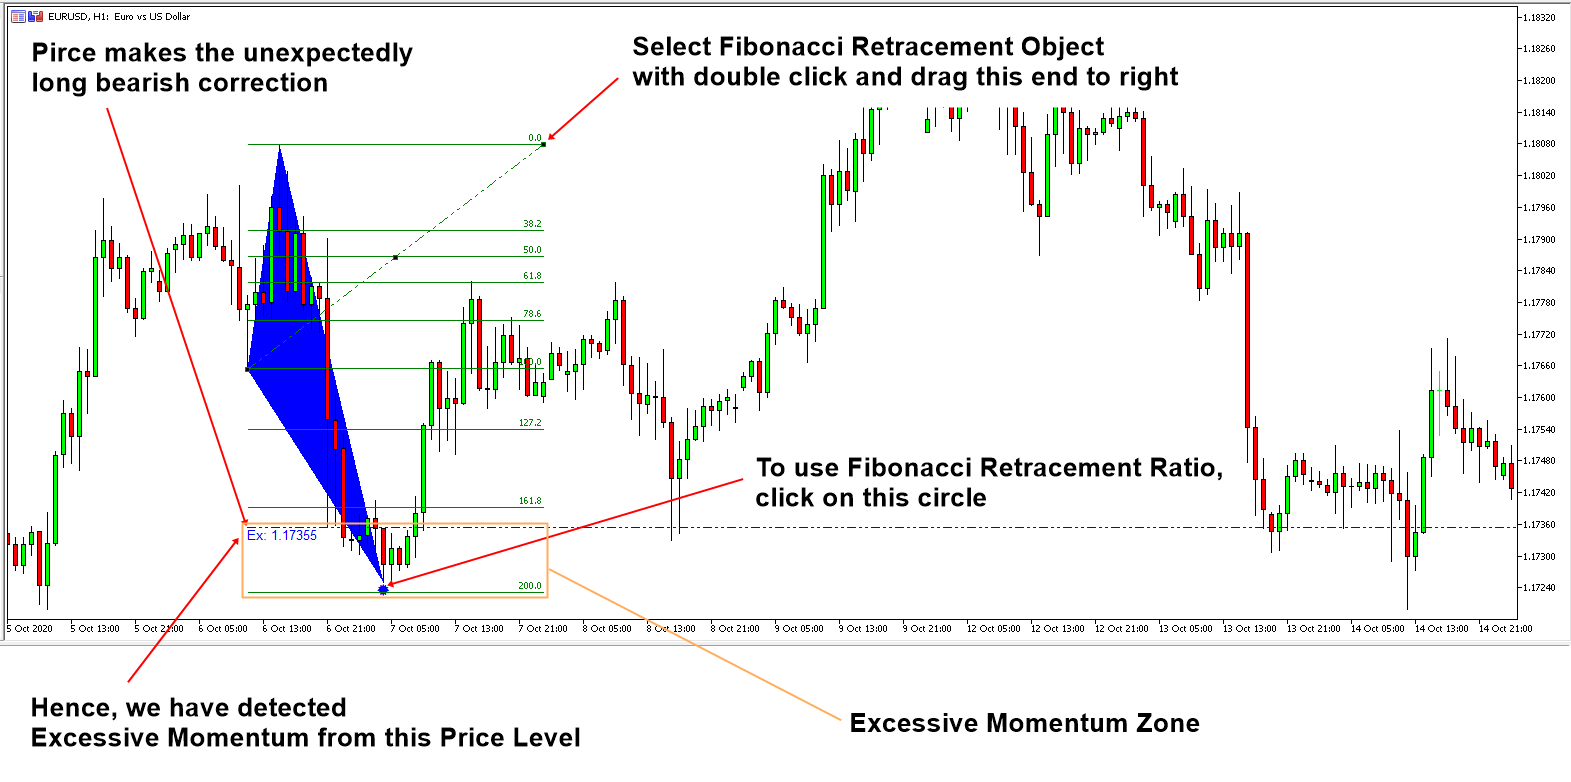
Momentum trading is often used by the experienced trader. One innovative way to use the momentum trading is to trade with the excessive momentum. Excessive momentum is the technique to identify unusually strong supply or unusually strong demand by analyzing the price series. Why do we need to care about the unusually strong supply or unusually strong demand in our trading? It is because unusually strong supply or unusually strong demand are the sign of the end of the current trend ( or birth of new trend). As you probably guess, when the new trend is born, you can ride the highest profit as possible. Hence, the excessive momentum can provide you the attractive entries for your trading.
Excessive Momentum Indicator provides you the ability to detect the excessive momentum in Forex and Stock chart. Let us start this simple introduction. Firstly, understand that the excessive momentum could possibly point out some anomaly movement or anomaly momentum in the market. To help your understanding, you can consider the insufficient momentum (i.e. exceptionally low volatility market or sideways market) as the opposite concept against excessive momentum. Our Excessive momentum indicator provides the automatic way of measuring the excessive momentum in your chart.
Once Excessive momentum is detected, then it will draw the Fibonacci Levels in the important area in your chart automatically. Then you can take this as your trading entry. It is simple and easy to trade. Most importantly, it is the powerful momentum indicator that alarm you the important trading entry and exit in advance.
https://algotrading-investment.com/portfolio-item/excessive-momentum-indicator/
https://www.mql5.com/en/market/product/30641
https://www.mql5.com/en/market/product/30621
You can watch this YouTube Video about this Excessive Momentum Indicator.
Youtube: https://www.youtube.com/watch?v=oztARcXsAVA
You can read the full article: introduction to Momentum Trading. In this article, you will find how to unlock the potential of the excessive momentum trading. In addition, this article will provide you some introduction to Volume Spread Analysis.
https://algotrading-investment.com/2018/10/29/introduction-to-momentum-trading/

Young Ho Seo
Non Repainting and Non Lagging Harmonic Pattern Scanner
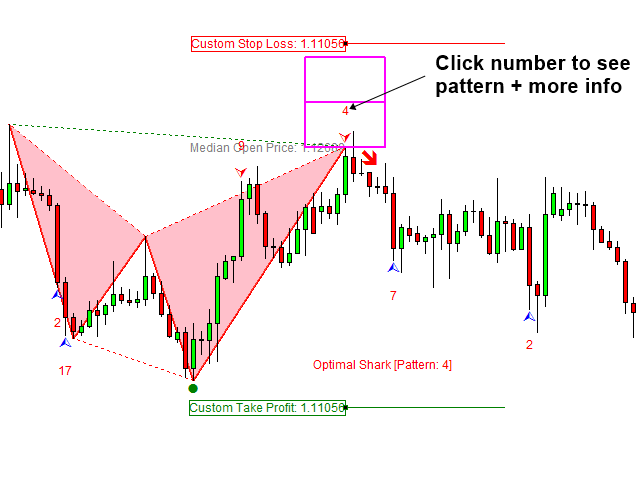
X3 Chart Pattern Scanner is the world first Non Repainting and Non Lagging Harmonic Pattern Scanner. Harmonic pattern indicator and scanner help you to automatically detect the Harmonic Patterns like Gartley Pattern, Butterfly Pattern, Bat Pattern, Crab Pattern, Cypher Pattern, 5-0 Pattern and so on. If you have used the automated Harmonic Pattern Scanner, then you probably know some specific facts about the harmnic pattern indicators in regards to repainting. Repaintng is a fact you should know about when you buy Harmonic Pattern indicators and Scanners on the internet. It does not matter which website you get from or which company you get from or what price you get from, the automated Harmonic Pattern indicator and Scanner can be repainting and if not, then they will lag behind the actual Harmonic Pattern signal. In addition, they will not show the fully synchronized real time signal like you can observe the historical signals in your chart. This can confuse the real trading performance or success rate of your trading strategy with Harmonic Pattern.
Despite of the fact that many trader uses Harmonic Pattern indicators and Scanners, this happens due to the technological limitation. Harmonic Pattern provides the fast signal entry comparing to other techncial indicator. Instead of this fast signal, they are repainting. Hence, there is a trade off between the fast signal and repainting. Think about the moving average or other technical indiactor. In terms of the trading signal, they mostly lags behind the actual turning point due to the smoothing algorithm used in the techncial indicator. This is to say that it is very hard to build the Harmonic Pattern Detection indicator that gives you the fast trading signal without repainting. Even if someone build that non repainting Harmonic Pattern indicator, finding the consistency between real time signal and historical signals are another story. But everyone want to have this sort of dream Harmonic Pattern Indicator even though techncially such a harmonic pattern indicator is really hard to build.
After the intensive research, X3 Chart Pattern Scanner is the game changer for everyone. It does not repaint or lag. It will provide you pattern at turning point but you do not have to worry about if incomplete harmonic pattern will disappear from the chart or not. It will provide the real trading signal as you can see in the historical signals in your chart. You can backtest your trading logic with any secondary confirmation from your chart. Hence, you can base your trading entry and exits as you perceived from your chart. In another words, you can trade as you see from your chart. All other Harmonic Pattern scanner does not provide this sort of direct backtesting capability in your chart.
As a bonus, X3 Chart Pattern Scanner provides around 52 Japanese candlestick patterns + Advanced automatic channel function to improve your trading performance. Of course, there are tons of other powerful features for your trading. You can find those features from the landing page of X3 Chart Pattern Scanner. Below is the link to X3 Chart Pattern Scanner in MetaTrader 4 and MetaTrader 5.
https://algotrading-investment.com/portfolio-item/profitable-pattern-scanner/
https://www.mql5.com/en/market/product/41992
https://www.mql5.com/en/market/product/41993
Here are some YouTube Videos about Non Repainting Harmonic Pattern Scanner. This Youtube video will explain some features of X3 Chart Pattern Scanner, the non repainting, non lagging harmonic pattern and Elliott Wave pattern indicator. Please watch the video to find out more about the non repainting Harmonic Pattern indicator.
YouTube: https://www.youtube.com/watch?v=uMlmMquefGQ&feature=youtu.be
YouTube: https://www.youtube.com/watch?v=2HMWZfchaEM
However, if you do not mind repainting or historical backtesting, then we provide the powerful Harmonic Pattern indicator at affordable price. For example, Harmonic Pattern Plus and Harmonic Pattern Scenario Planner are the repainting Harmonic Pattern Indicator with tons of powerful features. You can have a look what powerful features are included inside Harmonic Pattern Plus and Harmonic Pattern Scenario Planner from the link below. Most importantly, they come at affordable price and they are easy to use. Please have a look at the link below.
https://algotrading-investment.com/2018/11/03/harmonic-pattern-plus-introduction-2/

Young Ho Seo
Mean Reversion Supply Demand – How to Remove Take Profit and Stop Loss Levels
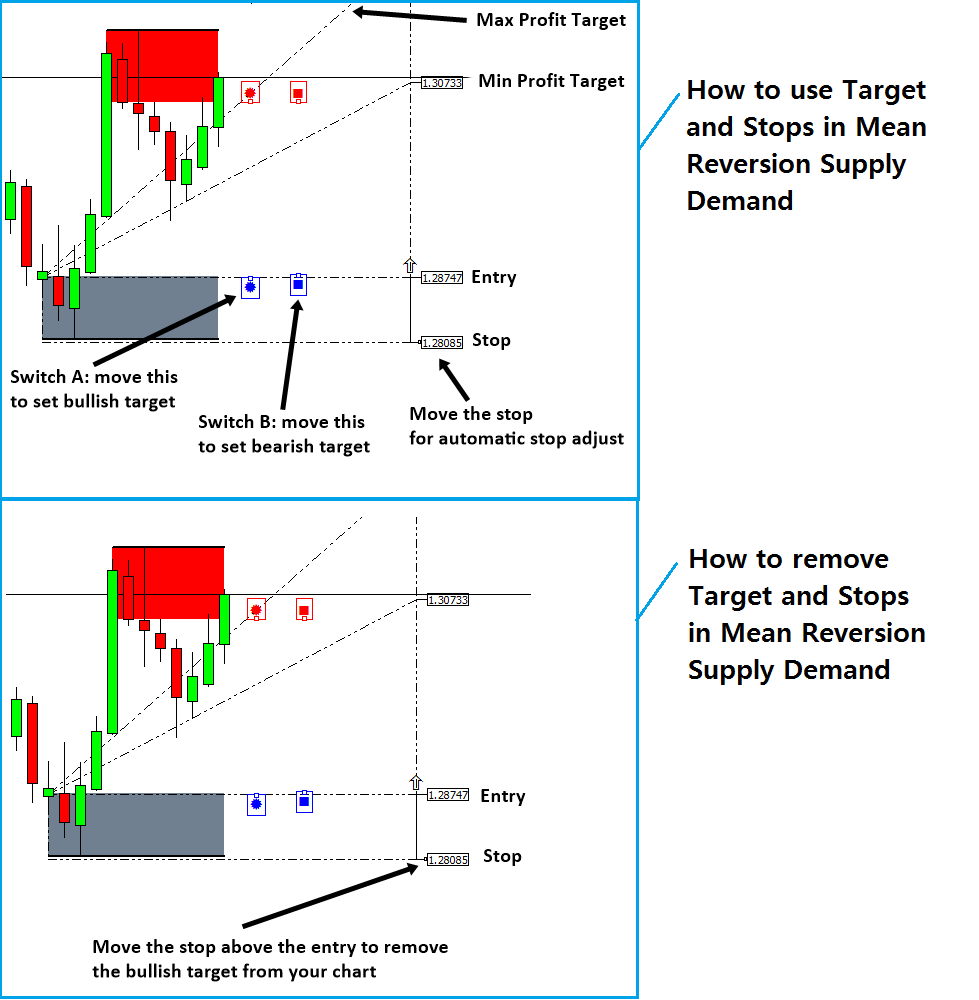
One of the greatest advantage of Mean Reversion Supply Demand is that it provide a flexible Profit and stop target for your trading. After you have learnt how to use this profit targets, now you want to learn how to remove them. Of course, there is a way to remove them. The trick is simply moving the stop text above the Entry text (for the case of buy). You will do the opposite for the case of sell. In the screenshot, the bottom image describe how to remove the targets from your chart.
There is another approach to remove take profit and stop loss targets. We provide the shortcut in keyboard for doing the same task. Simply hit “z” button in your keyboard. This will also remove the stop loss and take profit targets if you do not need them any longer.
https://www.mql5.com/en/market/product/16823
https://www.mql5.com/en/market/product/16851
https://algotrading-investment.com/portfolio-item/mean-reversion-supply-demand/

Young Ho Seo
Stop Loss and Take Profit with Harmonic Pattern
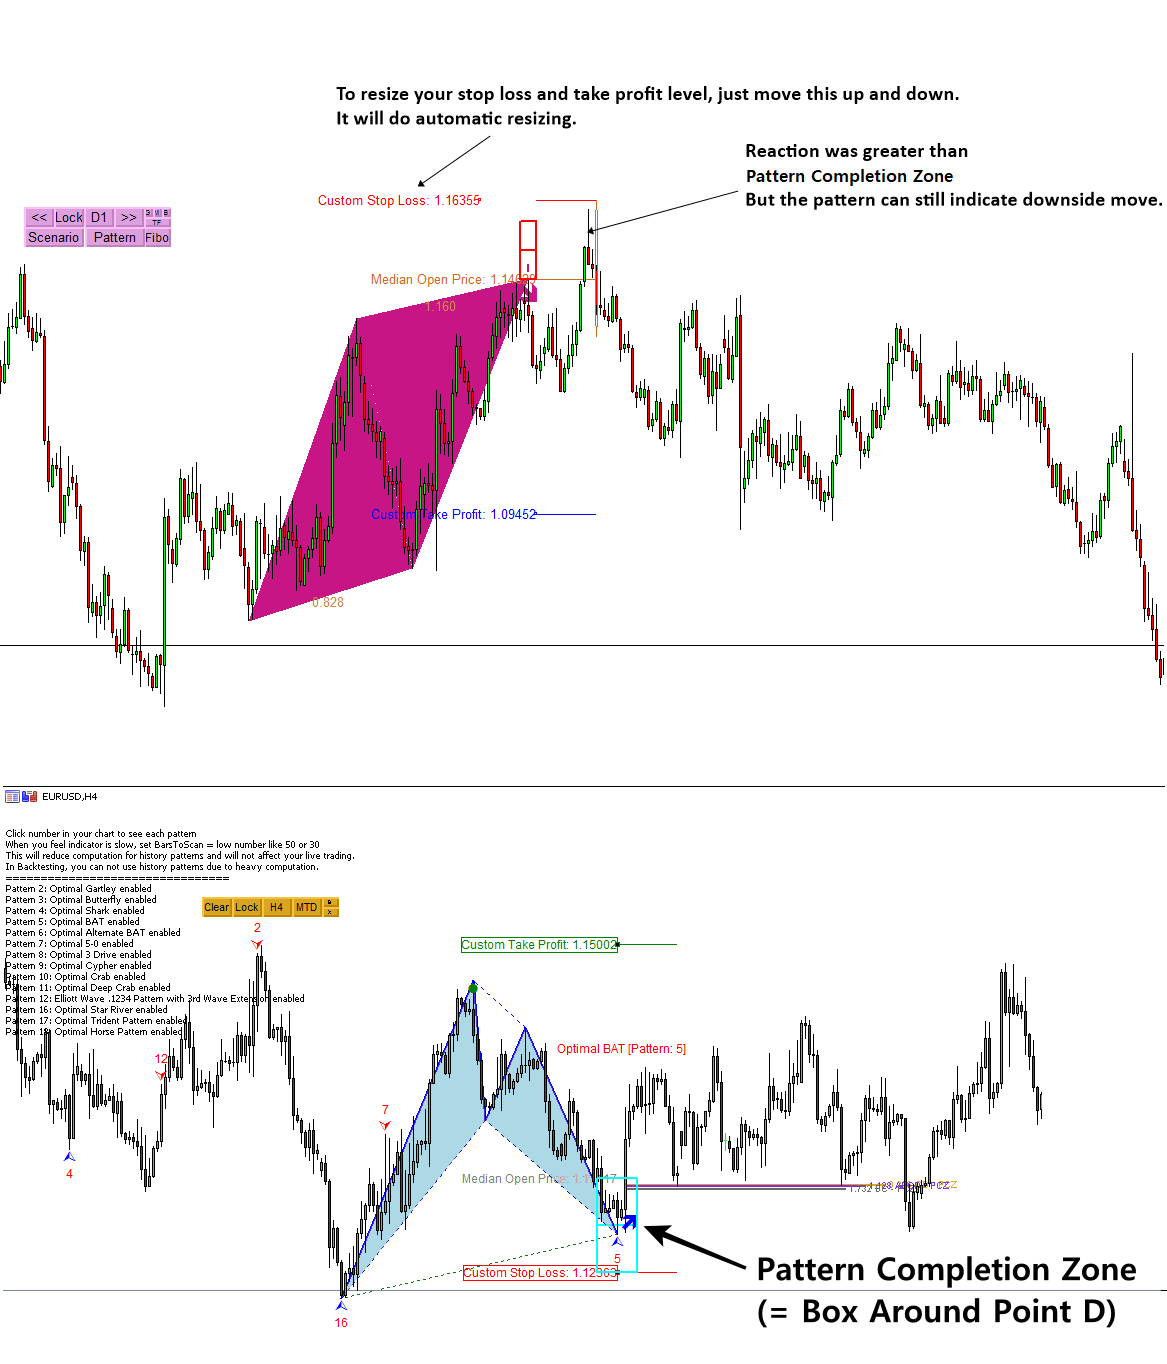
In this article, we will explain how to set stop loss and take profit with Harmonic Pattern. For any professional trading strategy, there are ways to set stop loss and take profit. Fortunatley, Harmonic Pattern can provide easy way to set stop loss and take profit with Pattern Completion Zone. Pattern Completion zone is not the rocket science. It is a rectangle box drawn around the point D of any Harmonic Pattern. It can be drawn for any Harmonic Patterns including Gartley Pattern, Butterfly Pattern, Bat Pattern, Crab Pattern, Cypher Pattern, 5-0 Pattern and so on.
You can consider the pattern completion zone as the trading zone simply speaking. If you are not sure what is the trading zone, then think it as the price range, often used in the support resistance trading or supply demand trading or volume spread analysis or any other technical anlaysis. You can read more about the pattern completion zone and trading zone in Guide to Precision Harmonic Pattern Trading. However, if you have not read the book yet, we can assume it as the price range around the point D in the Harmonic Pattern. Typically, the pattern completion zone will be provided with Harmonic Pattern Indicator or Scanner you are using for the purpose of the risk management. Pattern completion zone is useful to visualize the price trajectory around the point D of the Harmonic Pattern. For example, price can have several trajectory inside or outside the pattern completion zone.
With the Pattern Completion Zone, sometimes you can observe that price can penetrate through the pattern completion zone. Sometimes, price might just make a good turning point within the Pattern Completion Zone. This implies that we need to set the sensible stop loss when we trade with the turning point. This means that we need to watch out the size of the stop loss and take profit. In another words, we need to think about Reward to Risk ratio. This is really important quantity to understand if you want to become a profitable trader.
You can read more about setting stop loss and take profit with Harmonic Pattern from this original article. The original article will provide through guide on setting stop loss and take profit with Harmonic Pattern.
https://algotrading-investment.com/2019/03/22/stop-loss-and-take-profit-with-harmonic-pattern/
Below, we provide the landing page for Harmonic Pattern Plus, Harmonic Pattern Scenario Planner and X3 Chart Pattern Scanner for your information.
Harmonic Pattern Plus
One of the first automated Harmonic Pattern detection tool released in 2014. It can detect 11 most popular harmonic patterns with well-defined trading entries and stops. Pattern Completion Interval, Potential Reversal Zone and Potential Continuation Zone are supported. In addition, other dozens of powerful features are added like Japanese candlestick detection, etc. Because of affordable price, this harmonic pattern detection indicator is loved by many traders. Please note that this is repainting and non lagging harmonic pattern trading system.
https://www.mql5.com/en/market/product/4488
https://www.mql5.com/en/market/product/4475
https://algotrading-investment.com/portfolio-item/harmonic-pattern-plus/
Harmonic Pattern Scenario planner
It is an advanced Harmonic Pattern indicator. On top of the features of Harmonic Pattern Plus, you can also predict future harmonic patterns through simulation. This is the tactical harmonic pattern tool designed for Professional harmonic pattern trader. Because of affordable price, this harmonic pattern detection indicator is loved by many traders. Please note that this is repainting and non lagging harmonic pattern trading system.
https://www.mql5.com/en/market/product/6240
https://www.mql5.com/en/market/product/6101
https://algotrading-investment.com/portfolio-item/harmonic-pattern-scenario-planner/
X3 Chart Pattern Scanner
Both Harmonic pattern plus and Harmonic Pattern Scenario planner are the excellent trading system at affordable cost. However, if you do not like repainting Harmonic pattern indicator, then we also provide the non repainting and non lagging harmonic pattern trading. Indeed, the X3 Chart Pattern Scanner is the most advanced Harmonic Pattern and Elliott Wave pattern scanner. Beside, X3 Chart Pattern Scanner provides many other powerful features like the customizable option and advanced channel and so on
https://www.mql5.com/en/market/product/41993
https://www.mql5.com/en/market/product/41992
https://algotrading-investment.com/portfolio-item/profitable-pattern-scanner/

Young Ho Seo
Harmonic Pattern Indicator Explained
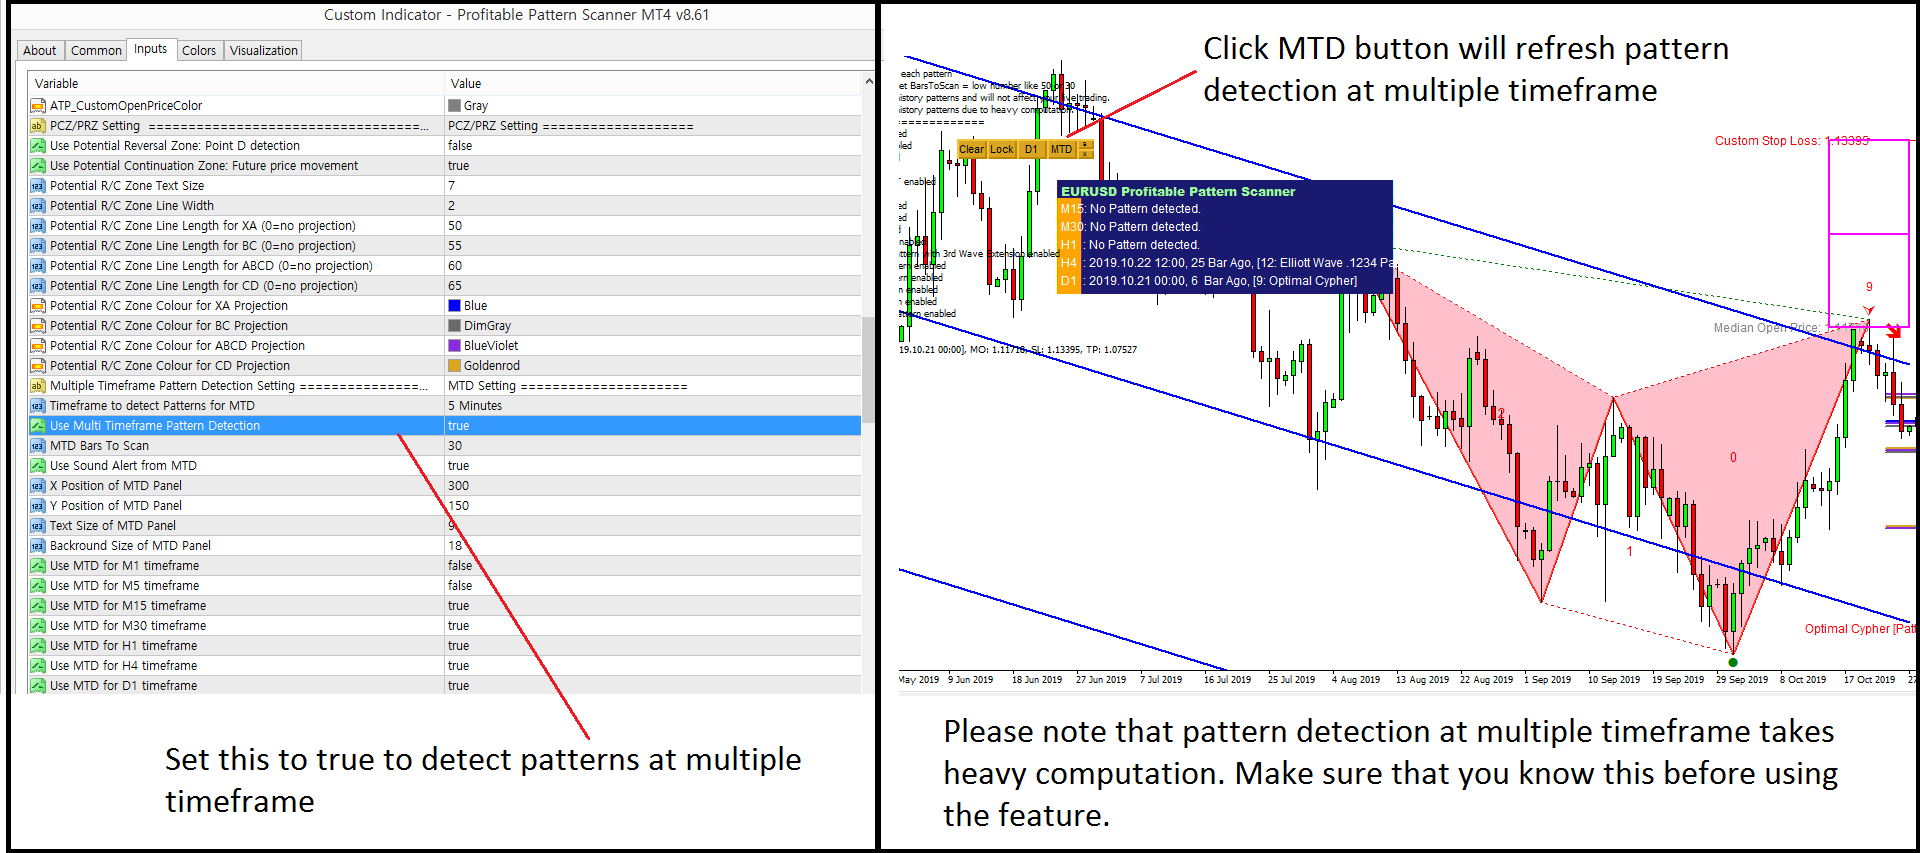
In this article, we will explain the type of Harmonic Pattern Indicator used for Forex and Stock trading. Firstly, there are several variations of Harmonic pattern indicators used by the trading community. Not all the harmonic pattern indicators are the same. The main variations of Harmonic pattern indicators can be categorized as following three different types depending on the algorithm used inside the indicator. Each type of Harmonic Pattern Indicator has its own pros and cons. We will go through each type of Harmonic Pattern Indicator in this article one by one. In addition, we will also discuss the hybrid of these three variations, called non repainting and non lagging Harmonic Pattern Indicator at the end of this article for your information.
Type 1: Non lagging (fast signal) but repainting – option to enter from turning point. Indicator does not show the failed pattern in chart and last pattern can repaint.
Type 2: Lagging (slow signal) but non repainting – no option to enter at turning point. Indicator does not show the failed pattern but last pattern does not repaint.
Type 3: Detecting pattern at point C but repainting – option to enter at turning point. Indicator detect pattern too early and you have to wait until the point D. Pattern may not achieve point D. Indicator does not show the failed pattern and last pattern can repaint.
Type 1. Non lagging (fast signal) but repainting
First type is non lagging but repainting harmonic indicators. This sort of Harmonic pattern indicator is the typical harmonic pattern indicators used by many traders. The advantage is that you do get the signal early as possible. You have an opportunity to trade from the turning point all the ways down to the continued trend. The disadvantage is that you are not able to test your strategy in chart because this type of harmonic pattern indicator does not show the entry of the failed patterns in chart but only successful one. In fact, Harmonic Pattern Plus and Harmonic Pattern Scenario Planner are under this category. They would provide the fastest signal but you will not able to test your strategy in your chart because they do not show the failed entry in chart.
You can read everything about Harmonic Pattern Indicator from this original article.
https://algotrading-investment.com/2019/03/03/harmonic-pattern-indicator-explained/
We will introduce several Harmonic Pattern Indicator based on what we have discussed so far in this article.
X3 Chart Pattern Scanner (Non Repainting + Non Lagging)
Below is the link to X3 Chart Pattern Scanner in MetaTrader 4 and MetaTrader 5 platform. X3 Chart Pattern Scanner is non repainting and non lagging Harmonic Pattern Indicator. In addition, each Harmonic Pattern in X3 Chart Pattern Scanner can be customized to improve trading performance. With tons of powerful features toward the day trading, this is the next generation Harmonic Pattern Indicator.
https://www.mql5.com/en/market/product/41993
https://www.mql5.com/en/market/product/41992
https://algotrading-investment.com/portfolio-item/profitable-pattern-scanner/
In addition, we will introduce two Harmonic Pattern Indicator including Harmonic Pattern Plus and Harmonic Pattern Scenario planner. These Harmonic Pattern Indicator is repainting. However, they provide tons of powerful features at affordable price. Hence, if you do not mind the repainting Harmonic Pattern Indicator, then you can use these two tools. In addition, you can use X3 Chart Pattern Scanner together with Harmonic Pattern Plus or Harmonic Pattern Scenario Planner.
Harmonic Pattern Plus (Type 1)
Harmonic pattern plus is extremely good product for the price. With dozens of powerful features including Pattern Completion Interval, Potential Reversal Zone, Potential Continuation Zone, Automatic Stop loss and take profit sizing.
Below are the Links to Harmonic Pattern Plus
https://www.mql5.com/en/market/product/4488
https://www.mql5.com/en/market/product/4475
https://algotrading-investment.com/portfolio-item/harmonic-pattern-plus/
Harmonic Pattern Scenario Planner (Type 1 + Predictive feature)
With additional features of predicting future harmonic patterns, this is very tactical harmonic pattern indicator with advanced simulation capability on top of the powerful features of harmonic pattern plus.
Below are the Links to Harmonic Pattern Scenario Planner
https://www.mql5.com/en/market/product/6101
https://www.mql5.com/en/market/product/6240
https://algotrading-investment.com/portfolio-item/harmonic-pattern-scenario-planner/

Young Ho Seo
Advanced Supply Demand Zone Indicator
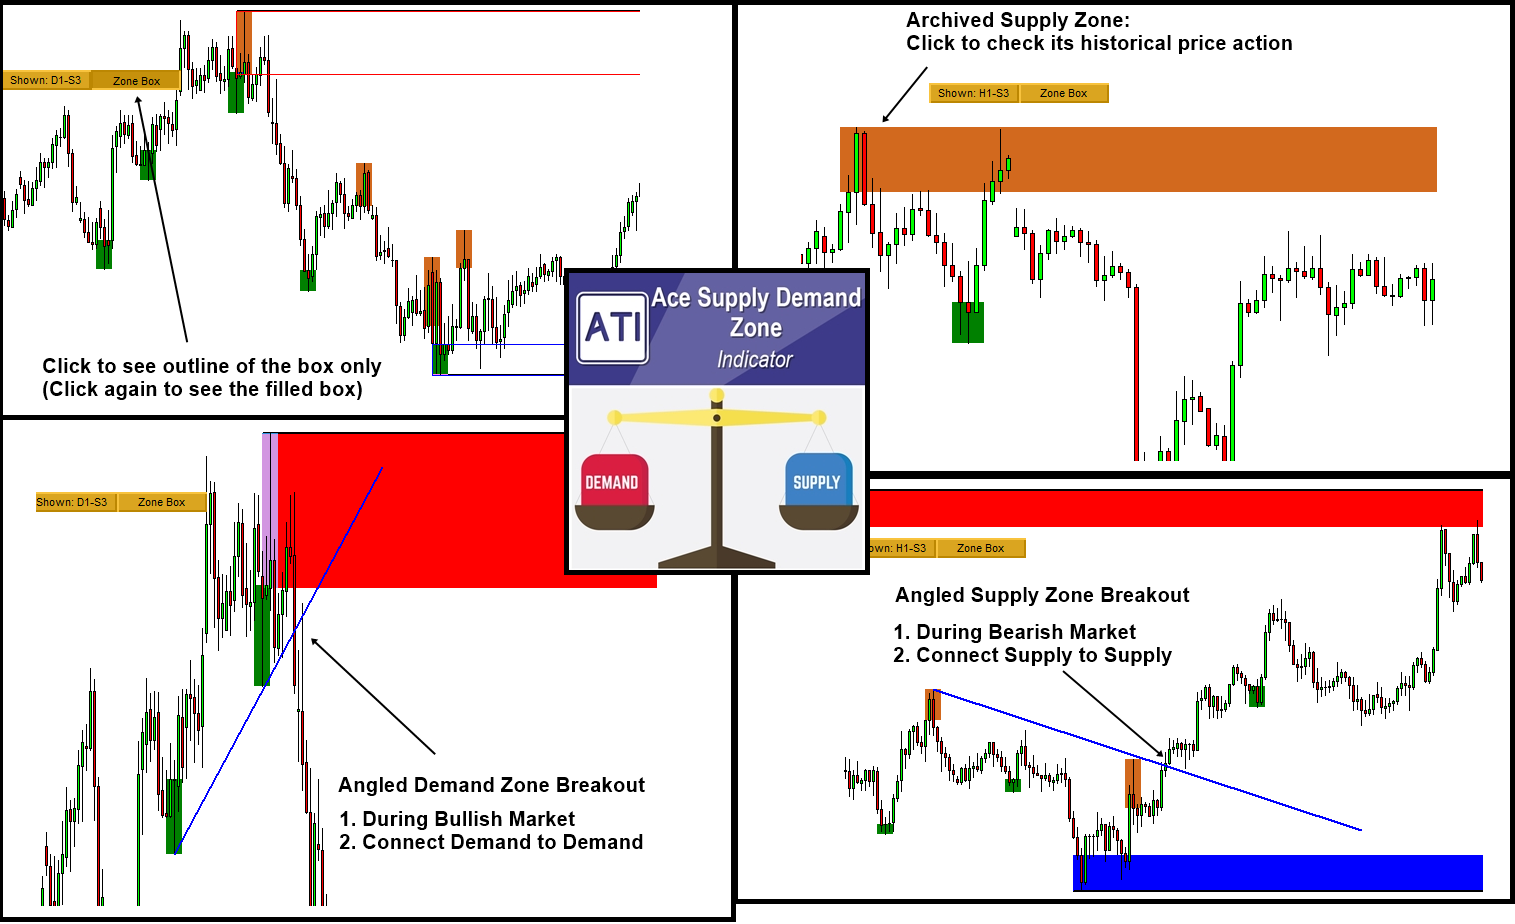
Here is the list of Advanced Supply Demand Zone Indicator. These supply and demand zone indicators are rich in features with many powerful features to help you to trade the right supply and demand zone to trading.
Mean Reversion Supply Demand
Mean Reversion Supply Demand indicator is our earliest supply demand zone indicator and loved by many trader all over the world. It is great to trade with reversal and breakout. You can also fully setup your trading with stop loss and take profit target.
Below are the links to the Mean Reversion Supply Demand indicator for MetaTrader 4/MetaTrader 5.
https://www.mql5.com/en/market/product/16823
https://www.mql5.com/en/market/product/16851
https://algotrading-investment.com/portfolio-item/mean-reversion-supply-demand/
Ace Supply Demand Zone
Ace Supply Demand Zone indicator is our next generation supply demand zone indicator. It was built in non repainting and non lagging algorithm. On top of many powerful features, you can also make use of archived supply and demand zone in your trading to find more accurate trading opportunity.
Below are the links to the Ace Supply Demand Zone indicator for MetaTrader 4/MetaTrader 5.
https://www.mql5.com/en/market/product/40076
https://www.mql5.com/en/market/product/40075
https://algotrading-investment.com/portfolio-item/ace-supply-demand-zone/
For your information, both mean reversion supply demand and Ace supply demand zone indicator uses completely different algorithm in detecting supply and demand zone.

Young Ho Seo
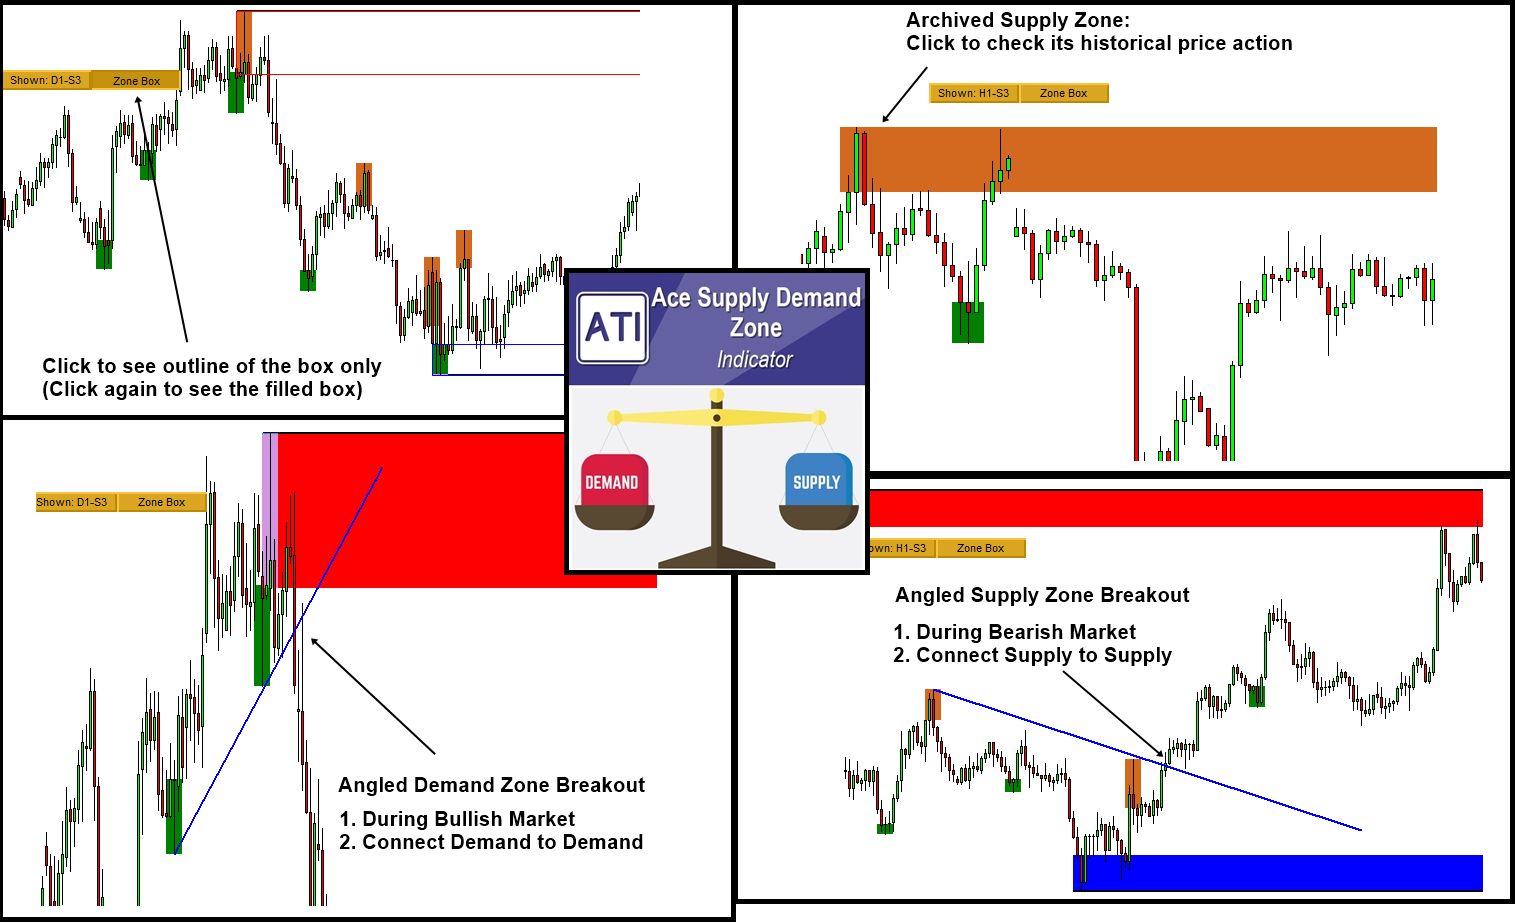
Advanced Supply Demand Zone Indicator
Here is the list of Advanced Supply Demand Zone Indicator. These supply and demand zone indicators are rich in features with many powerful features to help you to trade the right supply and demand zone to trading.
Mean Reversion Supply Demand
Mean Reversion Supply Demand indicator is our earliest supply demand zone indicator and loved by many trader all over the world. It is great to trade with reversal and breakout. You can also fully setup your trading with stop loss and take profit target.
Below are the links to the Mean Reversion Supply Demand indicator for MetaTrader 4/MetaTrader 5.
https://www.mql5.com/en/market/product/16823
https://www.mql5.com/en/market/product/16851
https://algotrading-investment.com/portfolio-item/mean-reversion-supply-demand/
Ace Supply Demand Zone
Ace Supply Demand Zone indicator is our next generation supply demand zone indicator. It was built in non repainting and non lagging algorithm. On top of many powerful features, you can also make use of archived supply and demand zone in your trading to find more accurate trading opportunity.
Below are the links to the Ace Supply Demand Zone indicator for MetaTrader 4/MetaTrader 5.
https://www.mql5.com/en/market/product/40076
https://www.mql5.com/en/market/product/40075
https://algotrading-investment.com/portfolio-item/ace-supply-demand-zone/
For your information, both mean reversion supply demand and Ace supply demand zone indicator uses completely different algorithm in detecting supply and demand zone.
Here is the list of Advanced Supply Demand Zone Indicator. These supply and demand zone indicators are rich in features with many powerful features to help you to trade the right supply and demand zone to trading.
Mean Reversion Supply Demand
Mean Reversion Supply Demand indicator is our earliest supply demand zone indicator and loved by many trader all over the world. It is great to trade with reversal and breakout. You can also fully setup your trading with stop loss and take profit target.
Below are the links to the Mean Reversion Supply Demand indicator for MetaTrader 4/MetaTrader 5.
https://www.mql5.com/en/market/product/16823
https://www.mql5.com/en/market/product/16851
https://algotrading-investment.com/portfolio-item/mean-reversion-supply-demand/
Ace Supply Demand Zone
Ace Supply Demand Zone indicator is our next generation supply demand zone indicator. It was built in non repainting and non lagging algorithm. On top of many powerful features, you can also make use of archived supply and demand zone in your trading to find more accurate trading opportunity.
Below are the links to the Ace Supply Demand Zone indicator for MetaTrader 4/MetaTrader 5.
https://www.mql5.com/en/market/product/40076
https://www.mql5.com/en/market/product/40075
https://algotrading-investment.com/portfolio-item/ace-supply-demand-zone/
For your information, both mean reversion supply demand and Ace supply demand zone indicator uses completely different algorithm in detecting supply and demand zone.

Young Ho Seo
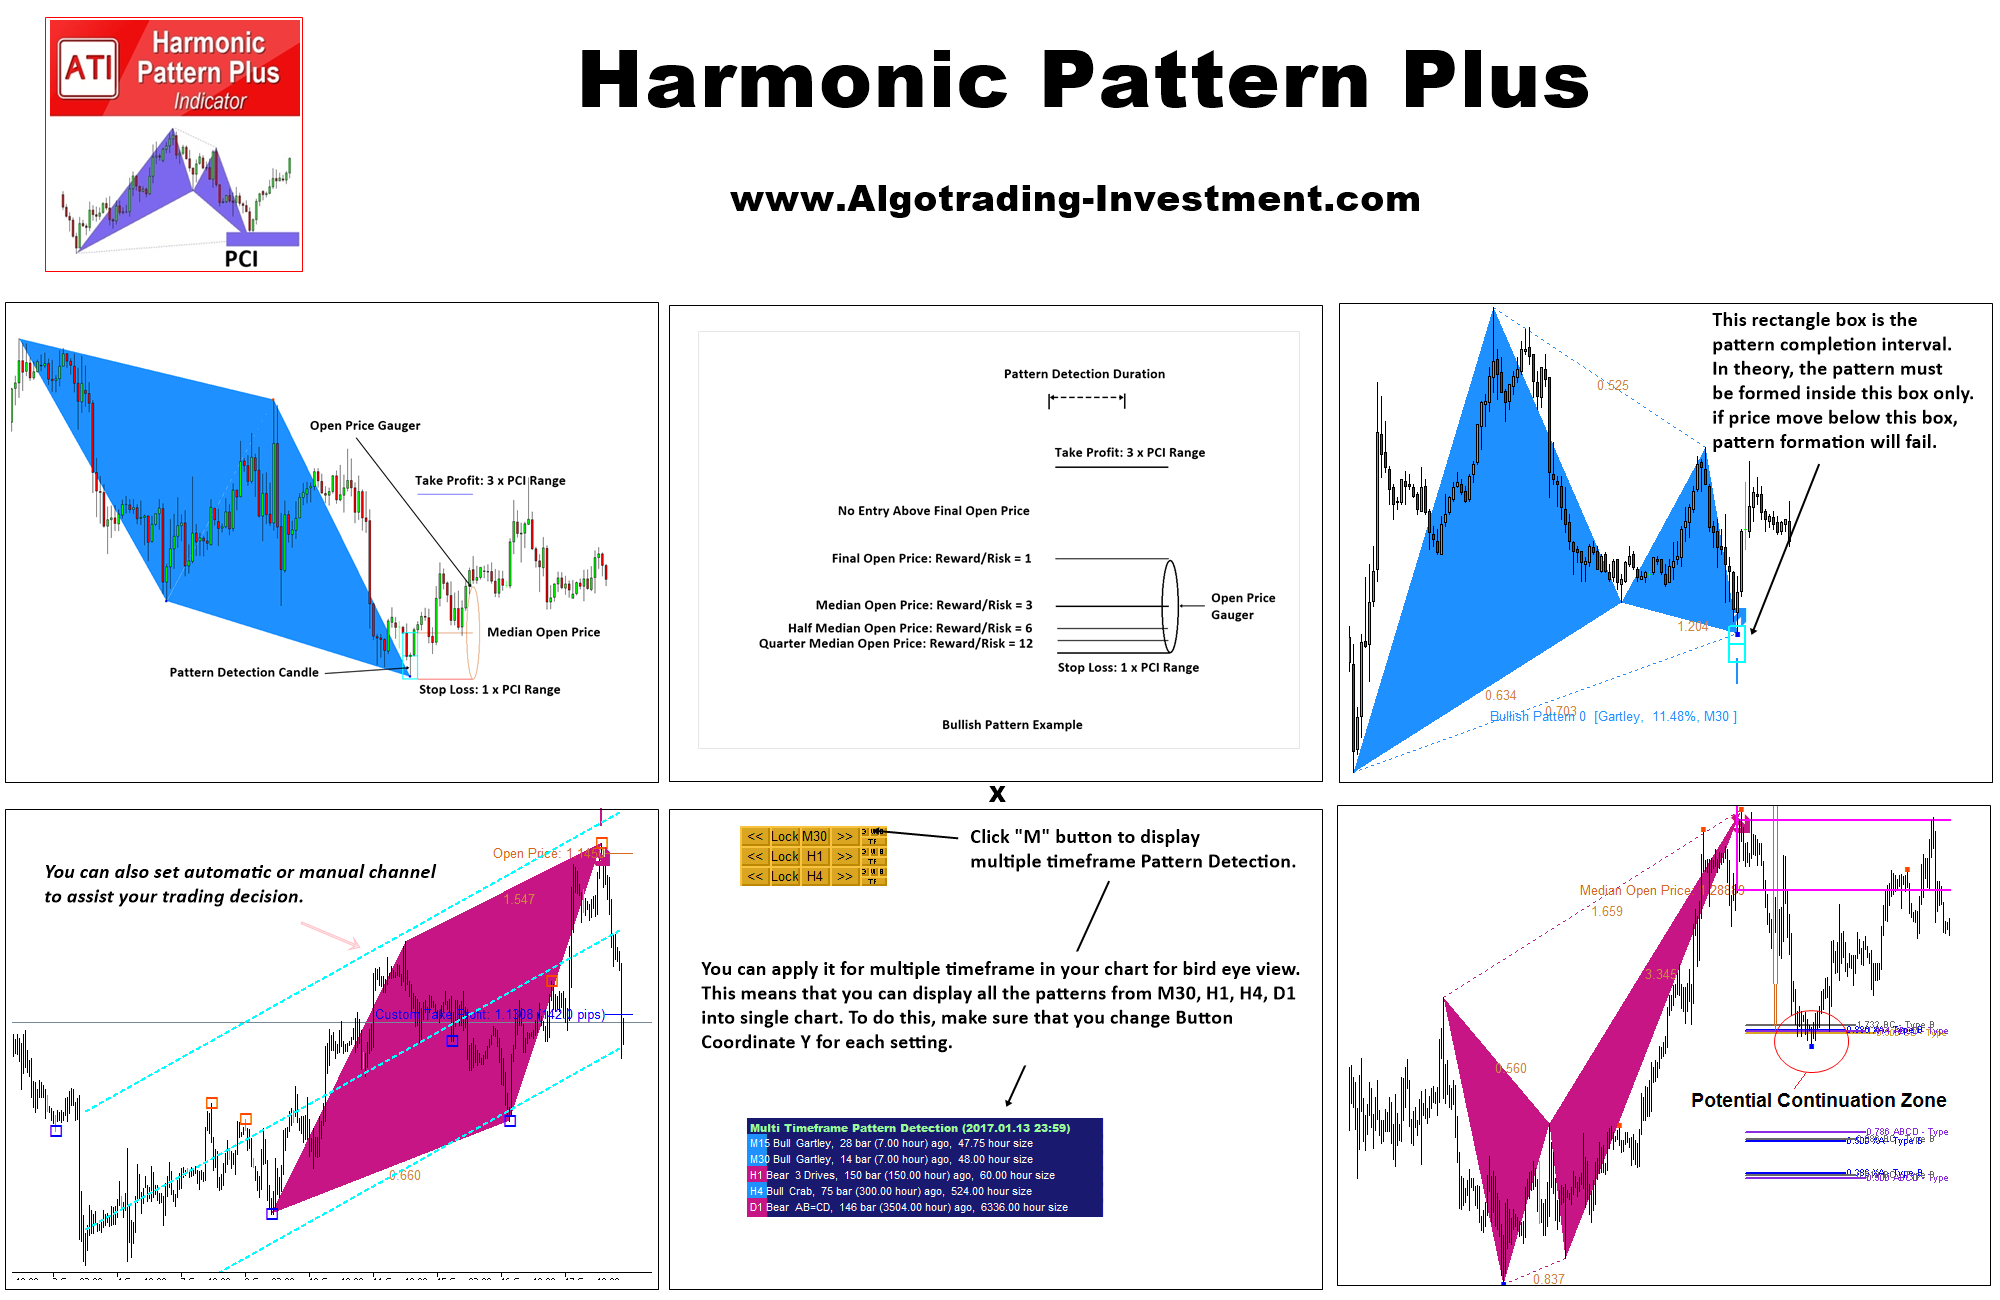
Harmonic Pattern Plus Introduction
If you need to predict the turning point of the market, then Harmonic Pattern is the best tool in its kind. With our research, our Harmonic Pattern Plus uses the precision harmonic pattern trading as its default trading strategy with Pattern Completion Zone, Potential Continuation Zone and Potential Reversal Zone. Yet, there are many other powerful features built in together for your superb trading experience. This is a repainting Harmonic Pattern indicator but this one comes will tons of useful features to help you to make more accurate trading decision as well as manaing the trading risk.
11 Harmonic Pattern Detection
Automatic stop loss and take profit recognition for superb risk management
Pattern Completion Zone detection for precision trading
Potential Continuation Zone detection for future price prediction
Potential Reversal Zone detection for Point D identification
52 Japanese Candlestick Pattern Detection (optional to use, you can swtich on and off)
Automatic Channel Detection to go with Harmonic Pattern (Optional to use, you can switch on and off)
Multiple timeframe Pattern Detection across all timeframe
Guided Trading Instruction for professional traders
Pattern Locking and Unlocking feature in your chart
Even more, please find it out.
Below is the landing page for Harmonic Pattern Plus for MetaTrader 4 and MetaTrader 5.
https://algotrading-investment.com/portfolio-item/harmonic-pattern-plus/
https://www.mql5.com/en/market/product/4488
https://www.mql5.com/en/market/product/4475
You can find “Quick Guide for Harmonic Pattern” from the link below. This article will explain the following topics about Harmonic Pattern.
1. Automatic Reversal (turning point) Pattern Detection
2. Custom Take Profit and Stop Loss based on Pattern Completion Interval
3. Pattern Completion Interval Box (= Pattern Completion Zone)
4. Potential Reversal Zone (PRZ) and Potential Continuation Zone (PCZ)
5. Japanese Candlestick Patterns Detection
6. Automatic Channel
7. Multiple Timeframe Pattern Detection (alert)
8. Steps to improve Trading Performance with Harmonic Pattern Plus
9. Mean Absolute Percent Error (MAPE) in details
Please visit the link below to read the full article “Quick Guide for Harmonic Pattern”. This article is only quick quide though. We also have the book: “Guide to Precision Harmonic Pattern Trading” to explain the important knowedge to trade with Harmonic Pattern in Forex and Stock Market.
https://algotrading-investment.com/2018/10/21/quick-guide-for-harmonic-pattern-plus/

Young Ho Seo
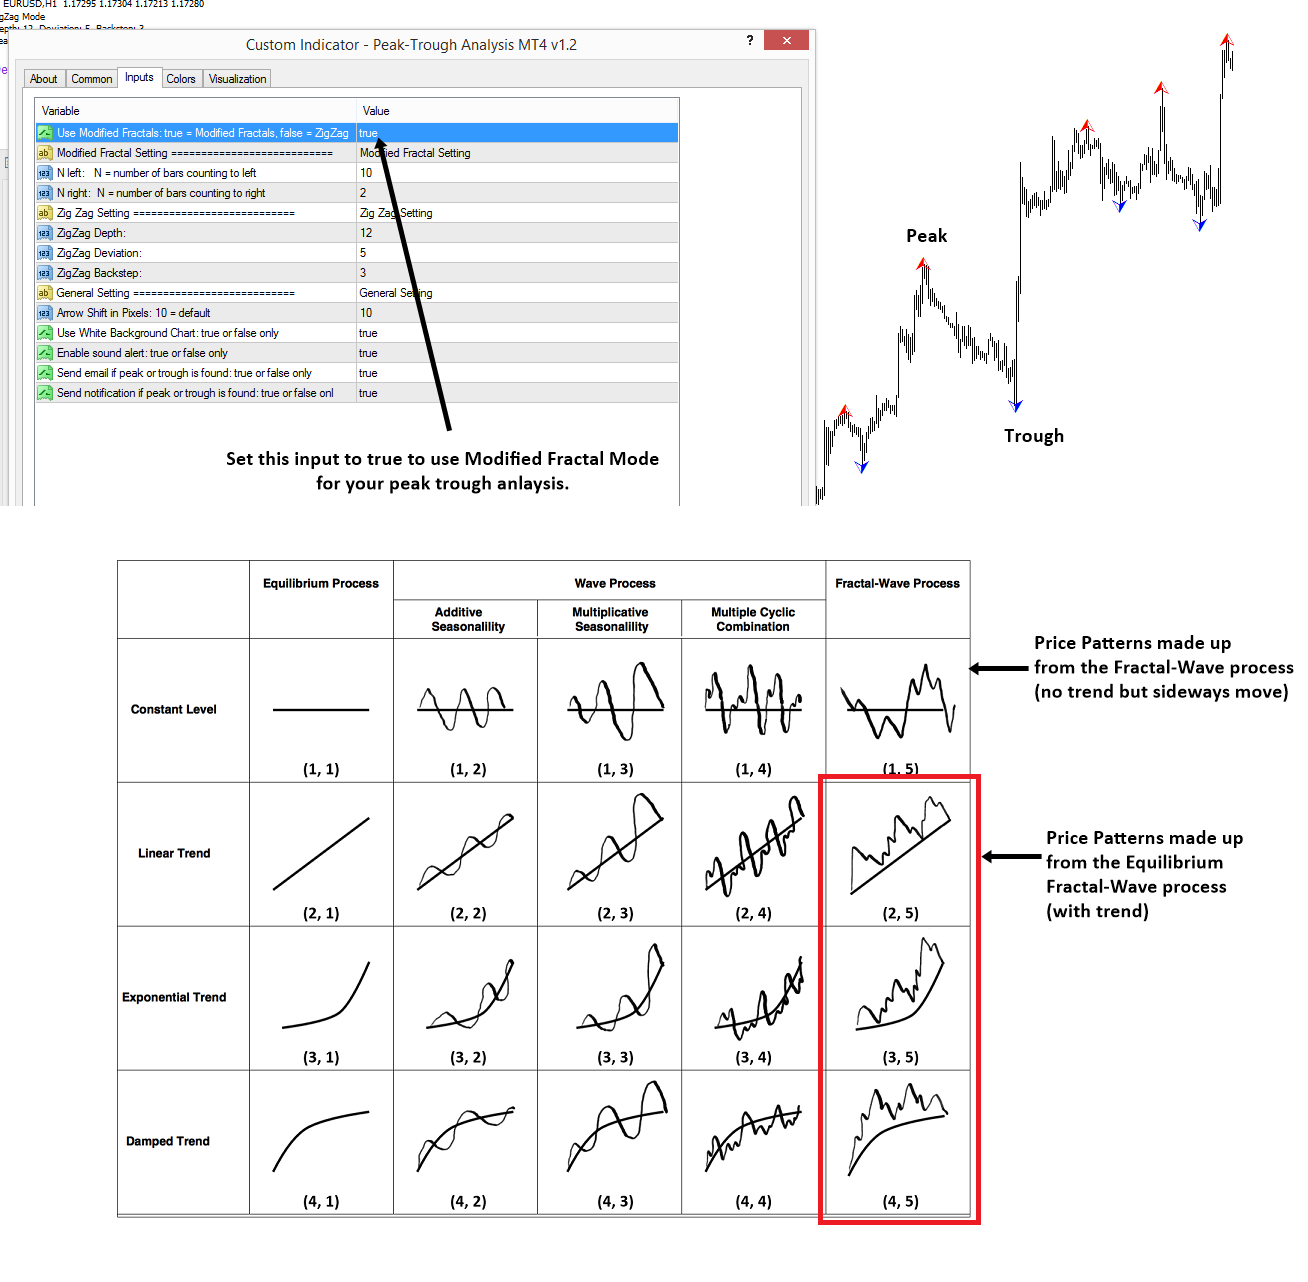
Introduction to Peak Trough Analysis for Trading
After we have released the Peak Trough Analysis indicator (free), we have many responses from traders about the usefulness of Peak Trough Analysis for their technical analysis. Yes, that is exactly why we have developed the peak trough analysis. Although it is free, it can be powerful for your trading, especially in detecting chart patterns like support resistance, supply demand zone, Harmonic Pattern, Elliott Wave, Triangle Pattern, Rising Wedge Pattern and Falling Wedge Pattern, Head and shoulder pattern and so on. In fact, the peak trough indicator provides the good connection between the peak trough analysis and how to reveal the structure of the Forex and Stock market dynamics. More precisely, the peak trough analysis helps to visualize the Fractal Wave in Forex and Stock chart. In practice, the peak trough analysis can advance your price action trading. This is not just intuitive for your trading but we have the formulated logical and reproducible ways for your trading. You can use the peak trough analysis tool without much explanation since they are very simple and easy to use.
However, if you really want to digger deeper and to have more performance with the peak trough analysis, then you can look into the book: Scientific Guide To Price Action and Pattern Trading: Wisdom of Trend, Cycle, and Fractal Wave.
https://play.google.com/store/books/details?id=5prUDwAAQBAJ
https://www.amazon.com/dp/B073T3ZMBR
https://www.scribd.com/book/394566377/Scientific-Guide-To-Price-Action-and-Pattern-Trading
We shows more comprehensive explanation and usage in the peak-trough analysis in this book. At the same time, in our website, the peak trough analysis is the most basic trading tool you can use. If you need more sophisticated but automated tools for your trading, then you can visit our website. You will find much more powerful trading system than the peak trough analysis indicator. As we have mentioned, the peak trough analysis indicator is the most basic one you can use among our products. For example, we provide the Harmonic Pattern Scanner, Elliott Wave Indicator, Chart Pattern Scanner, Volume Spread Analysis tools. Please visit the link below to find out more about the powerful technical analysis.
https://algotrading-investment.com
https://www.mql5.com/en/users/financeengineer/seller#products
Here are the free download link for Peak Trough Analysis for MetaTrader 4 (MT4):
https://www.mql5.com/en/market/product/23797
Here are the free download link for Peak Trough Analysis for MetaTrader 5 (MT5):
https://www.mql5.com/en/market/product/22420
You can also download it for free from Algotrading-Investment.com. Link is shown in the belwo.
https://algotrading-investment.com/portfolio-item/peak-trough-analysis-tool/

Young Ho Seo
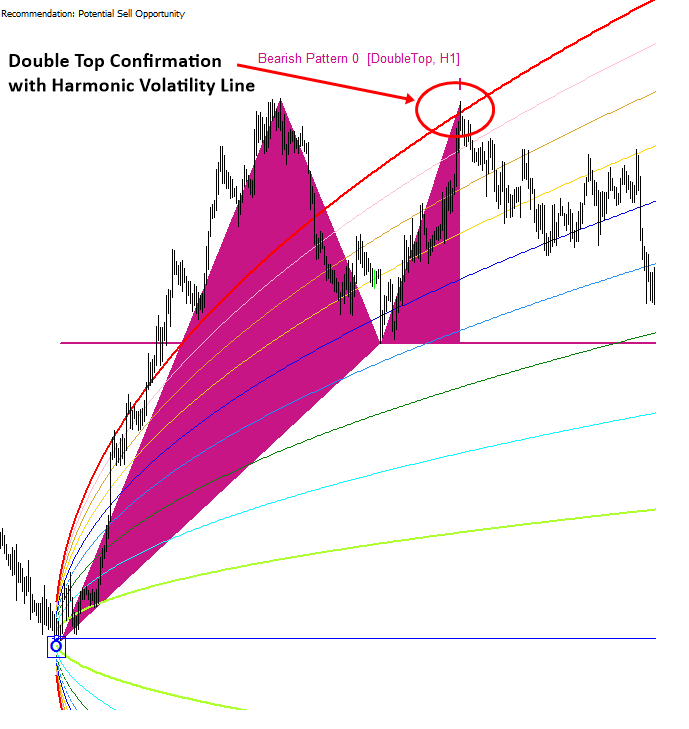
Next Generation Volatility Indicator
Introduction to Volatility
Volatility is the most watched variable among the institutional traders because the market volatility have a direct impact on their trading risk. It is not easy to meet up any successful traders without emphasizing the importance of the volatility for their trading. In addition, we can even find countless trading strategies or trading courses based on the market volatility around us. In spite of its high importance, unfortunately, the access to the volatility tools for average traders are not easy in general. It is partly true that the library of the price based technical analysis is ever growing whereas the development in the volatility based technical analysis is almost halt after the invention of Bollinger bands in 1980s by John Bollinger. In general, you can find fewer number of the technical analysis tools based on the volatility in the most of trading or charting platforms. Here is the list of some popular volatility indicators for traders.
• Standard Deviation indicator
• Average True Range indicator
• True Range Indicator
• Keltner Channel
• Bollinger bands indicator
Regardless of fewer tools available to analyse the market volatility for traders, the high importance of watching market volatility will never change in the future. Market can only move as much as the fuels available in the market. Therefore, watching the market volatility will never harm your trading but will do many good things for your trading.
Overview on the Harmonic Volatility Indicator
Harmonic Volatility Indicator was originally developed to overcome the limitation of Gann’s Angle, also known as Gann’s Fan. For this reason, trader can use Harmonic Volatility Indicator like Gann’s Angle (or Gann’s Fan). At the same time, the harmonic volatility indicator bases its core concept on the Volatility and Fibonacci analysis, which is distinctive from the Gann’s Angle. Therefore, the Harmonic Volatility Indicator can offer many other benefits, which are not offered by Gann’s Angle. In this article, we will talk about the Harmonic Volatility Indicator without comparing it to the Gann’s Angle because there are many traders who are not familiar with Gann’s technique.
You can read everything about volatility trading from this original article.
https://algotrading-investment.com/2018/10/29/next-generation-volatility-indicator/
Fibonacci Volatility Indicator
Fibonacci Volatility indicator can provide the market volatility in visual form in your chart for your trading. You can use Daily, Weekly, Monthly and Yearly Volatility for your trading. The most important application of this Volatility indicator is to detect the potential breakout area, potential bullish reversal area and potential bearish reversal area. When you want to visualize the Volatility for your trading, this is the best tool available in the market. Additionally, you can also use the Movable Volatility indicator and you can set the alert at low and high volatile area in your chart.
https://www.mql5.com/en/market/product/52671
https://www.mql5.com/en/market/product/52670
https://algotrading-investment.com/portfolio-item/fibonacci-volatility-indicator/
Harmonic Volatility Indicator
Harmonic Volatility indicator also provides the market volatility in visual form in your chart for your trading. This tool can be used to visualize the Daily, Weekly, Monthly and Yearly Volatility. The difference between Harmonic Volatility indicator and Fibonacci Volatility indicator is that you can only use Probability Configuration mode in the Harmonic Volatility indicator whereas in the Fibonacci Volatility indicator you can access both Probability Configuration and Z Score configuration. This is cheaper than Fibonacci Volatility indicator. Hence, this is the light version of the Fibonacci Volatility indicator.
https://www.mql5.com/en/market/product/29008
https://www.mql5.com/en/market/product/29004
https://algotrading-investment.com/portfolio-item/harmonic-volatility-indicator/

Young Ho Seo
Identifying Order and Disorder in Chaotic Market with Elliott Wave
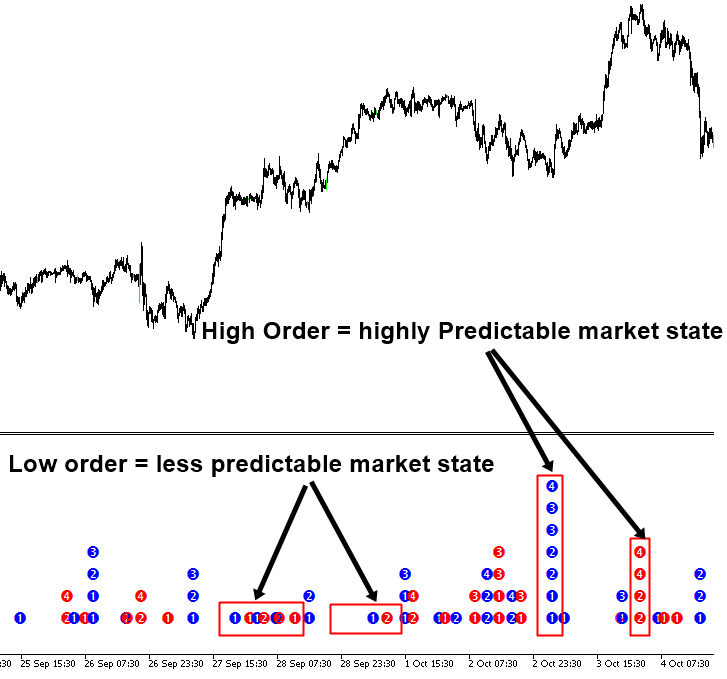
In this article, we will explain how to identify order and disorder in the chaotic market with Elliott Wave Analysis. As a trader, you will agree that scientific method can improve your profits. Whether you are using correlation, geometric patterns, or statistics, they are baesed on science. Even latency arbitrages are just a sort of computer science or engineering, one could dig deeper on how to fine-tune the algorithm, network and internet speed to beat others. If any trading strategy has persistent dynamics towards profitability, we can formulate or describe their working mechanism using known science and engineering principle. Hence, we can reproduce the same mechanism repeatedly for our trading. Most winning trading strategies are based on some sort of precise science and engineering. Profit will never come blindly or by just a chance.
Topic in this article is partly about chaos theory. As one knows, chaos theory as in nonlinear dynamics is a hard-core math topic. However, we will not touch the complex theory because this article is for average trader. The focus of this article is to provide some intuition over this hard science, chaos theory. Chaos theory reveals several characteristic for some dynamic system like stock or currency market. Here is the list of four important characteristics:
Highly sensitive to initial condition (i.e. Butterfly effect)
Feedback loop
Order/Disorder
Fractals (i.e. self-similarity)
Etc
Firstly, scientist often uses the term butterfly effect. This term describes the situation in which a butterfly flapping its wings in New Mexico cause a hurricane in China. A different way to express this is that small changes in the initial condition can lead to drastic changes in the results. We can meet full of similar examples in our life. One example of butterfly effect is that the rejection of an art application lead to World War Two. This is probably the most widely known butterfly effect. In 1905, Adolf Hitler applied to the Academy of Fine Arts in Vienna. He was rejected twice. After his rejection, he was forced to live in the slums of the city and his anti-Semitism grew. He joined the German Army instead of fulfilling his dreams as an artist. World would been changed a lot if Academy of Fine Arts accepted him.
You can read everything about Identifying Order and Disorder in Chaotic Market with Elliott Wave from this original article.
https://algotrading-investment.com/2018/10/29/identifying-order-and-disorder-in-chaotic-market-with-elliott-wave/
Finally, one might ask if they can go beyond 4 triangles like or 5 triangles or 8 triangles to calculate the density. From my empirical study, it is rare to see anything above 4 triangles. In this point, my empirical study and R. N. Elliott observation agrees. That is why Elliott comes up with Elliott Wave 12345 pattern and not Elliott Wave 12345678 pattern.
Final Note:
We hope this is useful for your profitable trading. Elliott Wave Trend has the following automatic features:
Detect the density of geometric patterns (identifying order and disorder of financial market.)
Automatic Elliott Wave Counting for trading.
Manual Elliott Wave Counting for trading.
Automatic Wave Structure Score calculation.
Here is the links to our Elliott Wave Trend for MetaTrader 4 and MetaTrader 5.
https://www.mql5.com/en/market/product/16479
https://www.mql5.com/en/market/product/16472
https://algotrading-investment.com/portfolio-item/elliott-wave-trend/

Young Ho Seo
Added poll MetaTrader 4 vs MetaTrader 5, Which One Do You Use ?
-
29% (20)
-
38% (26)
-
28% (19)
-
4% (3)
Total voters: 68
Young Ho Seo
Introduction to Momentum Trading
Profitable Trading Idea
In this article, we will explain how to use Price Momentum in Forex and Stock trading. We will start it by sharing some idea behind the profitable trading strategy. First of all, trading is an applied science. The profit for day trader comes from the good discipline driven by fact and evidence. Likewise, the profit for any systematic trading is the fruits of the good market analysis driven by fundamental and technical knowledge. To access more profits as a trader, you will need an improved discipline and technological advancement together allowing you to see the predictable behavior of the financial market. Many traders will highly emphasize that the technology is the key to success. Many will agree that the good automated indicators and tools will provide the edge to the average trader. It is the growing trend in the modern electronic trading environment.
Then where the profit comes from ? Profit comes from the regular movement in the market. That is something we can analyze and can make use to predict the next movement of the financial market. These five regularities shown in the Figure 1 are typically what traders are looking to catch in their trading. We highly emphasize to look for or focus on the fifth regularity in your practical trading. The fifth regularity says that the price in the financial market will move in the zigzag path. Mathematically, this is described as fractal wave or repeating patterns. Fundamentally these happens to balance the supply and demand force.
Introduction to Excessive Momentum Trading
Excessive momentum is the technique to identify unusually strong supply or unusually strong demand by analyzing the price series. Why do we need to care about the unusually strong supply or unusually strong demand in our trading? It is because unusually strong supply or unusually strong demand are the sign of the end of the current trend ( or birth of new trend). As you probably guess, when the new trend is born, you can ride the highest profit as possible. Hence, the excessive momentum can provide you the attractive entries for your trading.
Now probably you are starting to make some sense. That is good. Your intuition will start to tell you that this excessive momentum can provide good trading opportunity. When the balance is broken marginally, we can consider it as the market anomaly. Two potential causes can drive the occurrences of Excessive momentum. Firstly, the excessive momentum could be caused by some irrational price reaction like the late comers buying stocks after the stock have gone up too much. Secondly, the excessive momentum could be caused by strong belief of the crowd that the price will continue to go in the same direction. Whichever scenario is driving the excessive momentum, it is where we can observe the crowd psychology clearly. Excessive momentum provides the good market timing. We will also confirm that with the volume spread analysis to make further sense with excessive momentum trading.
You can read everything about Momentum Trading from the original link below.
https://algotrading-investment.com/2018/10/29/introduction-to-momentum-trading/
Volume spread analysis and excessive momentum zone are not a rocket science although detection of excessive momentum requires the sophisticated algorithm. But we did a lot of work to provide you the automated tools for your trading. With the automated Excessive Momentum detection tool, you can easily detect the broken balance between supply and demand for your trading. With excessive momentum drawn in your chart, it is much easier to predict the timing of new trend and its direction.
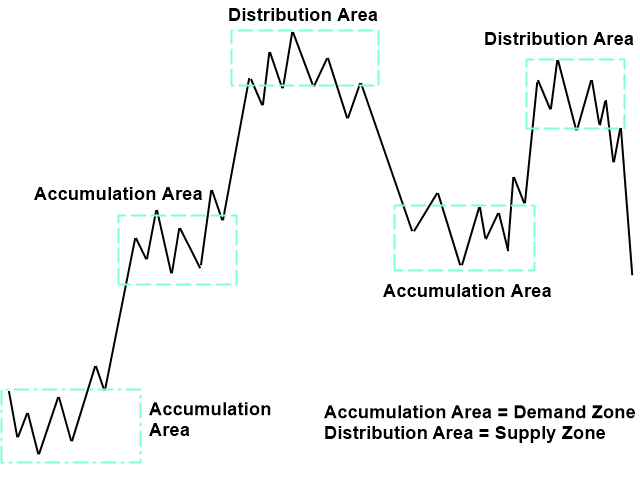
Here is three important summary about the Excessive momentum, Accumulation and Distribution area.
1. Excessive momentum provides the important clue to detect accumulation and distribution area outlined by Wickoff Cycle. Other methodology of finding Accumulation and Distribution area is not as good as the Excessive momentum indicator.
2. Detected Accumulation and Distribution area can indicate the fresh price movement that will expand in full scale. This is often the best entry or exit for your trading with highest rewards and smallest risks.
3. Accumulation and distribution area do not come in alternating manner. It can come like accumulation – accumulation – distribution or distribution – distribution – distribution – accumulation. Hence, do not get confused it from the original Wickoff cycle screenshot.
Excessive Momentum Indicator can detect the final phase of the price momentum. This final phase of the price momentum usually provide the good place to identify the accumulation and distribution area in Volume Spread Analysis. At the same time, this final phase of the price momentum is a excellent place to identify the supply and demand unbalance in the market. Excessive Momentum Indicator is the excellent tool for the advanced momentum trading. Here is link to Excessive Momentum Indicator for MetaTrader 4 and MetaTrader 5.
https://algotrading-investment.com/portfolio-item/excessive-momentum-indicator/
https://www.mql5.com/en/market/product/30641
https://www.mql5.com/en/market/product/30621

Young Ho Seo
Japanese candlestick patterns with Price Breakout Pattern Scanner
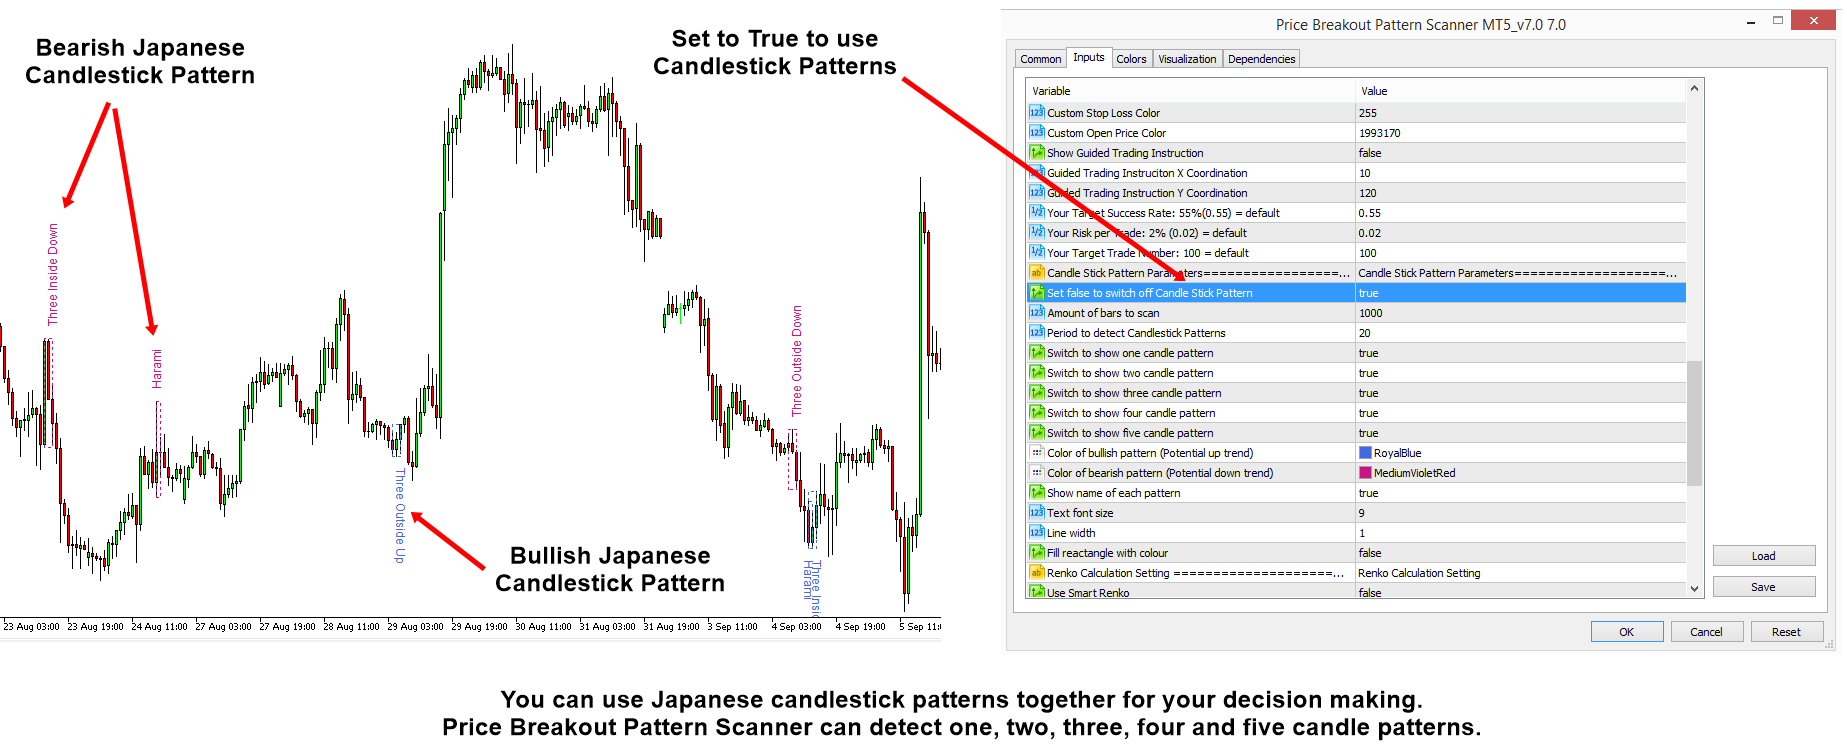
Price Breakout Pattern Scanner can detect the important chart patterns like Triangle, Rising Wedge, Falling Wedge Pattern and so on. In addition, Price Breakout Pattern Scanner detects the Japanese candlestick patterns. Price Breakout Pattern Scanner can detect 52 different Japanese candlestick patterns. Properly used these provided chart patterns and Japanese Candlestick patterns, they can yield excellent trading results.
Japanese Candlestick patterns are categorized under five categories including one, two, three, four and five candlestick patterns. To use Japanese candlestick patterns, you can enable the candlestick pattern from Price Breakout Pattern Scanner input. See the attached screenshot for the purpose. If you wish, you can switch on and off the individual category of patterns according to your preferences. For example, you can only use two and three candlestick patterns if you wish. Japanese candlestick patterns are the supplementary tools when you trade with the chart patterns like Triangle, Rising Wedge, Falling Wedge Patterns. For example, you can use the Japanese candletick patterns as the secondary confirmation when you decide the trading direction of the chart patterns.
You can also receive sound alert, email and push notification when new Japanese candlestick patterns are detected. Here are the links to Price Breakout Pattern Scanner available in MetaTrader 4 and MetaTrader 5.
https://www.mql5.com/en/market/product/4859
https://www.mql5.com/en/market/product/4858
https://algotrading-investment.com/portfolio-item/price-breakout-pattern-scanner/
When you do not know how to use the chart patterns like Triangle, Falling Wedge, Rising Wedge Patterns, the quickest way to learn how to use them is to think them as the diasognal support and resistance. We have a lot of trading education to teach you how to trade with Triangle, Falling Wedge Pattern and Rising Wedge Pattern, Head and shoulder pattern and so on in our website. Below is the link to the Free Trading Education for Forex and Stock trading.
https://algotrading-investment.com/2019/07/23/trading-education/

: