Young Ho Seo / Profile
- Information
|
10+ years
experience
|
62
products
|
1171
demo versions
|
|
4
jobs
|
0
signals
|
0
subscribers
|
Harmonic Pattern Indicator - Repainting + Japanese Candlestick Pattern Scanner + Automatic Channel + Many more
https://www.mql5.com/en/market/product/4488
https://www.mql5.com/en/market/product/4475
https://algotrading-investment.com/portfolio-item/harmonic-pattern-plus/
Non Repainting and Non Lagging Harmonic Pattern Indicator – Customizable Harmonic + Japanese Candlestic Pattern Scanner + Advanced Channel + Many more
https://www.mql5.com/en/market/product/41993
https://www.mql5.com/en/market/product/41992
https://algotrading-investment.com/portfolio-item/profitable-pattern-scanner/
Supply Demand Indicator – Multiple Timeframe Scanning Added + Non Repainting + Professional Indicator
https://www.mql5.com/en/market/product/40076
https://www.mql5.com/en/market/product/40075
https://algotrading-investment.com/portfolio-item/ace-supply-demand-zone/
Momentum Indicator – Path to Volume Spread Analysis
https://www.mql5.com/en/market/product/30641
https://www.mql5.com/en/market/product/30621
https://algotrading-investment.com/portfolio-item/excessive-momentum-indicator/
Elliott Wave Indicator for the Power User
https://www.mql5.com/en/market/product/16479
https://www.mql5.com/en/market/product/16472
https://algotrading-investment.com/portfolio-item/elliott-wave-trend/
Forex Prediction - Turn Support and Resistance to the Advanced Strategy
https://www.mql5.com/en/market/product/49170
https://www.mql5.com/en/market/product/49169
https://algotrading-investment.com/portfolio-item/fractal-pattern-scanner/
MetaTrader 4 and MetaTrader 5 Product Page: https://www.mql5.com/en/users/financeengineer/seller#products
Free Forex Prediction with Fibonacci Analysis: https://algotrading-investment.com/2020/10/23/forex-prediction-with-fibonacci-analysis/
Free Harmonic Pattern Signal: https://algotrading-investment.com/2020/12/17/harmonic-pattern-signal-for-forex-market/
============================================================================================================================
Here are the trading education books. We recommend reading these books if you are a trader or investor in Forex and Stock market. In the list below, we put the easy to read book on top. Try to read the easy to read book first and try to read the harder book later to improve your trading and investment.
First Link = amazon.com, Second Link = Google Play Books, Third Link = algotrading-investment.com, Fourth Link = Google Books
Technical Analysis in Forex and Stock Market (Supply Demand Analysis and Support Resistance)
https://www.amazon.com/dp/B09L55ZK4Z
https://play.google.com/store/books/details?id=pHlMEAAAQBAJ
https://algotrading-investment.com/portfolio-item/technical-analysis-in-forex-and-stock-market/
https://books.google.co.kr/books/about?id=pHlMEAAAQBAJ
Science Of Support, Resistance, Fibonacci Analysis, Harmonic Pattern, Elliott Wave and X3 Chart Pattern (In Forex and Stock Market Trading)
https://www.amazon.com/dp/B0993WZGZD
https://play.google.com/store/books/details?id=MME3EAAAQBAJ
https://algotrading-investment.com/portfolio-item/science-of-support-resistance-fibonacci-analysis-harmonic-pattern/
https://books.google.co.kr/books/about?id=MME3EAAAQBAJ
Profitable Chart Patterns in Forex and Stock Market (Fibonacci Analysis, Harmonic Pattern, Elliott Wave, and X3 Chart Pattern)
https://www.amazon.com/dp/B0B2KZH87K
https://play.google.com/store/books/details?id=7KrQDwAAQBAJ
https://algotrading-investment.com/portfolio-item/profitable-chart-patterns-in-forex-and-stock-market/
https://books.google.com/books/about?id=7KrQDwAAQBAJ
Guide to Precision Harmonic Pattern Trading (Mastering Turning Point Strategy for Financial Trading)
https://www.amazon.com/dp/B01MRI5LY6
https://play.google.com/store/books/details?id=8SbMDwAAQBAJ
http://algotrading-investment.com/portfolio-item/guide-precision-harmonic-pattern-trading/
https://books.google.com/books/about?id=8SbMDwAAQBAJ
Scientific Guide to Price Action and Pattern Trading (Wisdom of Trend, Cycle, and Fractal Wave)
https://www.amazon.com/dp/B073T3ZMBR
https://play.google.com/store/books/details?id=5prUDwAAQBAJ
https://algotrading-investment.com/portfolio-item/scientific-guide-to-price-action-and-pattern-trading/
https://books.google.com/books/about?id=5prUDwAAQBAJ
Predicting Forex and Stock Market with Fractal Pattern: Science of Price and Time
https://www.amazon.com/dp/B086YKM8BW
https://play.google.com/store/books/details?id=VJjiDwAAQBAJ
https://algotrading-investment.com/portfolio-item/predicting-forex-and-stock-market-with-fractal-pattern/
https://books.google.com/books/about?id=VJjiDwAAQBAJ
Trading Education Book 1 in Korean (Apple, Google Play Book, Google Book, Scribd, Kobo)
https://books.apple.com/us/book/id1565534211
https://play.google.com/store/books/details?id=HTgqEAAAQBAJ
https://books.google.co.kr/books/about?id=HTgqEAAAQBAJ
https://www.scribd.com/book/505583892
https://www.kobo.com/ww/en/ebook/8J-Eg58EDzKwlpUmADdp2g
Trading Education Book 2 in Korean (Apple, Google Play Book, Google Book, Scribd, Kobo)
https://books.apple.com/us/book/id1597112108
https://play.google.com/store/books/details?id=shRQEAAAQBAJ
https://books.google.co.kr/books/about?id=shRQEAAAQBAJ
https://www.scribd.com/book/542068528
https://www.kobo.com/ww/en/ebook/X8SmJdYCtDasOfQ1LQpCtg
About Young Ho Seo
Young Ho Seo is an Engineer, Financial Trader, and Quantitative Developer, working on Trading Science and Investment Engineering since 2011. He is the creator of many technical indicators, price patterns and trading strategies used in the financial market. He is also teaching the trading practice on how to use the Supply Demand Analysis, Support, Resistance, Trend line, Fibonacci Analysis, Harmonic Pattern, Elliott Wave Theory, Chart Patterns, and Probability for Forex and Stock Market. His works include developing scientific trading principle and mathematical algorithm in the work of Benjamin Graham, Everette S. Gardner, Benoit Mandelbrot, Ralph Nelson Elliott, Harold M. Gartley, Richard Shabacker, William Delbert Gann, Richard Wyckoff and Richard Dennis. You can find his dedicated works on www.algotrading-investment.com . His life mission is to connect financial traders and scientific community for better understanding of this world and crowd behaviour in the financial market. He wrote many books and articles, which are helpful for understanding the technology and application behind technical analysis, statistics, time series forecasting, fractal science, econometrics, and artificial intelligence in the financial market.
If you are interested in our software and training, just visit our main website: www.algotrading-investment.com
Young Ho Seo
Great MetaTrader Indicator List
Here is the list of Great MetaTrader Indicators. Each technical indicator is designed to give you higher accuracy and better performance for trading in MetaTrader. The techncial indicators are based on Market Momentum, Harmonic Pattern, Elliott Wave, Chart Pattern, Support Resistance, Wave theory, Wyckoff Method, Pairs Trading and so on. We provide the short description and link to the product page for each MetaTrader indicator. We also include the link to Free MetaTrader indicators on the bottom of this page. Of course, all these MetaTarder Indicator can be found on mql5.com website too as well as our own website.
https://www.mql5.com/en/users/financeengineer/
1. Chart Pattern MT
Chart Pattern Scanner for auto detection of Triangle, Rising Wedge, and Falling Wedge Pattern, Double Top and so on for MetaTrader (MT4/MT5)
https://algotrading-investment.com/portfolio-item/chart-pattern/
2. Harmonic Pattern Plus
Harmonic Pattern Indicator for Metatrader (MT4/MT5)
https://algotrading-investment.com/portfolio-item/harmonic-pattern-plus/
3. Harmonic Pattern Scenario Planner
Harmonic Pattern Detection for Metatrader (MT4/MT5)
https://algotrading-investment.com/portfolio-item/harmonic-pattern-scenario-planner/
4. X3 Chart Pattern Scanner
Non Repainting Harmonic Pattern and Elliott Wave Pattern Scanner for Metatrader (MT4/MT5)
https://algotrading-investment.com/portfolio-item/profitable-pattern-scanner/
5. Mean Reversion Supply Demand
Supply/Demand Zone indicator to identify market equilibrium and inequilibrium on Metatrader (MT4/MT5)
https://algotrading-investment.com/portfolio-item/mean-reversion-supply-demand/
6. Price Breakout Pattern Scanner
Price Pattern Scanner to detect Triangle, Rising Wedge, and Falling Wedge Pattern, Double Top and so on for MetaTrader (MT4/MT5)
https://algotrading-investment.com/portfolio-item/price-breakout-pattern-scanner/
7. Elliott Wave Trend
Elliott Wave Trend is a Elliott Wave indicator designed for turning point and trend analysis with Elliott Wave identification and prediction.
https://algotrading-investment.com/portfolio-item/elliott-wave-trend/
8. Excessive Momentum Indicator
Excessive Momentum Indicator is the momentum indicator designed to spot the slowing momentum directly from the chart.
https://algotrading-investment.com/portfolio-item/excessive-momentum-indicator/
9. Precision Support Resistance
Precision Support Resistance is the Support and Resistance Indicator for MetaTrader (MT4/MT5)
https://algotrading-investment.com/portfolio-item/precision-support-resistance/
10. Equilibrium Fractal Wave Analytics
Equilibrium Fractal Wave Analytics is the Wave Indicator for MetaTrader (MT4/MT5) and it is based on Fractal Wave theory.
https://algotrading-investment.com/portfolio-item/equilibrium-fractal-wave-analytics/
11. EFW Pattern Trader
EFW Pattern Trader is a Pattern Trader based on Harmonic Pattern and X3 Chart Pattern for Metatrader (MT4/MT5).
https://algotrading-investment.com/portfolio-item/efw-pattern-trader/
12. Pair Trading Station
Pair Trading Station is the Pairs Trading indicator for MetaTrader (MT4/MT5). It is based on Pairs Trading Strategy.
https://algotrading-investment.com/portfolio-item/pair-trading-station/
13. Turning Point Detector
Turing Point Detector is the Turning Point Indicator for MetaTrader (MT4/MT5)
https://algotrading-investment.com/portfolio-item/turning-point-detector/
14. Volume Spread Pattern Indicator
Volume Spread Pattern Indicator is the Wyckoff Method Indicator for MetaTrader (MT4/MT5) with supply and demand logic.
https://algotrading-investment.com/portfolio-item/volume-spread-pattern-indicator/
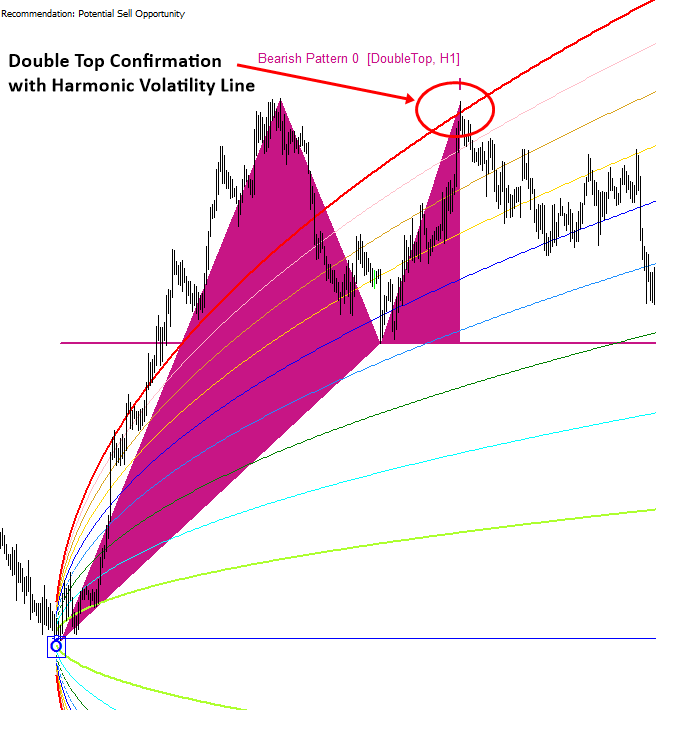
15. Harmonic Volatility Indicator
Harmonic Volatility indicator is the Market Volatility indicator on MetaTrader (MT4/MT5) applying Fibonacci Patterns to Volatility.
https://algotrading-investment.com/portfolio-item/harmonic-volatility-indicator/
16. Other Free MetaTrader Indicators
You can also access the free MetaTrader indicators from below links:
https://algotrading-investment.com/product-category/free/

Young Ho Seo
Supply Demand Trading with Trendline
Introduction to Supply Demand Trading with Trendline
"Supply Demand Trading with Trendline" was formally known as the "Angled Supply Demand Zone Trading". Supply Demand Trading with Trendline is the advanced support and resistance trading in fact. The concept of "Supply Demand Trading with Trendline" was first developed by Young Ho Seo in 2019. In 2019, this technique was called "Angled Supply Demand Zone Trading". Hence, you can consider the supply demand trading with trendline and angled supply demand trading are identical. The essence of "Supply Demand Trading with Trendline" or "Angled Supply Demand Zone Trading" is to reuse the historical supply demand zones for some ingenious purpose. Please read this free article until to the end to master this trading strategy so that you can bring your trading skills to another level. As we have mentioned often, this trading strategy could be extra skills on top of the classic Supply Demand Trading.
If you are relying on trading income, good trading strategy is your workhorse for every day. Supply and demand zone concept is widely used among traders for several reasons. It is relatively simple to start with. In addition, it is effective in picking up the profitable moment. In fact, Supply and Demand zone is the extended concept from support and resistance at some points. The trading zone concept adds different values to our trading. For example, with zone, it is much easier to define our trading scenario and risk management than just simple price level from support and resistance. However, there is no perfect trading system in the world (i.e. being profitable and perfect is two different things). Of course, supply and demand zone concept has its own weakness too. For example, many traders still find it difficult to find good supply and demand zone to trade. Hence, some trader relies on the supply and demand indicator rather than the manual detection of the zone. Another difficulty is to find some good guide on how to trade with profits. It is difficult to find which online article is the genuine and profitable one.
You can continue to read full article here from the link below. This article will explains everything about "Supply Demand Trading with Trendline". It is free but informative article.
https://algotrading-investment.com/2019/07/04/angled-supply-demand-zone-trading-tutorial-1/
Note about Supply Demand Trading with Trendline
The good news about supply demand trading with trendline is that it does not alter the original concept of supply demand trading. However, it helps you to find more accurate supply and demand zone to trade. You can take the breakout through the angled line as the double confirmation of the direction of your supply and demand trading. Therefore, any supply and demand zone trader can use Angled supply demand trading on top of their typical trading setup. When you draw the angled line or trendline, you might take some guide from GANN’s FAN or GANN’s angle, but this is not compulsory. There are many ways you can draw the trendline using historical supply and demand zone. Please practice as it was shown in this article and then build up the logic and skill gradually.
Supply and Demand Indicator
Ace Supply Demand Zone indicator was built upon non-repainting and non-lagging principle. It is multi-purpose Supply Demand Zone indicator for any level of trader. We especially built this Ace Supply Demand Zone indicator to improve the accuracy of supply and demand trading. This supply and deamnd indicator is available through several channels from below links.
https://www.mql5.com/en/market/product/40076
https://www.mql5.com/en/market/product/40075
https://algotrading-investment.com/portfolio-item/ace-supply-demand-zone/

Young Ho Seo
Showing Historical Patterns in X3 Chart Pattern Scanner
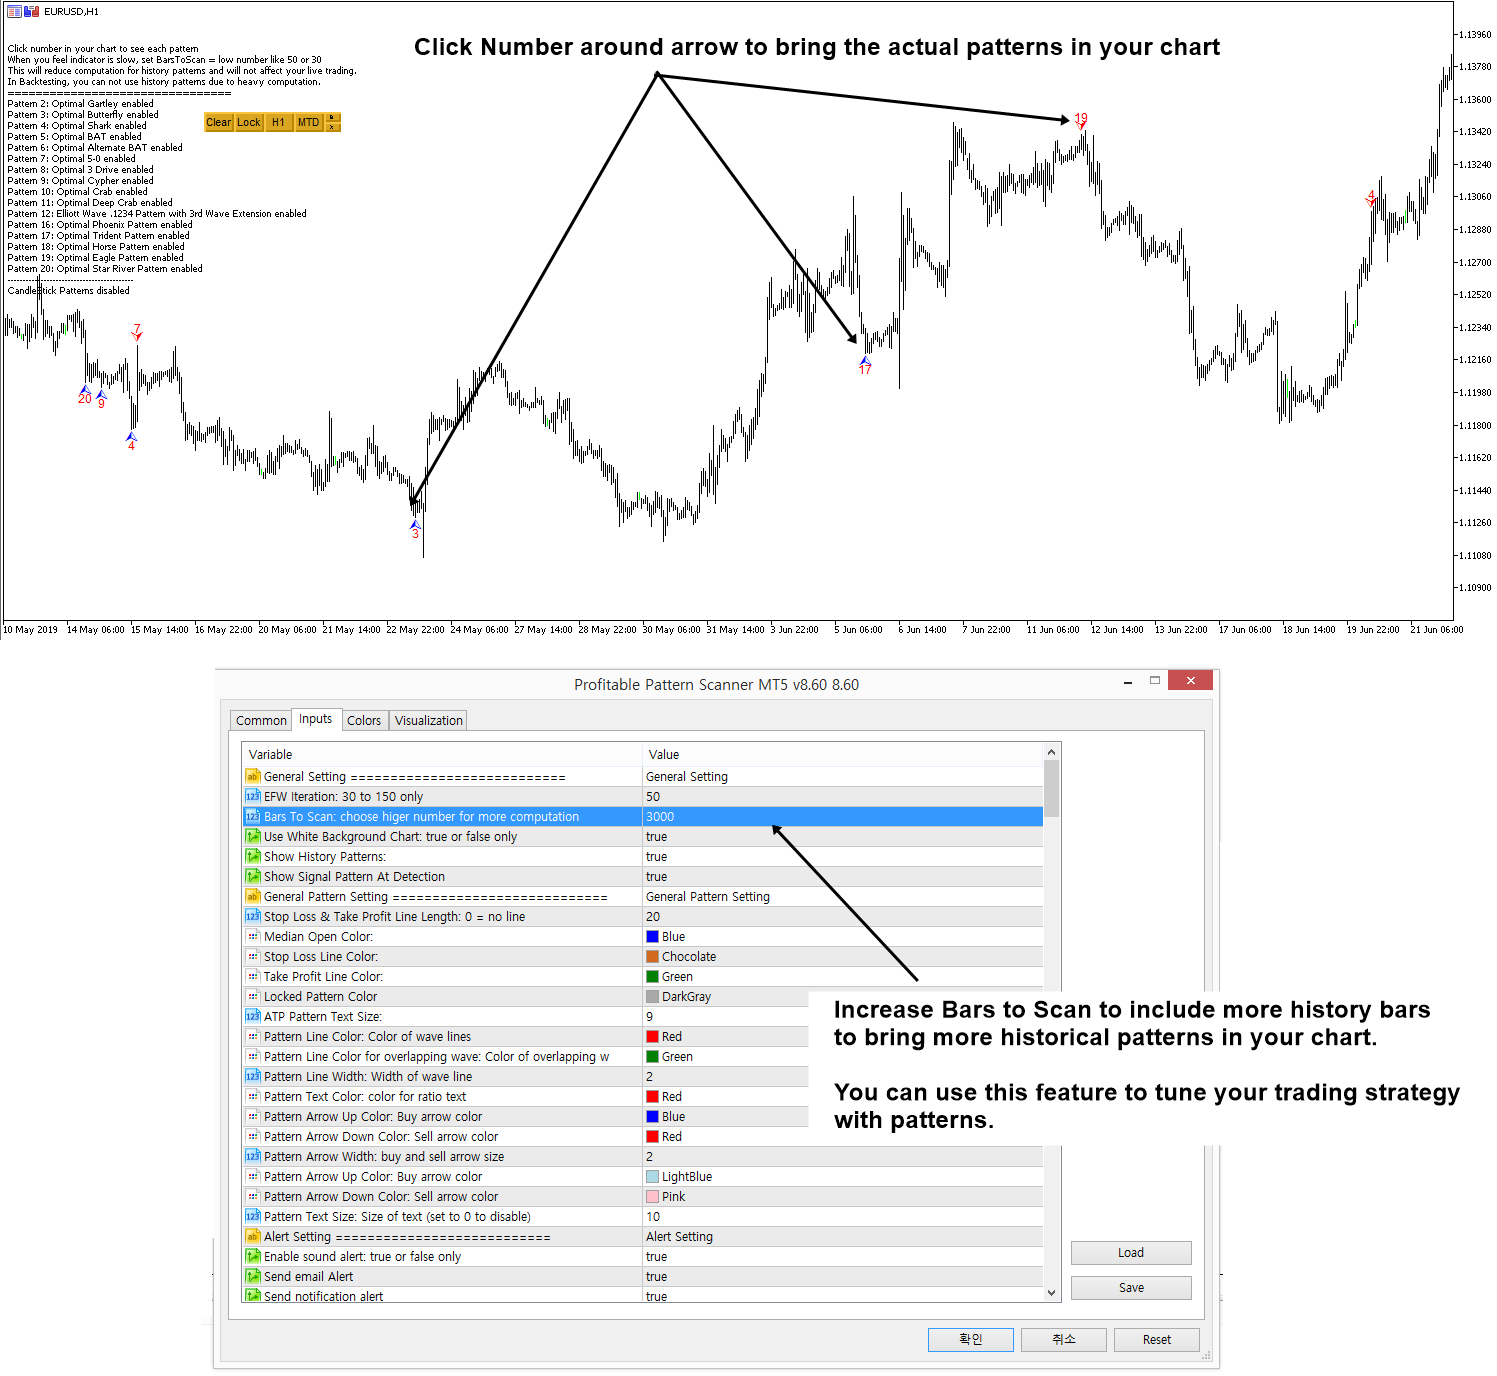
In trading, you get your profits as good as your tools and knowledge. X3 Chart Pattern Scanner is the superb Harmonic Pattern and Elliott Wave Pattern Indicator using the next generation pattern detection algorithm (The first Non Repainting + Non Lagging Harmonic pattern indicator.). To understand and to test your strategy, simply increase bars to scan to some higher number like 5000 or 10,000. Initially bars to scan is set to 250 to save some computation but you can increase as many as you can to just check your strategy. Screenshot shows how to do it.
1. Optimize your Strategy per symbol and per timeframe
As you can see, Harmonic Pattern and Elliott Wave pattern will perform differently per symbol and per timeframe. Hence, check history signals per symbol and per timeframe to optimize your strategy per symbol and per timeframe. While you are studying these patterns with Profitable Pattern scanner, you will gain more and more knowledge and skills for your trading.
2. Secondary Confirmation to improve your profits
To improve success rate, make sure that you are studying various indicators and filters together with the historical signal patterns in the scanner as secondary confirmation. In my opinion, you will gain practical knowledge within few weeks whereas other harmonic pattern trader takes typically 1 to 3 years to grab knowledge of harmonic pattern trading (and 2 to 4 years for Elliott wave trading). This is great advantage with this non repainting indicator.
3. Set Bars to Scan input = default in live trading to save computation
Another important note is that make the “Bars to Scan” input to 250 after you have finished your studying with historical signal patterns. If you leave Bars to Scan = 10,000, etc, this would be too heavy for your MetaTrader. For your live trading, set Bars to Scan = 250 or as small as possible. Since live trading results and historical signals are the same, you will not get lost anything even if you set Bars to Scan = 250 or other reasonably small number.
4. Simple and Easy to trade
Beside all this sophisticated technology running before your PC, trading with X3 Chart Pattern Scanner is easy and simple because of its non repainting features. Just study your charts and trade with what you see from your charts.
https://algotrading-investment.com/portfolio-item/profitable-pattern-scanner/
https://www.mql5.com/en/market/product/41992
https://www.mql5.com/en/market/product/41993

Young Ho Seo
Trading Zone Extended From Support Resistance
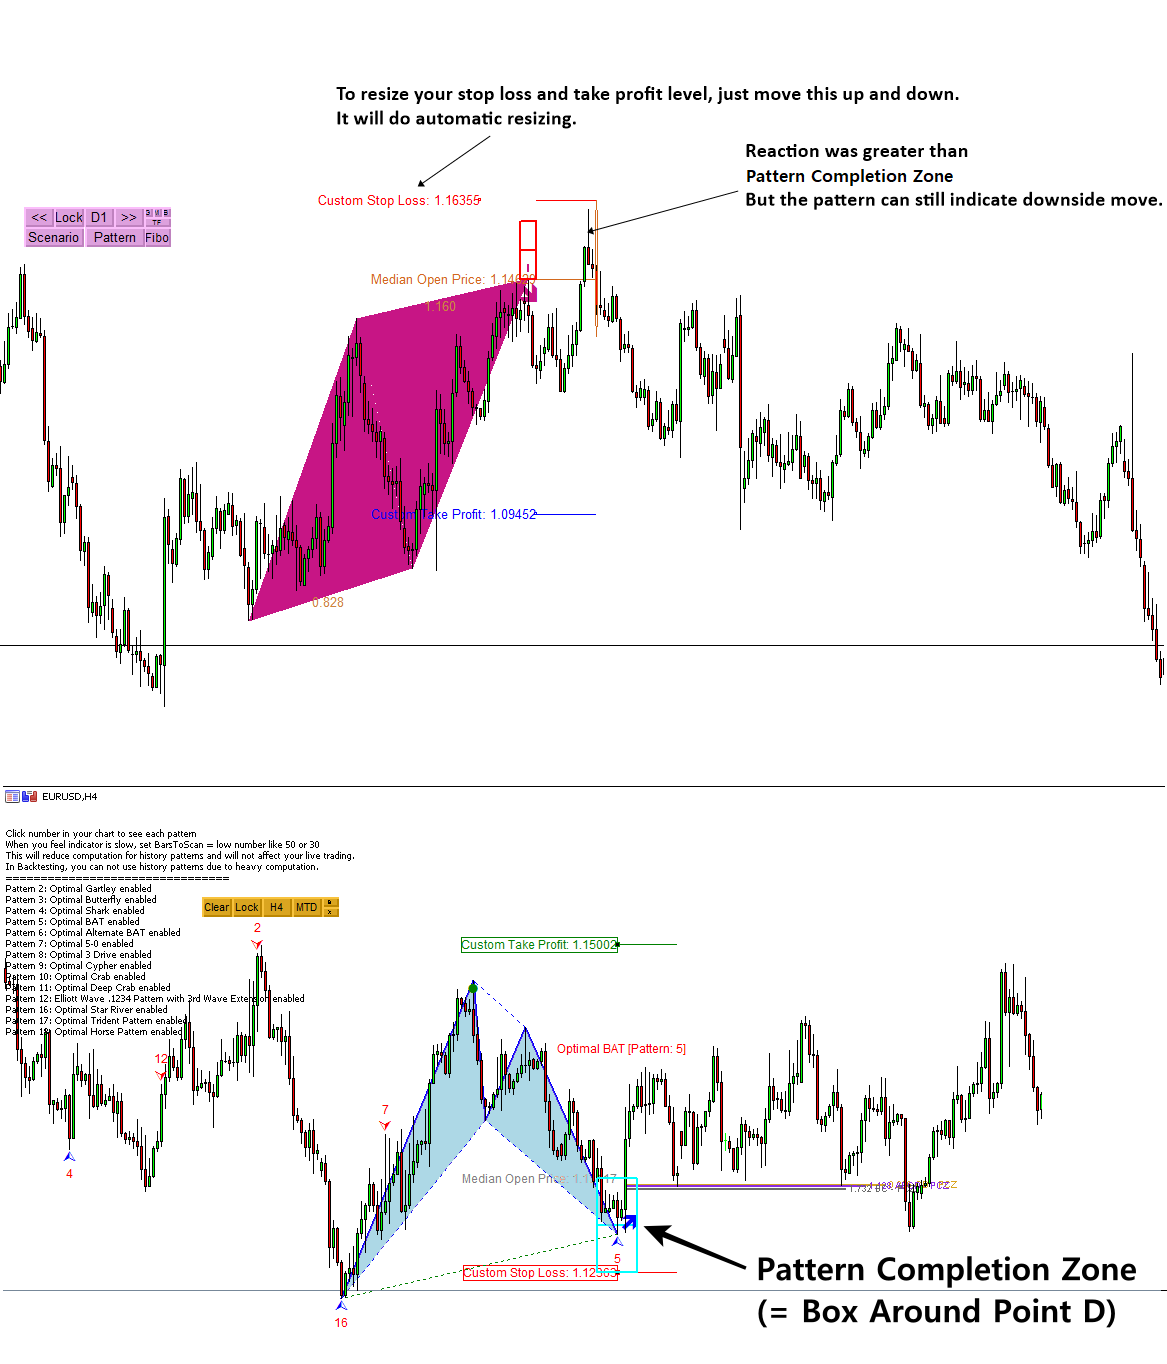
Trading zone in technical analysis is the extended concept from the horizontal support and resistance. The zone is the great tool to decide your trading entry and exit as well as managing your risk and reward. Especially, when the zone is drawn around the significant peak and trough, the value for the trading zone is precious. When you use Harmonic Pattern or X3 Chart Pattern, the trading zone can be identified using the Pattern Completion Interval. The detailed process is well described in the Book: Guide to Precision Harmonic Pattern Trading (2016). When you use the supply demand analysis, the zone is identified from the base location. Especially, it is even better if the trading zone is non repainting. The non repainting zone become the powerful tool to decide the entry and exit for your trading because they stay in the location always as the reference.
https://play.google.com/store/books/details?id=8SbMDwAAQBAJ
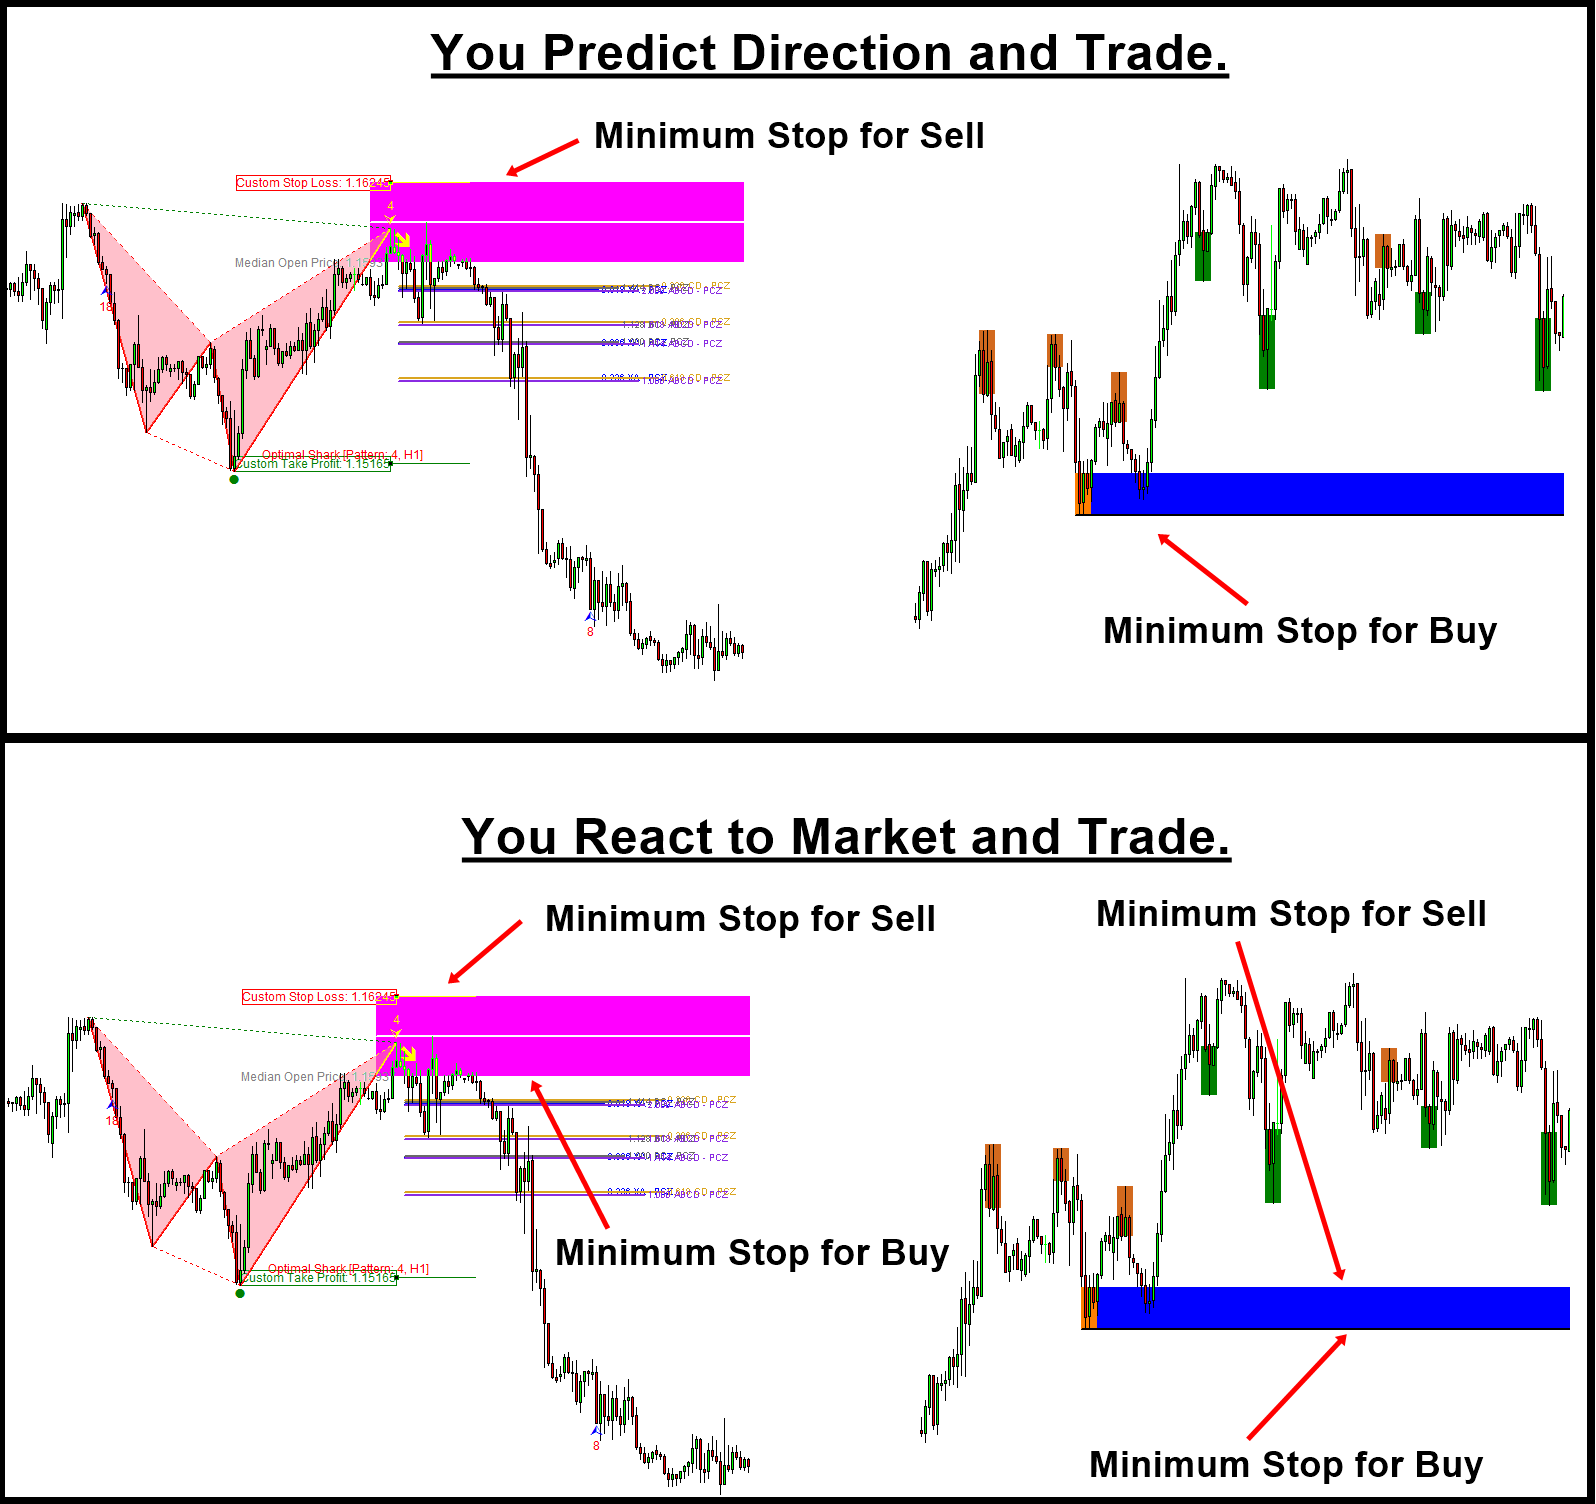
The trading zone is useful if your trading strategy is based on predicting the market direction. In such a case, the trading zone can provide a sensible place for stop loss. Then you can scale up your take profit target according to your anticipated location. Even if your trading strategy is not based on predicting market direction, the trading zone is still useful. For example, let’s say that you never want to predict the market, but you want to react the market so that you will trade in the direction in which the price is pushed by crowd like support and resistance style. In this case, the trading zone acts like the horizontal support resistance. But the managing your reward and risk is much easier than other mean of support and resistance.
I used the word minimum stop loss instead of the stop loss because sometimes, you might need to make your stop loss slightly bigger than the actual zone. The margin for the stop loss will be depending on your reward to risk ratio. How this reward to risk system works is well described in the latest book: Technical Analysis in Forex and Stock Market (2021).
https://play.google.com/store/books/details?id=pHlMEAAAQBAJ
For your information, we also provide the MetaTrader 4 and MetaTrader 5 indicators that provide the non repainting trading zone. You can have a look at these automated scanner, which you can trade with the direction prediction strategy as well as the react to market strategy.
Here is the link to Ace Supply Demand Zone Indicator for MetaTrader 4/MetaTrader 5.
https://www.mql5.com/en/market/product/40076
https://www.mql5.com/en/market/product/40075
https://algotrading-investment.com/portfolio-item/ace-supply-demand-zone/
Here is the link to X3 Chart Pattern Scanner for MetaTrader 4/ MetaTrader 5.
https://www.mql5.com/en/market/product/41993
https://www.mql5.com/en/market/product/41992
https://algotrading-investment.com/portfolio-item/profitable-pattern-scanner/

Young Ho Seo
Generating Income with Chart Patterns
Profitable Chart Patterns include Fibonacci Price Patterns, Harmonic Patterns, Elliott Wave, X3 Chart Patterns as well as many other tradable patterns.
Chart Patterns are the good buy and sell signal generator for trading. It provides you the early signal at the turning point. Unlike other technical indicator, you are not lagging with these patterns. Hence you can always move ahead of other trader.
In addition, it is useful because it is extremely easy to combine with other analysis technique in your trading decision. In this short book, we provide the details of these chart patterns in Forex market with some practical tutorials.
In this book below, we explain how to make the best use of Chart Patterns for your trading. What is even better, we have included the bonus chapter of support and resistance.
Website links: https://algotrading-investment.com/portfolio-item/profitable-chart-patterns-in-forex-and-stock-market/
Below is the Harmonic pattern, Elliott Wave patterns and X3 pattern detection tools developed for MetaTrader, the most popular Forex Trading platform.
1. Harmonic Pattern Plus
One of the first automated Harmonic Pattern detection tool released in 2014. It can detect 11 most popular harmonic patterns with well-defined trading entries and stops. Pattern Completion Interval, Potential Reversal Zone and Potential Continuation Zone are supported. In addition, other dozens of powerful features are added like Japanese candlestick detection, etc. Because of affordable price, this harmonic pattern detection indicator is loved by many traders.
https://www.mql5.com/en/market/product/4488
https://www.mql5.com/en/market/product/4475
https://algotrading-investment.com/portfolio-item/harmonic-pattern-plus/
2. Harmonic Pattern Scenario planner
It is an advanced Harmonic Pattern indicator. On top of the features of Harmonic Pattern Plus, you can also predict future harmonic patterns through simulation. This is the tactical harmonic pattern tool designed for Professional harmonic pattern trader. Because of affordable price, this harmonic pattern detection indicator is loved by many traders.
https://www.mql5.com/en/market/product/6240
https://www.mql5.com/en/market/product/6101
https://algotrading-investment.com/portfolio-item/harmonic-pattern-scenario-planner/
3. X3 Chart Pattern Scanner
X3 Chart Pattern is our next generation Chart Pattern Scanner. This is non-repainting and non-lagging Harmonic Pattern Indicator. On top of that, this tool can detect Elliott Wave Pattern and X3 Chart Patterns. It can detect over 20 Chart Patterns. The bonus is that you can also detect around 52 Japanese candlestick patterns.
https://www.mql5.com/en/market/product/41993
https://www.mql5.com/en/market/product/41992
https://algotrading-investment.com/portfolio-item/profitable-pattern-scanner/

Young Ho Seo
Beat Inflation Together Discounts for MetaTrader Indicator
Global Inflation, what now? We thought that we will enjoy some recovery from the COVID 19 crisis. However, soon there comes a serious economy crysis from the rising inflation. This affect the global economy increasing the uncertainity, inflation, and interest rate. This is not nice. Everything on the street are getting more and more expensive including energy, food, cloth, house and so on. We really deserve some good time after the two years of suffering from the Covid 19.
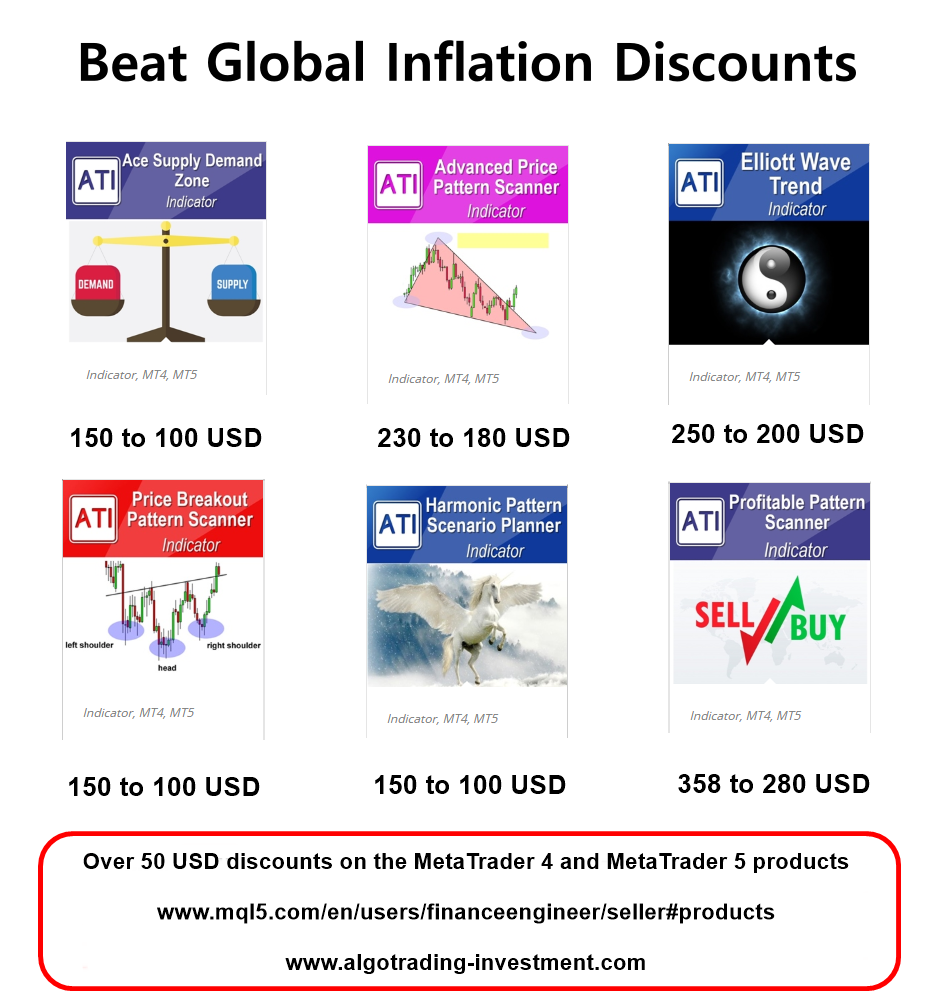
We know this global inflation affect the whole world. Hence, we provide 50 USD discounts on the six MetaTrader 4 and six MetaTrader 5 products. So we provide special discounts for 12 MetaTrader products all together.
Discounted price is shown in the screenshot for the following six products.
Ace Supply Demand Zone indicator
Advanced Price Pattern Scanner
Elliott Wave Trend
Price Breakout Pattern Scanner
Harmonic Pattern Scenario Planner
X3 Chart Pattern Scanner (=Profitable Pattern Scanner)
This discounted price is only available when you buy these products from mql5.com
The price will go back to the original price when the discounts ends. Please take the discounted price now while it last only.
https://www.mql5.com/en/users/financeengineer/seller#products
https://www.algotrading-investment.com/
On top of the special discounts for MetaTrader 4 and MetaTrader 5 products, we have another gift for you. We are selling all our Books in special discount price. All our books are currently selling in just 3 dollar at the discount. The original price was 9.99 dollar for each book. Hence, you save 6 dollar per a book. We will keep this discounted price for these books until this campaign lasts. Get them now when they are cheap. Get the good self education towards the day trading and technical analysis to achieve financial freedom.
Below we provide the title of the books at the discounted price.
Science Of Support, Resistance, Fibonacci Analysis, Harmonic Pattern, Elliott Wave and X3 Chart Pattern (In Forex and Stock Market Trading)
Profitable Chart Patterns in Forex and Stock Market (Fibonacci Analysis, Harmonic Pattern, Elliott Wave, and X3 Chart Pattern)
Guide to Precision Harmonic Pattern Trading (Mastering Turning Point Strategy for Financial Trading)
Scientific Guide to Price Action and Pattern Trading (Wisdom of Trend, Cycle, and Fractal Wave)
Predicting Forex and Stock Market with Fractal Pattern: Science of Price and Time
Technical Analysis in Forex and Stock Market (Supply Demand Analysis and Support Resistance)
Below we provide the link of the Books at the discounted price.
https://algotrading-investment.com/portfolio-item/science-of-support-resistance-fibonacci-analysis-harmonic-pattern/
https://algotrading-investment.com/portfolio-item/profitable-chart-patterns-in-forex-and-stock-market/
https://algotrading-investment.com/portfolio-item/guide-precision-harmonic-pattern-trading/
https://algotrading-investment.com/portfolio-item/scientific-guide-to-price-action-and-pattern-trading/
https://algotrading-investment.com/portfolio-item/predicting-forex-and-stock-market-with-fractal-pattern/
https://algotrading-investment.com/portfolio-item/technical-analysis-in-forex-and-stock-market/

Young Ho Seo
Harmonic Pattern – Turning Point and Trend
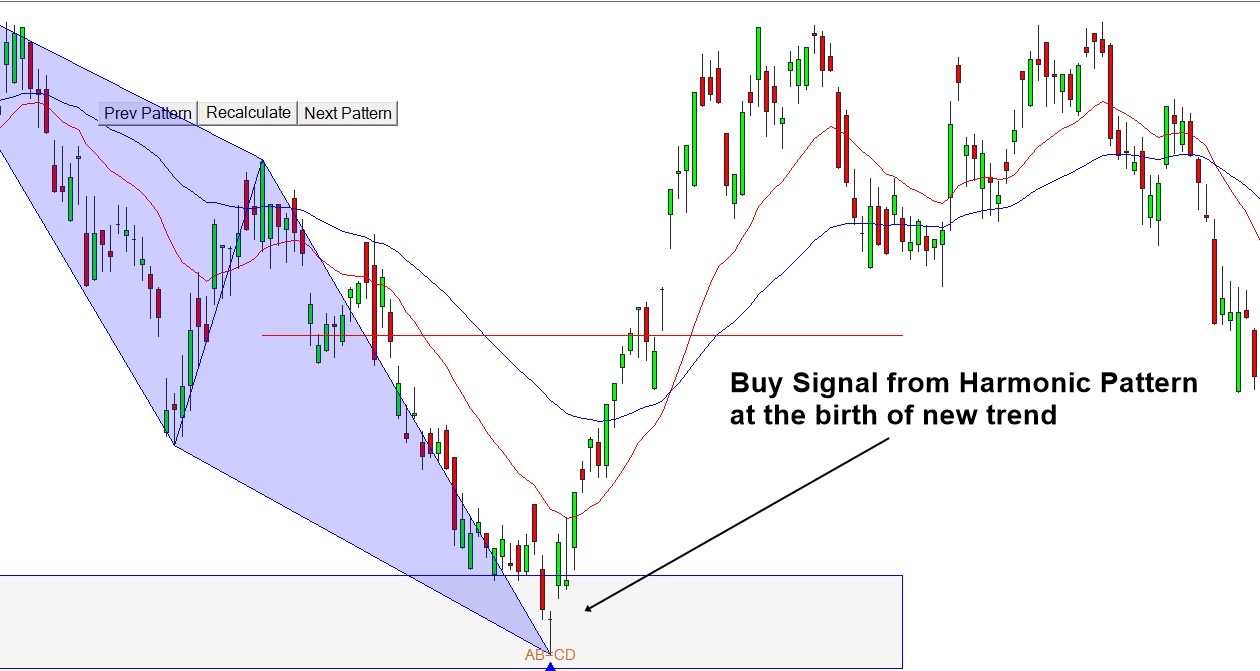
This article “Turning Point and Trend” tries to answer you on when to use Harmonic Pattern Trading in terms of the four market cycle including Birth, Growth, Maturity and Death. If you want to become profitable trader, then you need to decide when your capital to dive into the market. The best way is doing it with the market rhythm, i.e. the market cycle. This article will provide you the clear answer on how to tune your entry with the market. This is the first step for any trader in choosing their strategy in fact. You would also revise the pros and cons of the turning point strategy, semi turning point strategy and trend strategy.
https://algotrading-investment.com/2019/07/06/turning-point-and-trend/
Below are the list of automated Harmonic pattern Indicator developed for MetaTrader 4 and MetaTrader 5 platform.
Harmonic Pattern Plus
One of the first automated Harmonic Pattern detection tool released in 2014. It can detect 11 most popular harmonic patterns with well-defined trading entries and stops. Pattern Completion Interval, Potential Reversal Zone and Potential Continuation Zone are supported. In addition, other dozens of powerful features are added like Japanese candlestick detection, etc. Because of affordable price, this harmonic pattern detection indicator is loved by many traders. Please note that this is repainting and non lagging harmonic pattern trading system.
https://www.mql5.com/en/market/product/4488
https://www.mql5.com/en/market/product/4475
https://algotrading-investment.com/portfolio-item/harmonic-pattern-plus/
Harmonic Pattern Scenario planner
It is an advanced Harmonic Pattern indicator. On top of the features of Harmonic Pattern Plus, you can also predict future harmonic patterns through simulation. This is the tactical harmonic pattern tool designed for Professional harmonic pattern trader. Because of affordable price, this harmonic pattern detection indicator is loved by many traders. Please note that this is repainting and non lagging harmonic pattern trading system.
https://www.mql5.com/en/market/product/6240
https://www.mql5.com/en/market/product/6101
https://algotrading-investment.com/portfolio-item/harmonic-pattern-scenario-planner/
Both Harmonic pattern plus and Harmonic Pattern Scenario planner are the excellent trading system at affordable cost. However, if you do not like repainting Harmonic pattern indicator, then we also provide the non repainting and non lagging harmonic pattern trading. Just check the X3 Chart Pattern Scanner below.
Link to X3 Chart Pattern Scanner
https://www.mql5.com/en/market/product/41993
https://www.mql5.com/en/market/product/41992
https://algotrading-investment.com/portfolio-item/profitable-pattern-scanner/

Young Ho Seo
Winning Trading Logic – Detecting Supply and Demand Unbalance
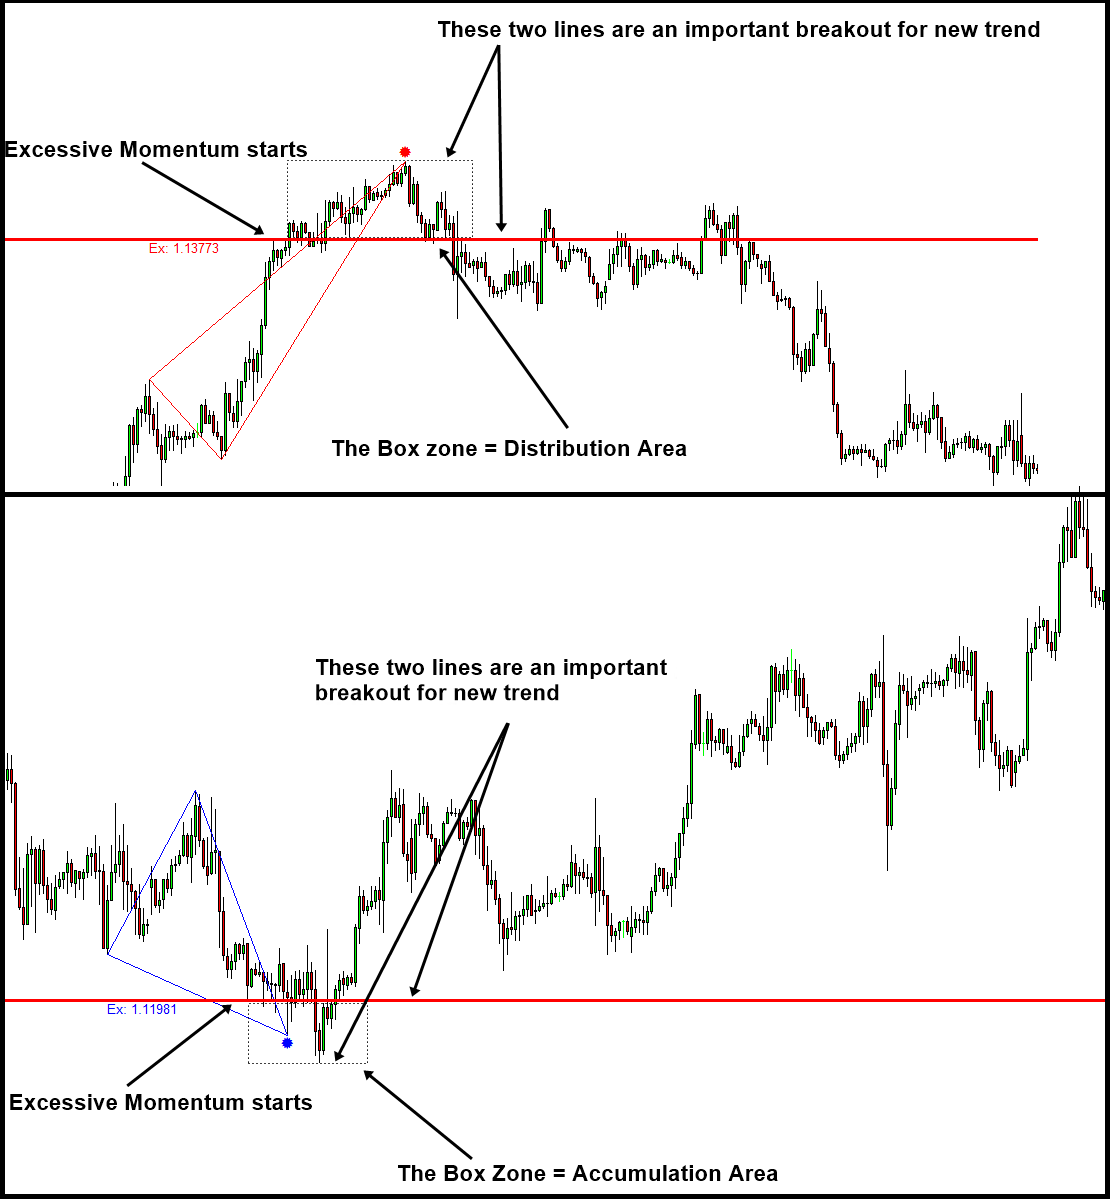
As we have pointed out in our article, detecting the supply and demand unbalance is the most important key in making profits in Financial market. The excessive momentum indicator is the automated tool to detect these unbalance in supply and demand for your trading. With excessive momentum drawn in your chart, it is much easier to predict the timing of new trend and its direction.
Here is the insightful article explaining where the profits comes and how the profits are captured with the knowledge of excessive momentum. If you really want to make money in the market, must read this article. Reading does not cost you anything.
https://algotrading-investment.com/2018/10/29/introduction-to-excessive-momentum-trading/
This Excessive Momentum Zone can be considered as either Accumulation or Distribution area in the Volume Spread Analysis. You can further find the symptoms of accumulation and distribution area using our Volume Spread Pattern Indicator (Paid and Advanced version) or Volume Spread Pattern Detector (Free and Light version). You can watch the YouTube videos to find more about the Excessive Momentum Indicator.
YouTube Video Momentum Indicator: https://youtu.be/oztARcXsAVA
Here is link to Excessive Momentum Indicator available on MetaTrader 4 and MetaTrader 5 platform.
https://algotrading-investment.com/portfolio-item/excessive-momentum-indicator/
https://www.mql5.com/en/market/product/30641
https://www.mql5.com/en/market/product/30621

Young Ho Seo
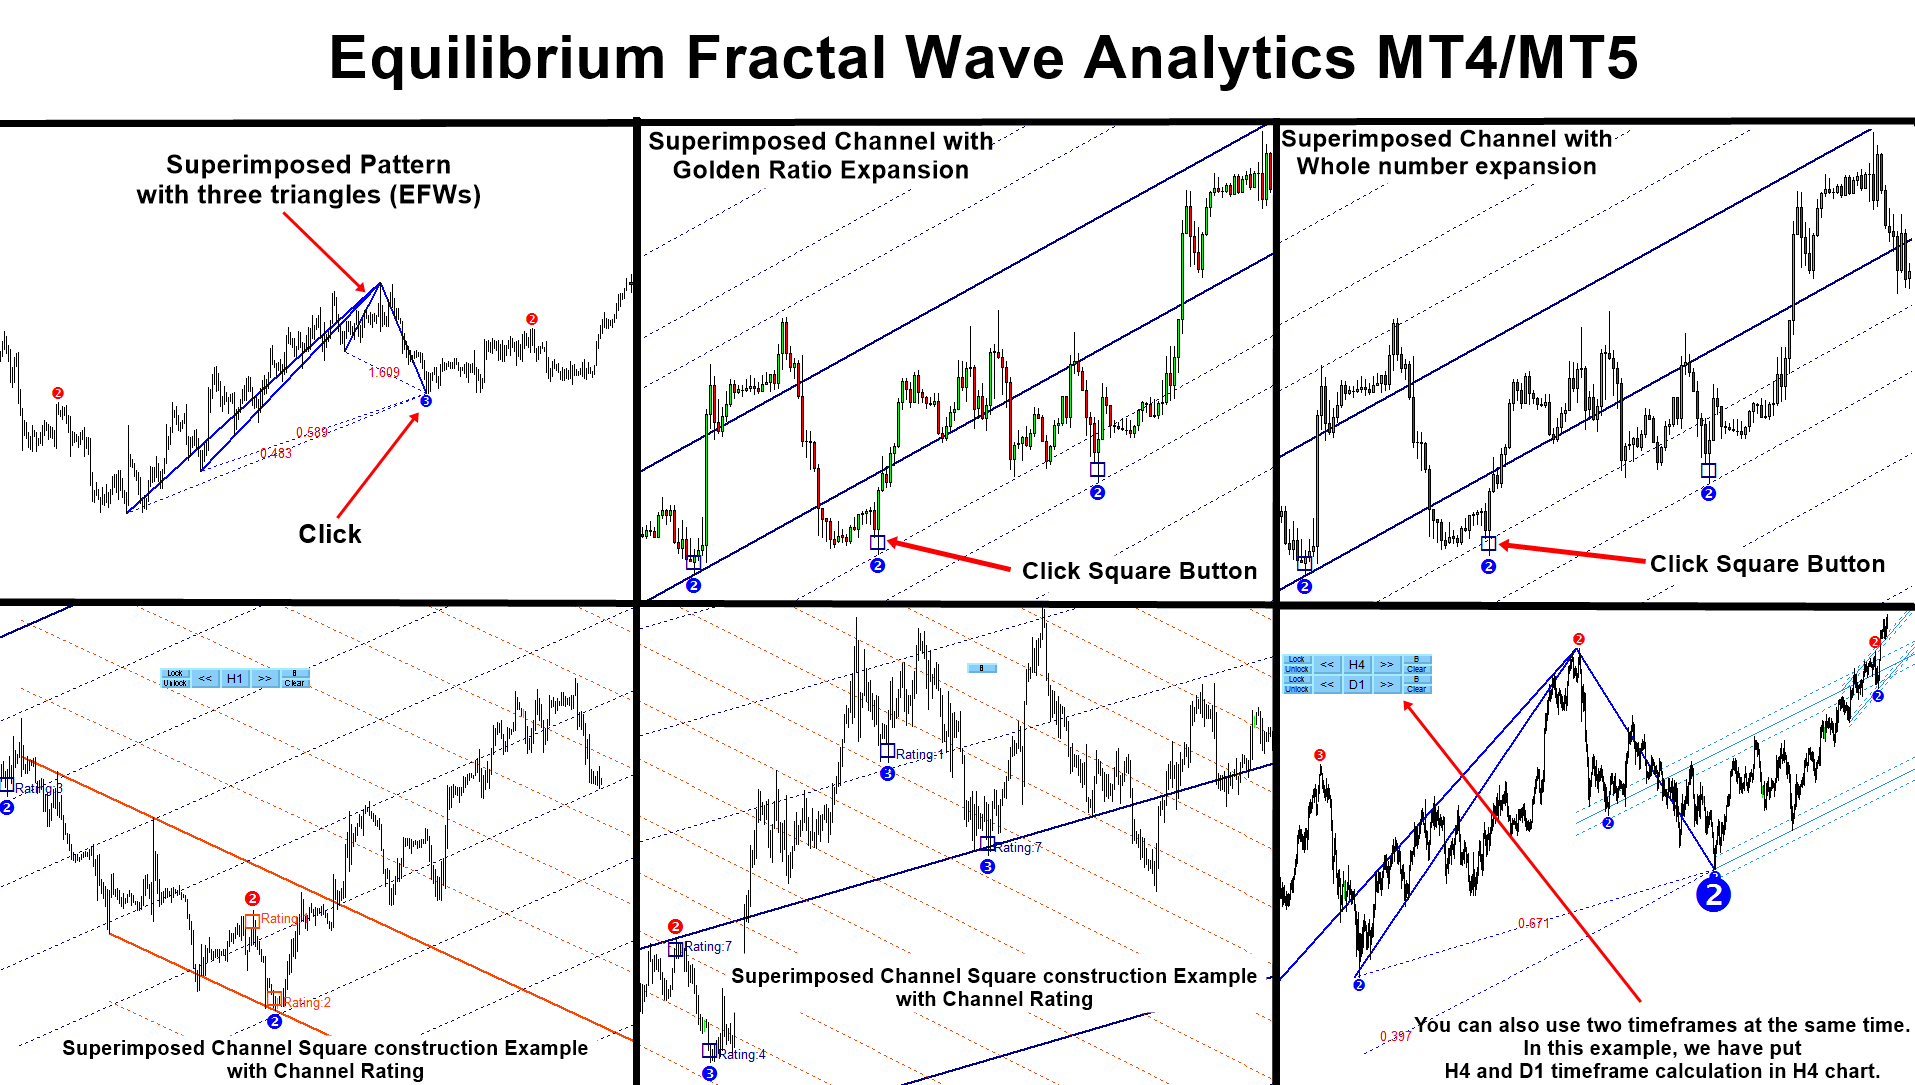
Introduction to Equilibrium Fractal Wave Analytics
EFW Analytics was designed to accomplish the statement “We trade because there are regularities in the financial market”. EFW Analytics is a set of tools designed to maximize your trading performance by capturing the repeating fractal geometry, known as the fifth regularity in the financial market. The functionality of EFW Analytics consists of three parts including:
1. Equilibrium Fractal Wave Index: exploratory tool to support your trading logic to choose which ratio to trade
2. Superimposed Pattern Detection as turning point analysis
3. Superimposed Channel for market prediction with Golden ratio expansion
4. Superimposed Channel for market prediction with whole number expansion
5. Equilibrium Fractal Wave (EFW) Channel detection
6. Superimposed Channel Rating (Higher rating = higher predictive power)
EFW Analytics provide the graphic rich and fully visual trading styles. In default trading strategy, you will be looking at the combined signal from Superimposed pattern + EFW Channel or Superimposed pattern + Superimposed Channel. In addition, you can perform many more trading strategies in a reversal and breakout mode. You can also run two different timeframes in one chart to enforce your trading decision. Sound alert, email and push notification are built inside the indicator.
Below is the link to the EFW Analytics:
https://algotrading-investment.com/portfolio-item/equilibrium-fractal-wave-analytics/
https://www.mql5.com/en/market/product/27703
https://www.mql5.com/en/market/product/27702

Young Ho Seo
Japanese CandleStick Pattern with Price Pattern
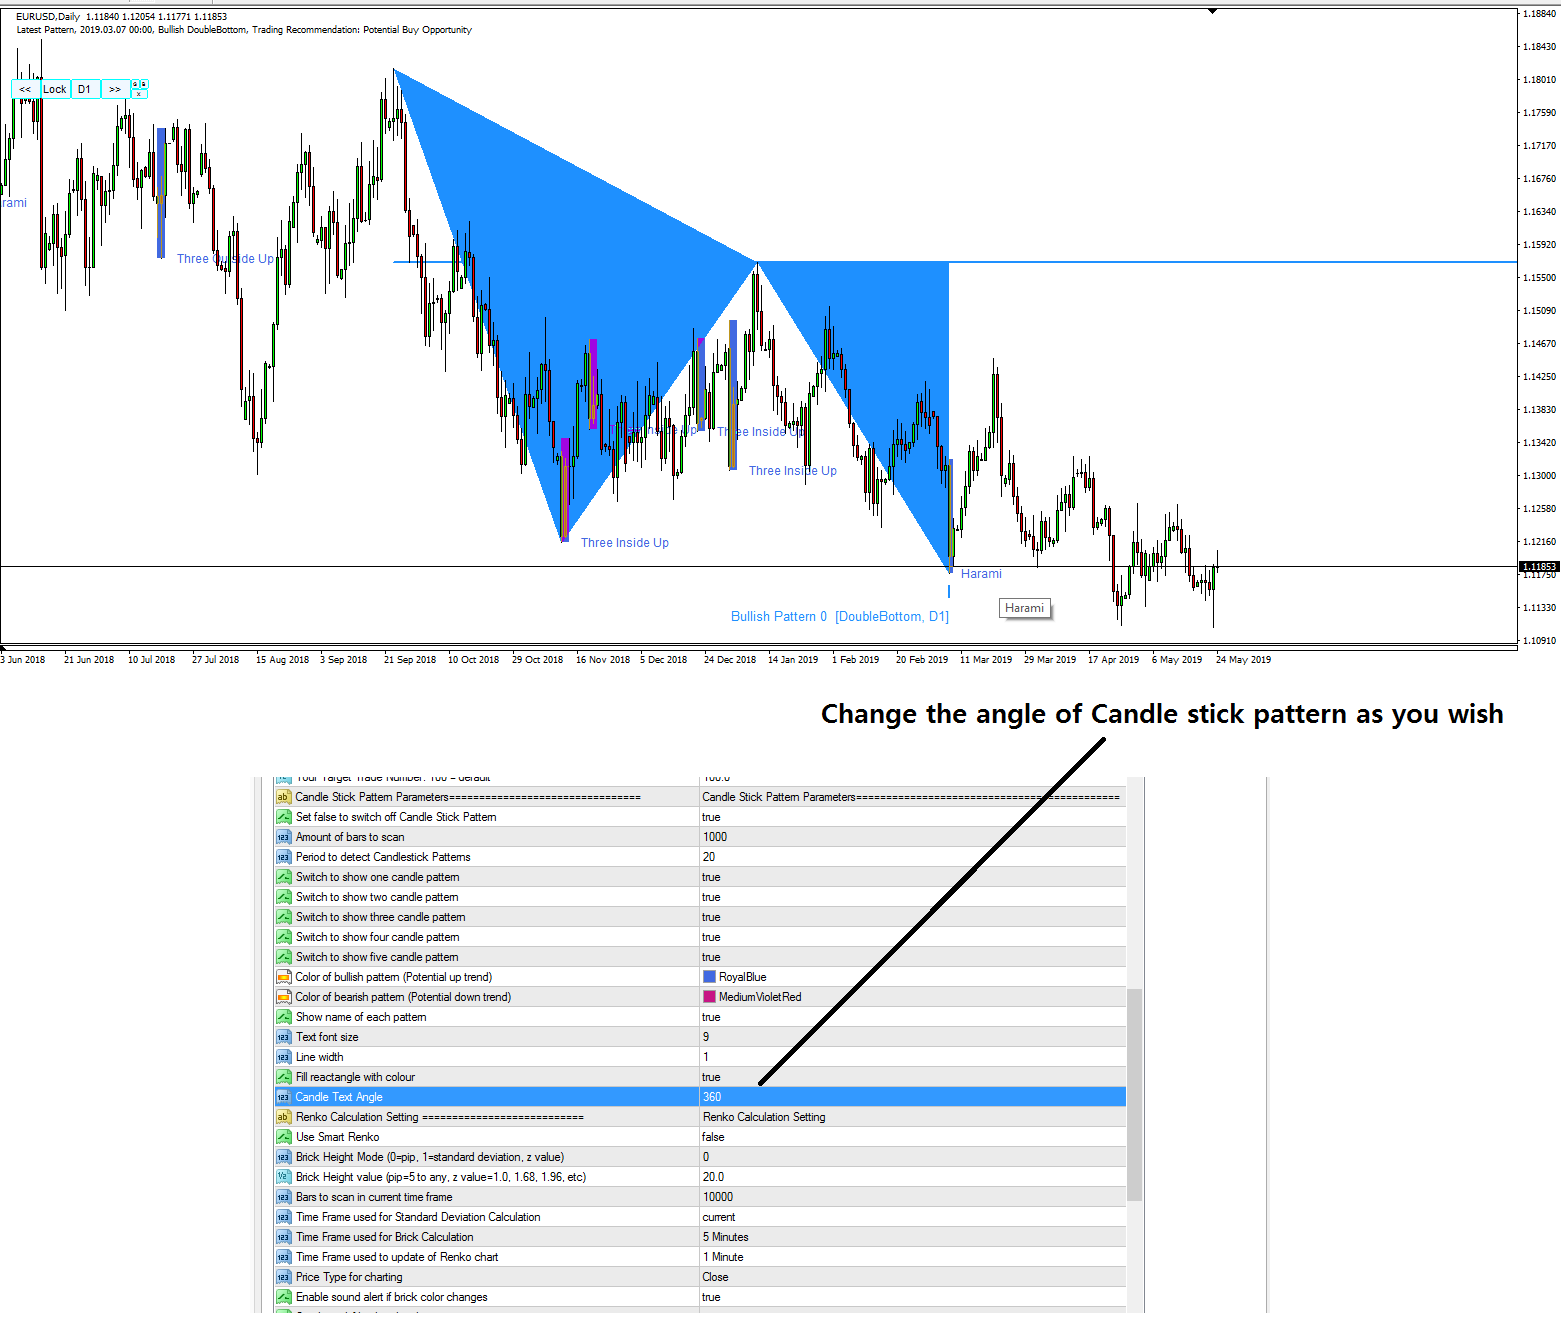
Japanese candlestick pattern and price patterns like Triangle pattern, Falling Wedge, Rising Wedge, Double Top and Head and Shoulder patterns are often used to make buy and sell trading decision in Forex and Stock market. Have you ever thought using these two excellent patterns together for your trading ? Inside Price Breakout Pattern Scanner, you can access to the price patterns like Triangle, Falling Wedge, Rising Wedge, Double Top and Head and Shoulder patterns. At the same time, Japanese candle stick patterns are also built inside Price Breakout Pattern Scanner. This Japanese candlestick patterns are the kind of bonus feature for the trader who are using Price Breakout Pattern Scanner.
So what Japanese candlestick patterns can be detected with Price Breakout Pattern Scanner ? Including Doji Star, Hammer, Englufing, etc, you can asscess around 52 Japanese candlestick patterns. In Japanese candlestick inputs, you can switch on and off Candlestick pattern according to their type. For example, there are Japanese candlestick pattern made up from one candle bar, two candle bar, three candle bar, etc. You can switch on and off each according to your preference.
As a default setting, Pattern Name will be printed in chart. At the same time, you can bring your mouse over to each Japanese candlestick pattern to float pattern name in tool tip box (MT5 is more responsive than MT4 for this tool tip box) Alternatively, you can also change the angle of pattern name from horizontal to vertical or vice versa depending on your readability. In addition, we provide the YouTube Video for Price Breakout Pattern Scanner. With the video, you can see some basic operation of the price breakout pattern scanner. This video is applicable to both MetaTrader 4 and MetaTrader 5 platforms.
YouTube Video “How To Use Price Breakout Pattern Scanner”: https://www.youtube.com/watch?v=aKeSmi_Di2s
Here is the link to the Price Breakout Pattern Scanner.
https://www.mql5.com/en/market/product/4859
https://www.mql5.com/en/market/product/4858
https://algotrading-investment.com/portfolio-item/price-breakout-pattern-scanner/

Young Ho Seo
Turning Point and Trend
If you want to become the profitable trader, the first thing you need to understand is turning point and trend in the financial market. If you read many trading articles and books, you will find the diverse opinion over turning point and trend. Many people view turning point and trend as two separate subjects. However, it might be better to understand turning point and trend as two parts inside one body. Let us try to understand the trend. To do so, let us take human as an analogical example. We are born, we grow up, we become mature, and then we die. During this process, we can observe that there are four main stages. These four stages are universal across many creatures and objects observable in the earth.
Birth – Growth – Maturity – Death
Trend also goes through these four stages. Let us take an example in the financial market. For example, if we hear that Apple has some temporary problem in their smartphone supply line, this could stir up the Samsung’s Stock price because the demand for Samsung’s smart phone will be increased. Once this news is spread on the financial market, the upward trend will be born for Samsung’s stock price. At the beginning, this news could be known by few people. Later, more and more people could hear this news. Hence, Samsung’s stock price can build up upward momentum. However, this momentum will not last forever. Once people start to recognize that price rallied too high and some people start taking the profit by selling the stocks, the upward momentum can slow down. Especially, if we hear that Apple recovered the temporary problem in their smartphone supply line, the trend could die completely. As shown in this example, Birth, Growth, Maturity, and Death are the life cycle of trend.
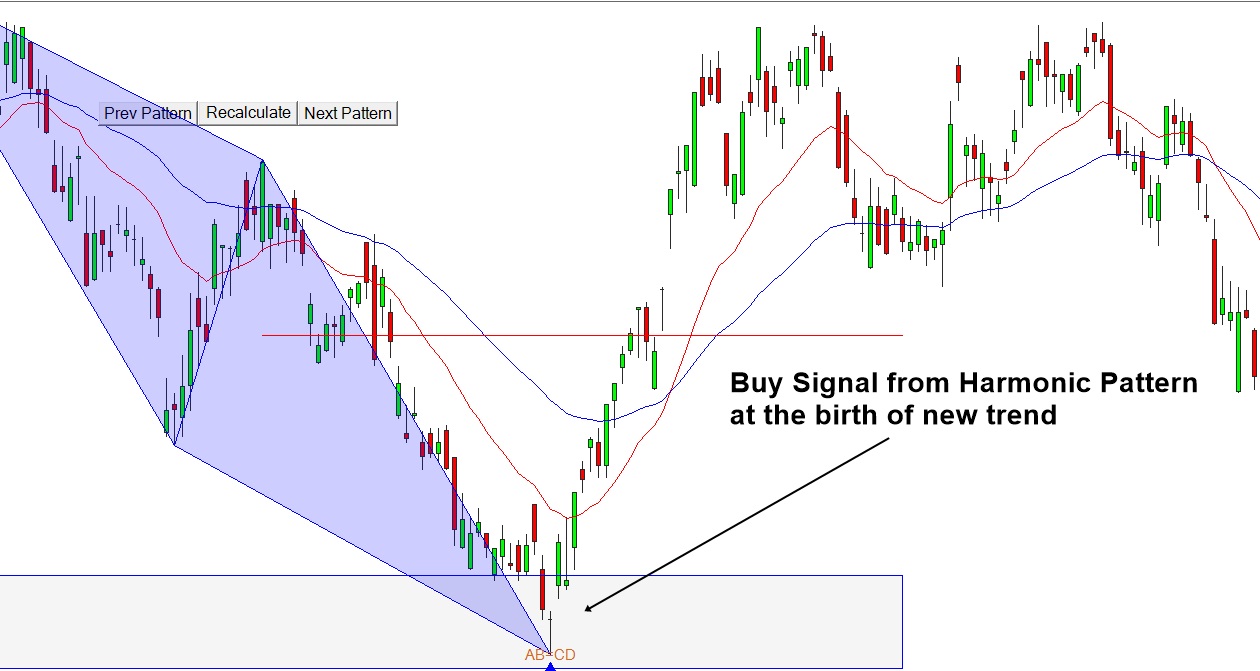
Now let us revisit the definition of turning point and trend. Turning point is the beginning of new trend after the old trend died off. Hence, turning point strategy refers to the strategy that tries to pick up this new trend as early as possible. This sometimes involves picking up the turning point at the birth stage of the trend. In financial trading, trend strategy typically refers to the strategy that tries to pick up established trend during the growth stage. Most of trend strategy is in fact momentum strategy. When the growth of trend is strong, many technical indicators are designed to react on this strong growth. For example, if you trade on the buy signal when 20 moving average line crosses over the 50 moving average line, you do need strong upwards movement to lift the 20 moving average line over the 50 moving average line.
In contrast to this, in turning point strategy like Fibonacci price patterns, Harmonic patterns and Elliott wave patterns, we are looking for the newly born trend instead of the trend in growth stage. Hence, the main difference in turning point and trend strategy is when to enter during the life cycle of trend. Typically, we are seeking to enter near the birth of trend in the turning point strategy. In trend strategy, we are seeking to enter at the growth strategy of trend.
You can read full article here. This article explains everything about Turning Point and Trend.
https://algotrading-investment.com/2019/07/06/turning-point-and-trend/
YouTube Video About Turning Point and Trend
YouTube Link: https://youtu.be/mtqmOiN13lk
In addition, we will introduce two Harmonic Pattern Indicator including Harmonic Pattern Plus and Harmonic Pattern Scenario planner. These Harmonic Pattern Indicator is repainting. However, they provide tons of powerful features at affordable price. Hence, if you do not mind the repainting Harmonic Pattern Indicator, then you can use these two tools. In addition, you can use X3 Chart Pattern Scanner together with Harmonic Pattern Plus or Harmonic Pattern Scenario Planner.
Harmonic Pattern Plus (Type 1)
Harmonic pattern plus is extremely good product for the price. With dozens of powerful features including Pattern Completion Interval, Potential Reversal Zone, Potential Continuation Zone, Automatic Stop loss and take profit sizing.
Below are the Links to Harmonic Pattern Plus
https://www.mql5.com/en/market/product/4488
https://www.mql5.com/en/market/product/4475
https://algotrading-investment.com/portfolio-item/harmonic-pattern-plus/
Harmonic Pattern Scenario Planner (Type 1 + Predictive feature)
With additional features of predicting future harmonic patterns, this is very tactical harmonic pattern indicator with advanced simulation capability on top of the powerful features of harmonic pattern plus.
Below are the Links to Harmonic Pattern Scenario Planner
https://www.mql5.com/en/market/product/6101
https://www.mql5.com/en/market/product/6240
https://algotrading-investment.com/portfolio-item/harmonic-pattern-scenario-planner/

Young Ho Seo
Applying Turing Point Prediction in Forex Market
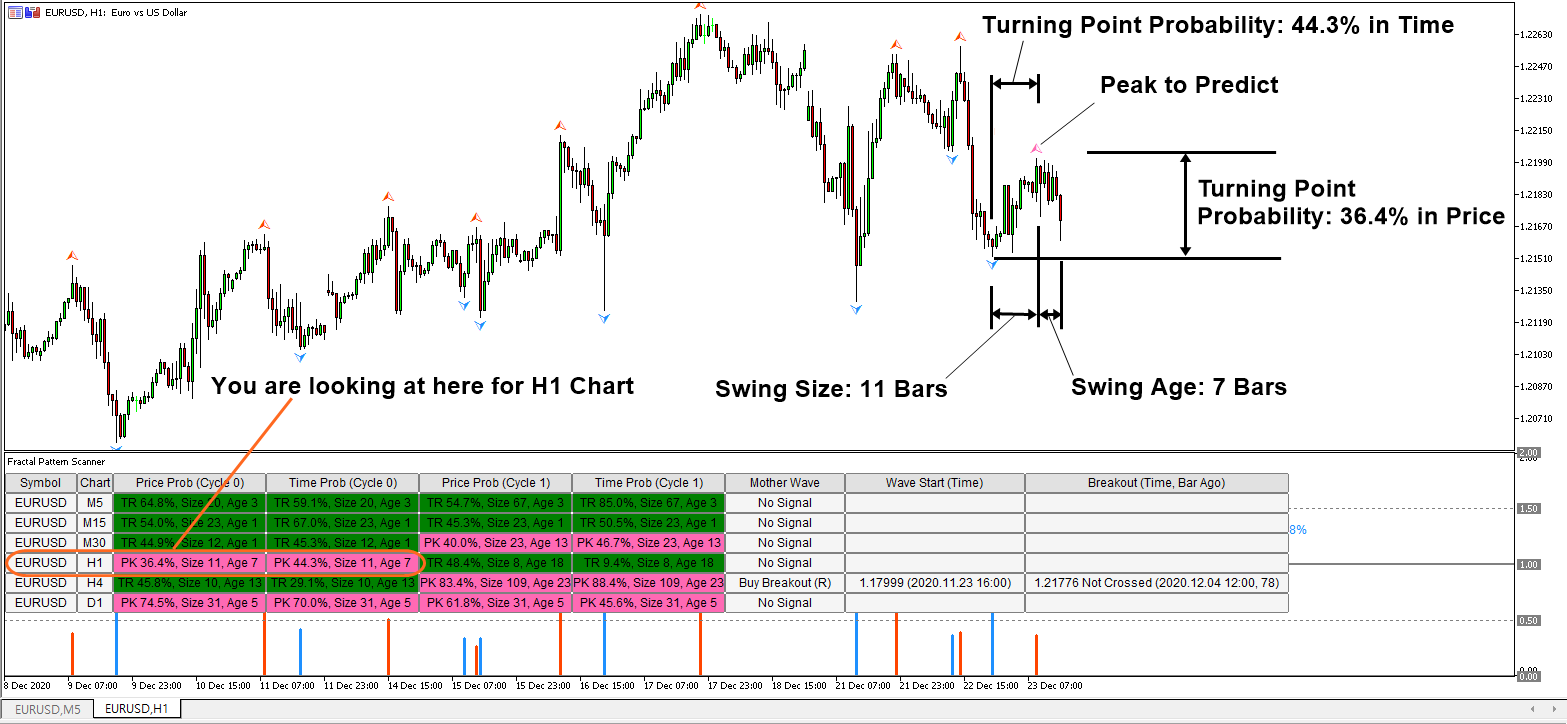
In this article, we provide an explanation on how to apply the turning point prediction in Forex Market. Here we will be using Swing Size and Swing Age variable to identify the turning point probability for each price swing.
Swing Age is the count of candle bars from latest bar to the swing right end.
Swing Size is the count of candle bars from the swing right end to swing left end
As these two variable provides you the relative coordinate of the right end and left end of the price swing, you can locate the turning point value for each price swing. Check the screenshot to clarify your understanding.
In terms of application, the turning point prediction is useful as it quantifies your risk for trading between 0.0 and 1.0 (or 100%). Quantification in your trading is always good because you have something to stick as a guidance for your trading. When you do not have the guidance, you will often find that your emotion will ruin your trading.
There are two basic concepts in regards to the probability and some advanced concepts in regards to Mother Wave and Child Wave. For your own good, everyone should understand the basic concepts if you want to improve your trading performance in long run.
In the first basic concept, if the price reaches the turning point probability above 0.7 (or 70%), in this turning point probability range, you can look for the potential reversal opportunity. In another words, it is the good point to detect the directional change in the market. It could be either correction or global turning point.
In the second basic concept, if the price reaches the turning point probability between 0.0 and 0.5 (or 50%), you can find the good breakout opportunity. In another words, it is the good point to detect the continuation in the price movement. We will omit the advanced concepts here as it was already explained elsewhere.
If you do not have an access to the Turning Point Prediction, then it is fine as we provide the Turning Point Prediction for Forex Market for free. Anyone can access the standard turning point prediction for your day trading for free of charge from the link below.
https://algotrading-investment.com/2020/10/23/price-prediction-for-day-trading/
At the same time, if you want to have the scanner for the MetaTrader 4 or MetaTrader 5, here is the links to Fractal Pattern Scanner. In Fractal Pattern Scanner, you can access the turning point probability scanner + mother wave breakout signals, reversal signals, and many more advanced features.
https://www.mql5.com/en/market/product/49170
https://www.mql5.com/en/market/product/49169
https://algotrading-investment.com/portfolio-item/fractal-pattern-scanner/

Young Ho Seo
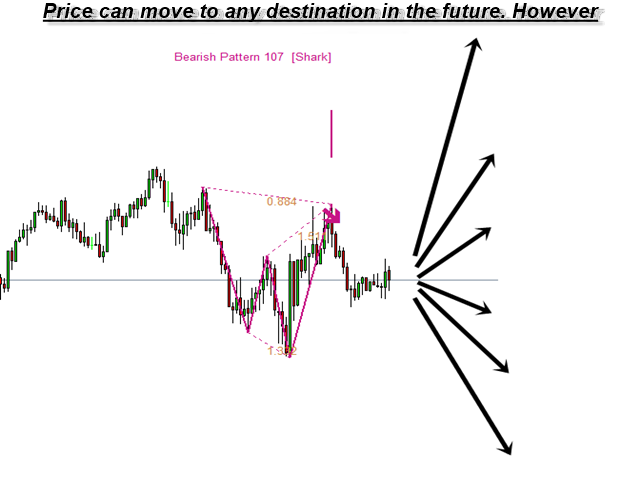
Harmonic Pattern Indicator Explained
In this article, we will explain the type of Harmonic Pattern Indicator used for Forex and Stock trading. Firstly, there are several variations of Harmonic pattern indicators used by the trading community. Not all the harmonic pattern indicators are the same. The main variations of Harmonic pattern indicators can be categorized as following three different types depending on the algorithm used inside the indicator. Each type of Harmonic Pattern Indicator has its own pros and cons. We will go through each type of Harmonic Pattern Indicator in this article one by one. In addition, we will also discuss the hybrid of these three variations, called non repainting and non lagging Harmonic Pattern Indicator at the end of this article for your information.
Type 1: Non lagging (fast signal) but repainting – option to enter from turning point. Indicator does not show the failed pattern in chart and last pattern can repaint.
Type 2: Lagging (slow signal) but non repainting – no option to enter at turning point. Indicator does not show the failed pattern but last pattern does not repaint.
Type 3: Detecting pattern at point C but repainting – option to enter at turning point. Indicator detect pattern too early and you have to wait until the point D. Pattern may not achieve point D. Indicator does not show the failed pattern and last pattern can repaint.
Type 1. Non lagging (fast signal) but repainting
First type is non lagging but repainting harmonic indicators. This sort of Harmonic pattern indicator is the typical harmonic pattern indicators used by many traders. The advantage is that you do get the signal early as possible. You have an opportunity to trade from the turning point all the ways down to the continued trend. The disadvantage is that you are not able to test your strategy in chart because this type of harmonic pattern indicator does not show the entry of the failed patterns in chart but only successful one. In fact, Harmonic Pattern Plus and Harmonic Pattern Scenario Planner are under this category. They would provide the fastest signal but you will not able to test your strategy in your chart because they do not show the failed entry in chart.
Type 2. Lagging (slow signal) but non repainting
The second type is that lagging but non repainting. Some people use pretty words like minimal lag Harmonic pattern indicator or etc. But really lagging is just lagging. You can not make it really pretty though. As the literal meaning of lagging indicates, this type of harmonic pattern indicators provide you the lagging signal comparing to the first type. It will only provide you the signal after some times passed the turning point. Hence, you do not have an option to consider your entry from turning point. Depending on the pattern size, sometimes, the lagging can be only several bars but it can range up to several dozens of bars like 30 or 60 bars. Sometimes, your entry might be at the first reversal after the turning point. Hence you have be careful with this sort of entry. The advantage is that you will not experience repaint with the latest pattern though. I am not sure if non repainting property can offset the disadvantage of lagging signals because professional harmonic pattern traders are looking for the turning point entry.
You can read full article here. This article explains everything about Harmonic Pattern.
https://algotrading-investment.com/2022/06/22/harmonic-pattern/
We will introduce several Harmonic Pattern Indicator based on what we have discussed so far in this article.
X3 Chart Pattern Scanner (Non Repainting + Non Lagging = Hybrid)
Below is the link to X3 Chart Pattern Scanner in MetaTrader 4 and MetaTrader 5 platform. X3 Chart Pattern Scanner is non repainting and non lagging Harmonic Pattern Indicator. In addition, each Harmonic Pattern in X3 Chart Pattern Scanner can be customized to improve trading performance. With tons of powerful features toward the day trading, this is the next generation Harmonic Pattern Indicator.
https://www.mql5.com/en/market/product/41993
https://www.mql5.com/en/market/product/41992
https://algotrading-investment.com/portfolio-item/profitable-pattern-scanner/
In addition, we will introduce two Harmonic Pattern Indicator including Harmonic Pattern Plus and Harmonic Pattern Scenario planner. These Harmonic Pattern Indicator is repainting. However, they provide tons of powerful features at affordable price. Hence, if you do not mind the repainting Harmonic Pattern Indicator, then you can use these two tools. In addition, you can use X3 Chart Pattern Scanner together with Harmonic Pattern Plus or Harmonic Pattern Scenario Planner.
Harmonic Pattern Plus (Type 1)
Harmonic pattern plus is extremely good product for the price. With dozens of powerful features including Pattern Completion Interval, Potential Reversal Zone, Potential Continuation Zone, Automatic Stop loss and take profit sizing.
Below are the Links to Harmonic Pattern Plus
https://www.mql5.com/en/market/product/4488
https://www.mql5.com/en/market/product/4475
https://algotrading-investment.com/portfolio-item/harmonic-pattern-plus/
Harmonic Pattern Scenario Planner (Type 1 + Predictive feature)
With additional features of predicting future harmonic patterns, this is very tactical harmonic pattern indicator with advanced simulation capability on top of the powerful features of harmonic pattern plus.
Below are the Links to Harmonic Pattern Scenario Planner
https://www.mql5.com/en/market/product/6101
https://www.mql5.com/en/market/product/6240
https://algotrading-investment.com/portfolio-item/harmonic-pattern-scenario-planner/

Young Ho Seo
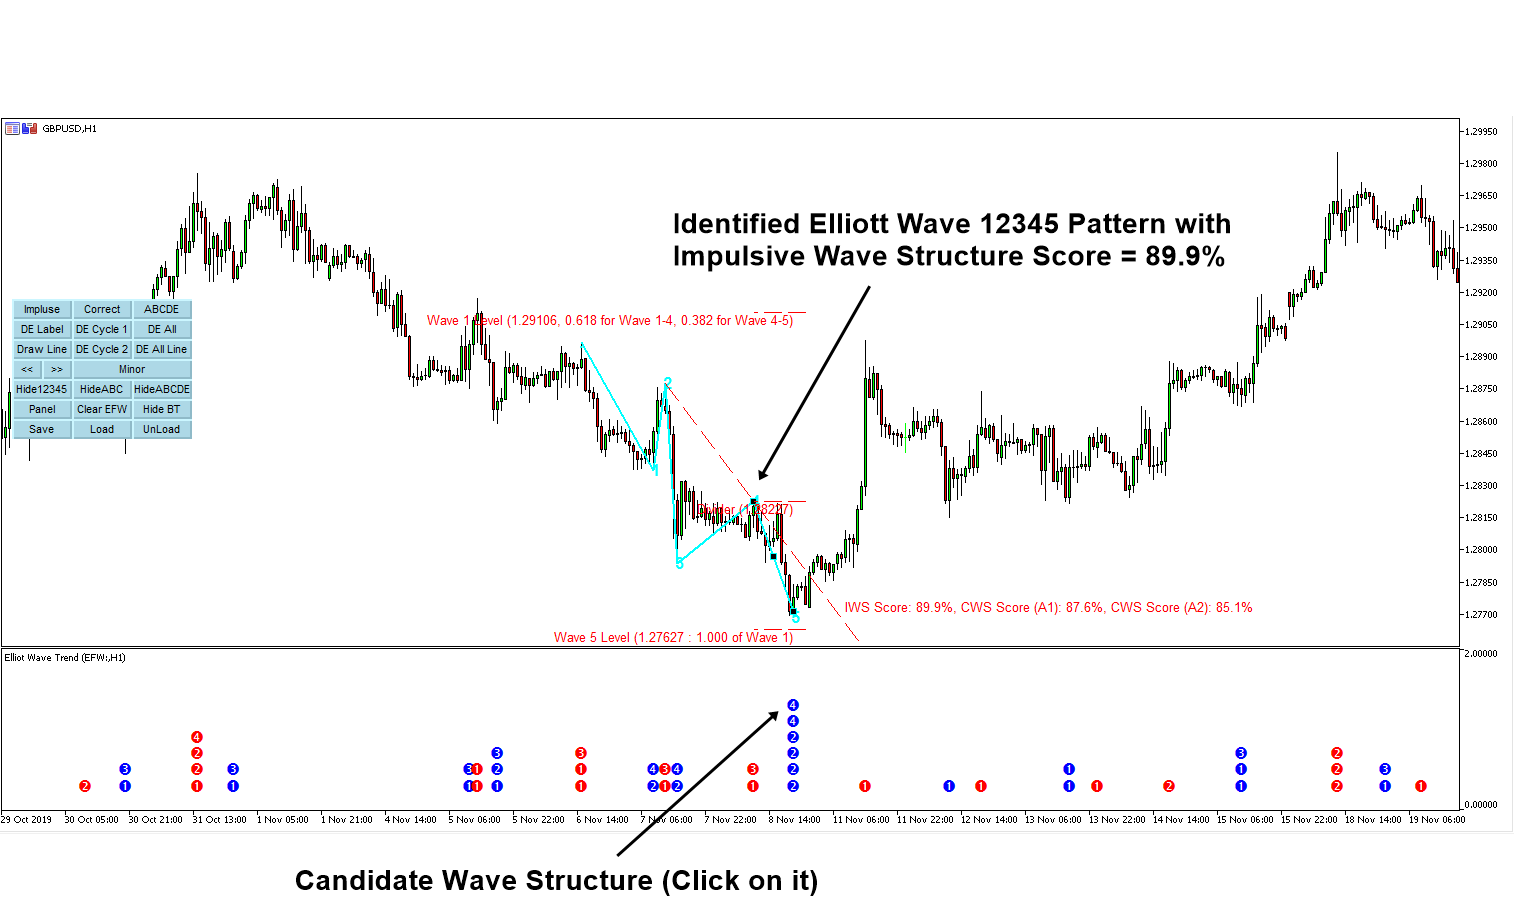
Elliott Wave Indicator Guide
Elliott Wave Trend is the Elliott Wave indicator designed to help Elliott Wave Analysis with objective Elliott Wave counting. We share some useful articles to understand the trading operation with Elliott Wave Trend. Elliott Wave Trend is a good tool to identify the Elliott Wave Pattern in your chart. To get rid of subjectivity in your Elliott Wave Analysis and to make your prediction more accurate, you can use the steps outlined here.
Build up the wave counting using the template pattern also known as the peak and trough analysis
Identify Impulse Wave first before identifying any Corrective wave
Use the Wave score to confirm either impulse wave, or corrective wave
Or, if the Wave score is not available, then you can check the correct location of each wave point to judge the valid trading point using Fibonacci ratio
Elliott Wave Trend is designed to perform these steps so that you can predict the market movement with less or no subjecitivity. In another words, this is good system if you are looking for high probabilty trading setup. With some knowledge of Elliott Wave analysis, this tool get rid of a lot of manual wave analysis to save your time and effort. However, you still need some understanding of impulse wave and corrective wave before using Elliott Wave Trend. To help you to understand Elliott Wave Trend, We introduce three articles.
In this article, we will provide some basic features available in Elliott Wave Trend. In addition, this article provide the really simple guide to Automatic Wave Analysis for Impulse and Corrective Waves.
https://algotrading-investment.com/2019/04/14/elliott-wave-trend-tutorial-1/
In this article, we provide the more detailed guide for automatic wave analysis for impulse and corrective waves. In addition, this article provide a demonstration of using automatic wave anlaysis so that you can improve your trading performance.
https://algotrading-investment.com/2018/10/25/how-elliott-wave-can-improve-your-trading-performance/
In this article, we provide some theoretical background behind Elliott Wave Analysis. In addition, the article explains the way to improve the accuracy of your market prediction with Elliott Wave Analysis.
https://algotrading-investment.com/2018/10/29/identifying-order-and-disorder-in-chaotic-market-with-elliott-wave/
Here is the links to Elliott Wave Trend available in MetaTrader 4 and MetaTrader 5:
https://www.mql5.com/en/market/product/16479
https://www.mql5.com/en/market/product/16472
https://algotrading-investment.com/portfolio-item/elliott-wave-trend/
YouTube Video about Elliott Wave Indicator
YouTube Link: https://www.youtube.com/watch?v=BpxhqQC5OZ0

Young Ho Seo
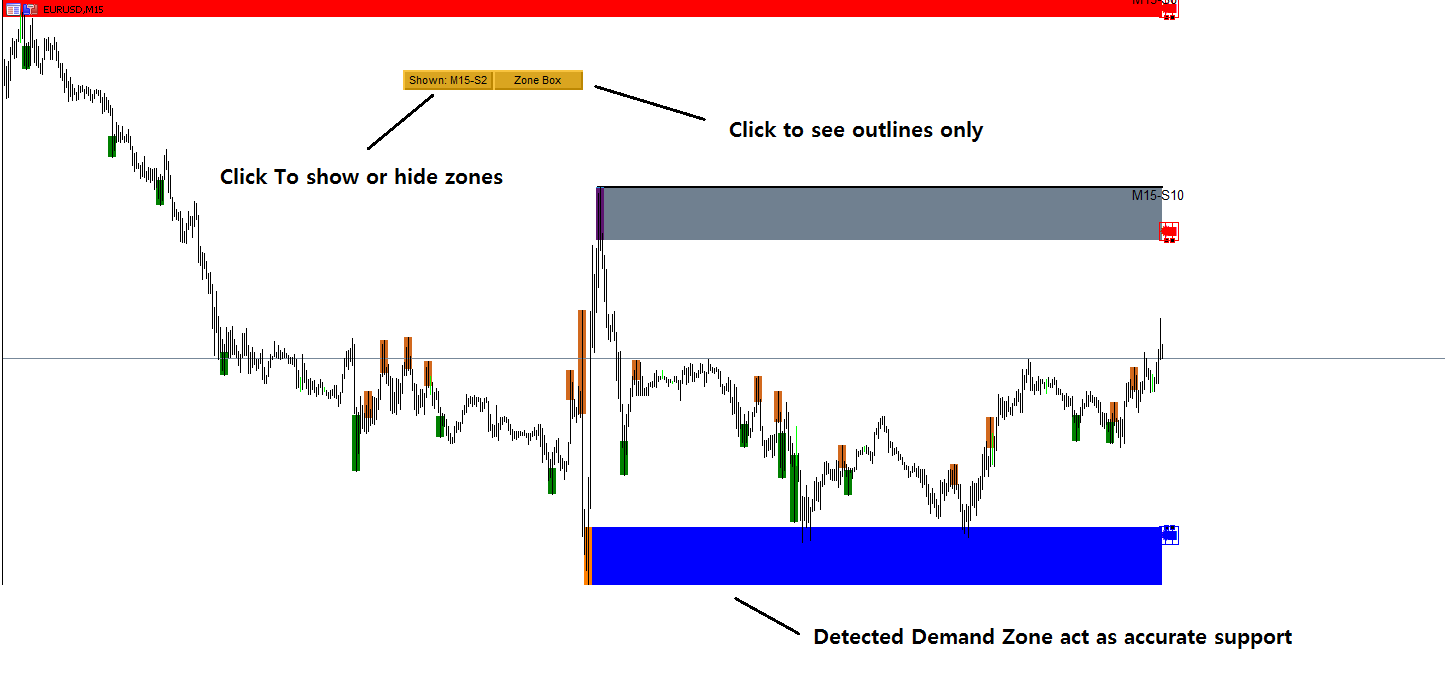
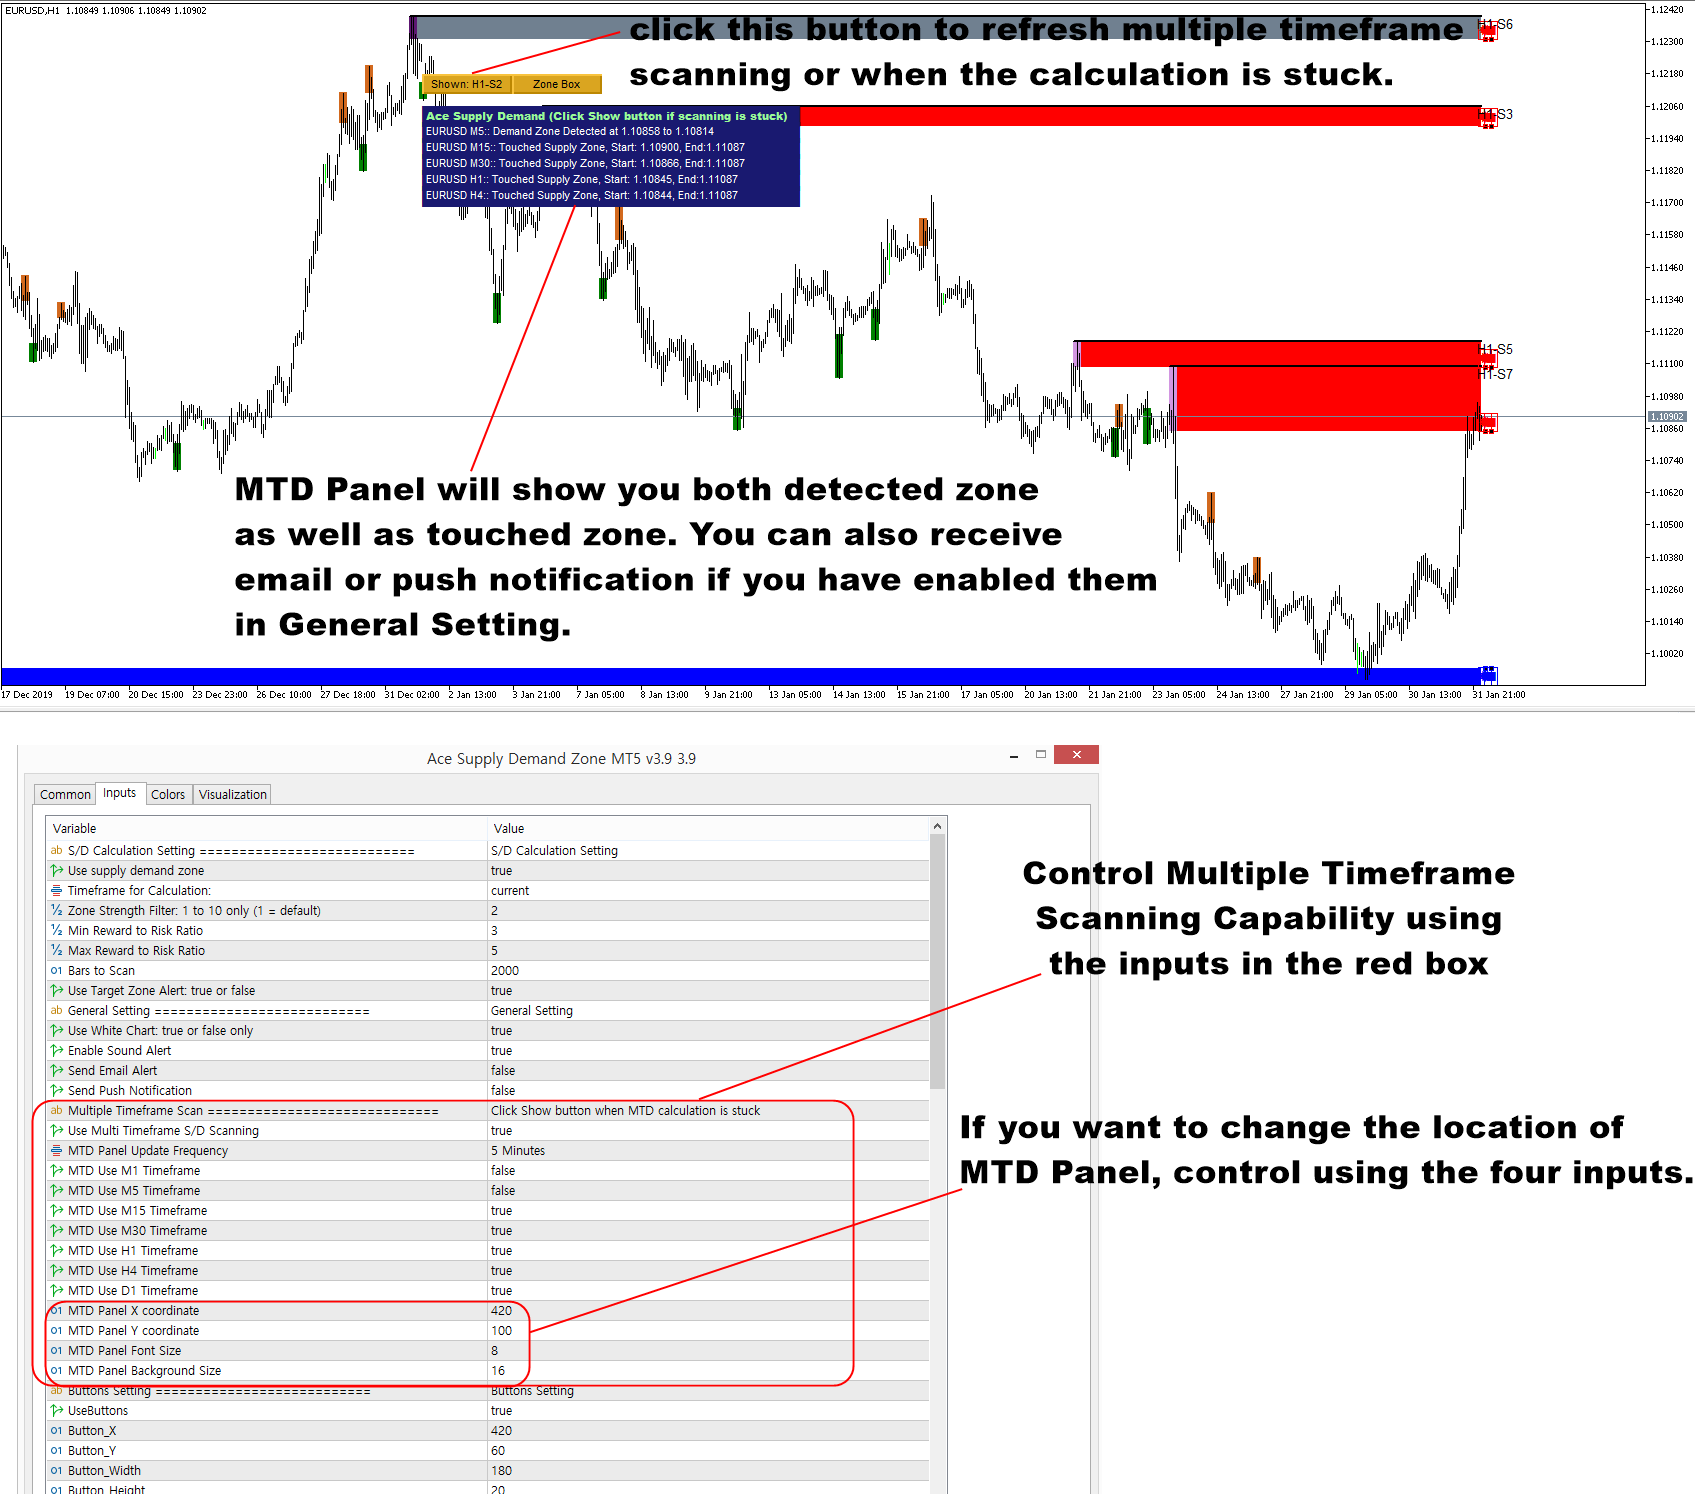
Simple Guide to Ace Supply Demand Zone
Ace Supply Demand Zone indicator is powerful supply and demand zone indicator. You can use it for original supply demand zone trading, or new angled supply demand zone trading. At the same time, you can use it as very accurate support and resistance drawer.
Because it is non repainting, any level of trader can get benefit from this superb indicator.
Here is simple button operations with Ace Supply Demand Zone.
You can show or hide zones from your chart using “Shown/Hidden” button click.
You can see outline only using “Zone Box” button click
Well, simple operation but powerful.
Below are the links to Ace Supply Demand Zone indicator for MetaTrader 4/MetaTrader 5.
https://www.mql5.com/en/market/product/40076
https://www.mql5.com/en/market/product/40075
https://algotrading-investment.com/portfolio-item/ace-supply-demand-zone/

Young Ho Seo
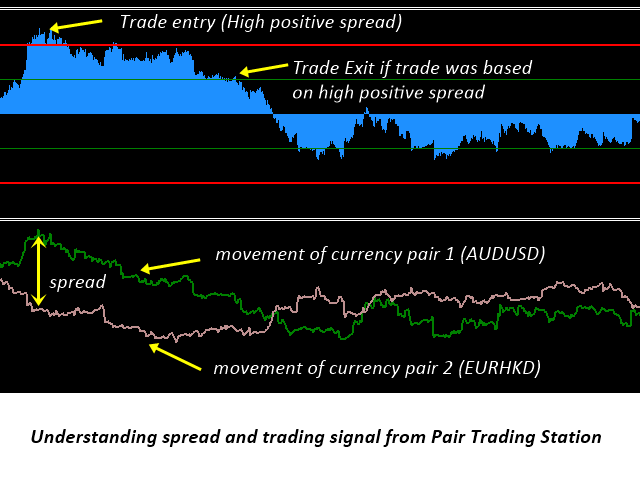
Manual For Pairs Trading Indicator
Pair Trading Station is a powerful Pairs Trading Indicator that uses the correlation and spread analysis. Pairs trading is also known as the statistical arbitrage as it involves buying undervalued asset and selling overvalued asset at the same time. Pair Trading in Forex can be best described as taking the hedge position of buying and selling two highly correlated instruments at the same time. However, pairs trading can be used to predict the turning point. For example, it is possible to only take one buy or sell position only. When you take one position, you can use the pair trading signal as the primary confirmation and then you can use other secondary confirmation techniques to accomplish your trading decision. On the other hands, you can use the pair trading signal as the secondary confirmation techniques and then you can use your other technical or fundamental analysis as the primary confirmation. One thing you have to note here is that your other techniques to be used together with our pair trading signal should be based on the mean reversion trading because pair trading is based on the mean reversion trading principle too.
You can have a look at this manual from the link. This manual was written for Pairs Trading Station. This manual focuses on taking the hedging position between buying and selling two highly correlated instruments. The manual includes how to use the basic features of Pairs Trading station like buttons and input settings. In addition, it also teach you how to interpret the spread for your trading. As we have mentioned before, once you can interpret the spread, then you can combine the spread analysis with other secondary confirmation techniques.
https://algotrading-investment.com/2015/11/14/introduction-to-pair-trading-station_ati/
In addition, you can watch this YouTube Video titled as How to use Pairs Trading Station
https://youtu.be/fAE9pByxZDA
Here is the landing page for Pairs Trading Station in MetaTrader 4 and MetaTrader5.
https://algotrading-investment.com/portfolio-item/pair-trading-station/
https://www.mql5.com/en/market/product/3303
https://www.mql5.com/en/market/product/3304

Young Ho Seo
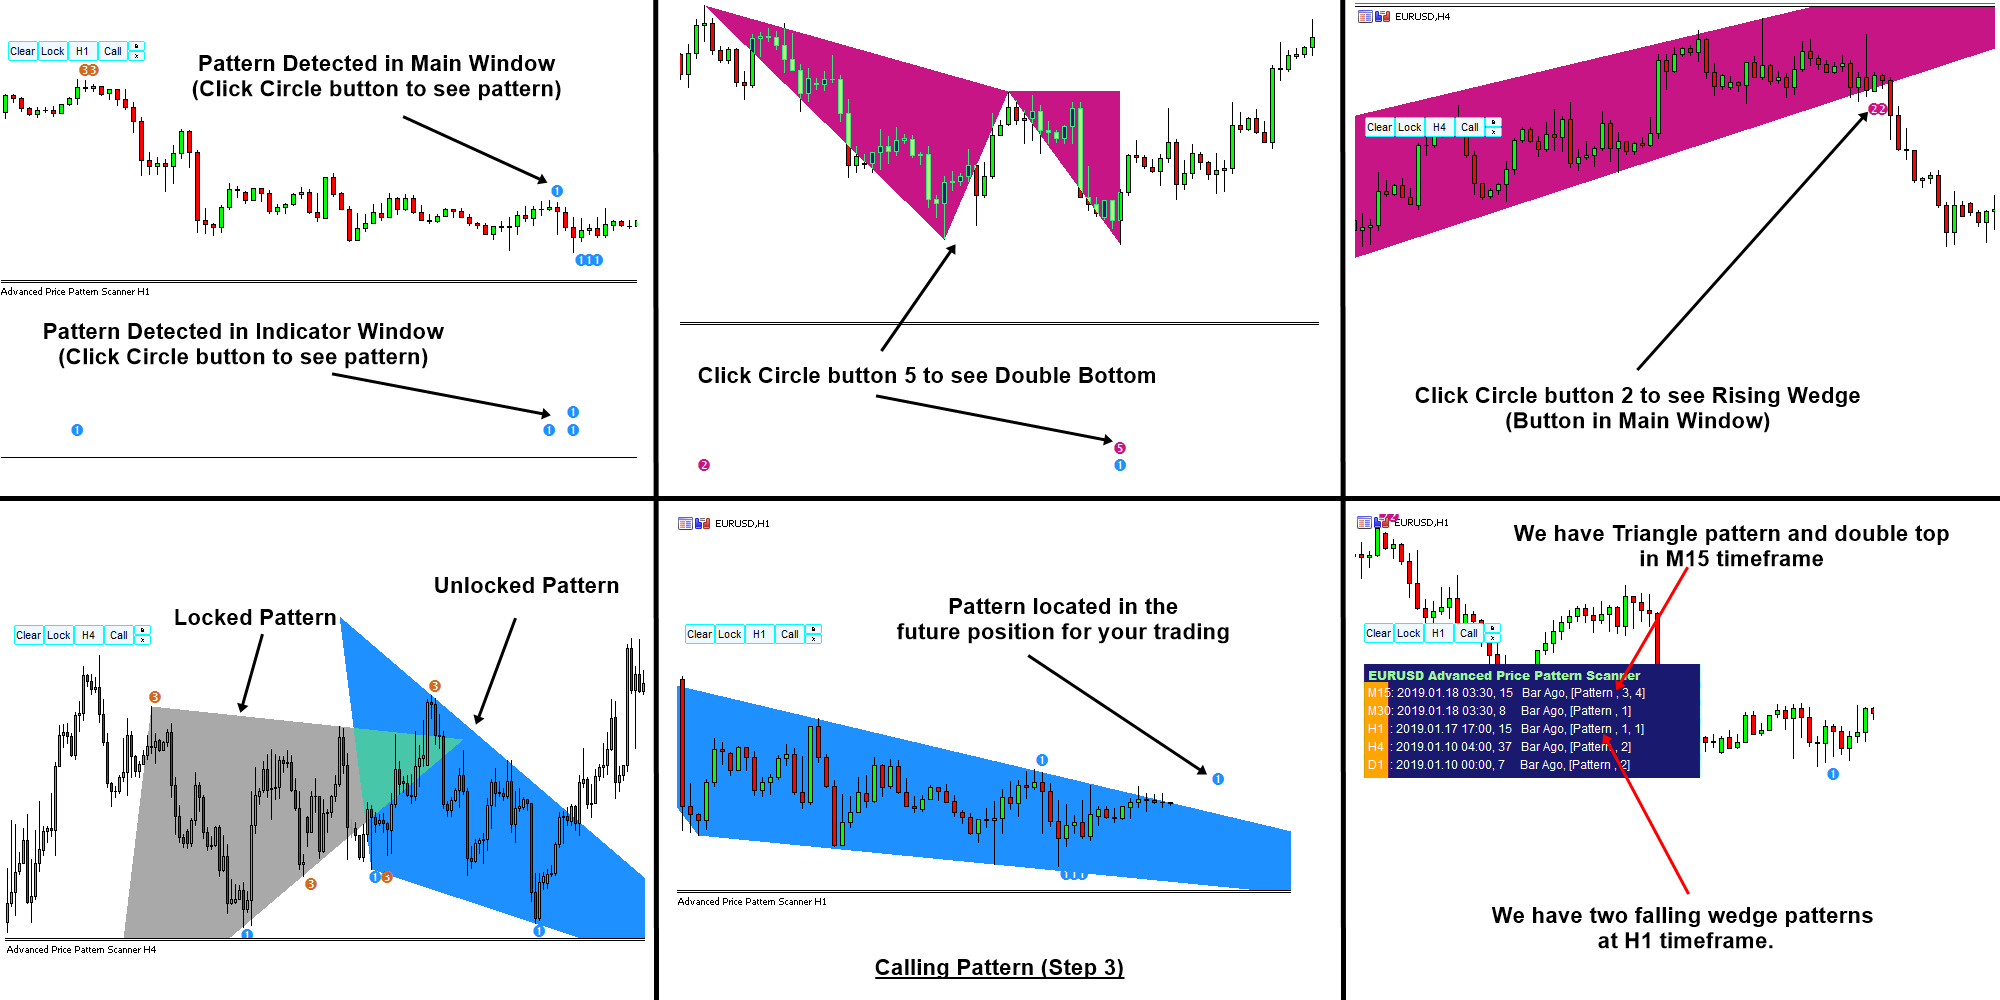
Introduction to Price Pattern Scanner
Price Pattern Scanner is the automatic pattern scanner that can detect the price pattern and chart pattern like triangle pattern, falling wedge pattern and rising wedge pattern and so on. Triangle, falling wedge, and rising wedge patterns occurs when the volatility of the market are gradually reduced. Normally, before some important news like Non-Farm Payroll or Unemployment Rate release, you can observe triangle, falling wedge, and rising wedge patterns frequently. Triangle, falling wedge, and rising wedge patterns are the sign of the high volatility in the future. At the same time, triangle, falling wedge, and rising wedge patterns indicates the increase in natural orders in the market. In another words, after triangle, falling wedge, and rising wedge pattern, we can observe some good trendy movement, which we can use for the potential entry.
Chart Pattern MT4 and Chart Pattern MT5 contains the highly sophisticated pattern detection algorithm. In addition, this price pattern scanner is non repainting pattern scanner. However, we have designed it in the easy to use and intuitive manner. Chart Pattern MT4 and Chart Pattern MT5 will show all the patterns in your chart in the most efficient format for your trading.
Detectable Price Patterns
Following pattern can be detected.
1) Triangle (Pattern Code = 0)
2) Falling Wedge (Pattern Code = 1)
3) Rising Wedge (Pattern Code = 2)
4) Double Top (Pattern Code = 3)
5) Double Bottom (Pattern Code = 4)
6) Head and Shoulder (Pattern Code = 5)
7) Reverse of Head and Shoulder (Pattern Code = 6)
8) Cup and Handle or Cup with Handle (Pattern Code = 7)
9) Reverse of Cup and Handle or Cup with Handle (Pattern Code = 8)
————————————————————————————-
Main Functionality
1) Pattern Detection in Indicator Window: Detected Patterns are located in the indicator window for your market analysis. To view or hide, just click the Circle button in the indicator window.
2) Pattern Detection in Main Window: Detected patterns are also located in the main window for your market analysis. To view or hide, just click the circle button in the main window.
3) Call Patterns: You can also call any patterns at the desired location in your chart. To access Call Pattern feature, click call button. Now you will have pointer in your chart. Move the pointer anywhere in your chart to located patterns, then click “Call” button again. You will see patterns corresponding to the location of pointer.
4) Multiple Timeframe Pattern Detection: You can also scan above patterns across different timeframe from one indicator. You can also switch on and off any specific timeframe per your need. Please note that Multiple Timeframe Pattern Detection requires much heavier computation.
5) Pattern Locking: You can also lock any patterns in your chart for your future use. Just click over Lock button to lock patterns in your chart.
———————————————————————————————–
Here is a Simple Video Tutorial for Chart Pattern MT4 and Chart Pattern MT5.
YouTube: https://www.youtube.com/watch?v=A1-IUr6u5Tg
Below are the links to Chart Pattern MT4 and Chart Pattern MT5.
https://algotrading-investment.com/portfolio-item/chart-pattern/
https://www.mql5.com/en/market/product/84567
https://www.mql5.com/en/market/product/84568
You can also use this product together with Peak Trough Analysis tool to yield better profit. Peak Trough Analysis is free tool for everyone. Below is how to download this free peak trough analysis indicator.
https://algotrading-investment.com/2019/08/29/how-to-download-peak-trough-analysis-tool/
YouTube Video about Triangle Pattern, Falling Wedge, Rising Wedge Pattern
YouTube Link: https://youtu.be/exefn_QM7ik

Young Ho Seo
Trading Tips for Newbie in Forex and Stock Market
In this article, we cover some trading tips for newbie staring Forex and Stock market. We will use the Q & A approach to share the useful information for newbie. Below the questions and answers will explain the key elements of successful trading in Forex and Stock market.
What is trading in Forex and Stock Market ?
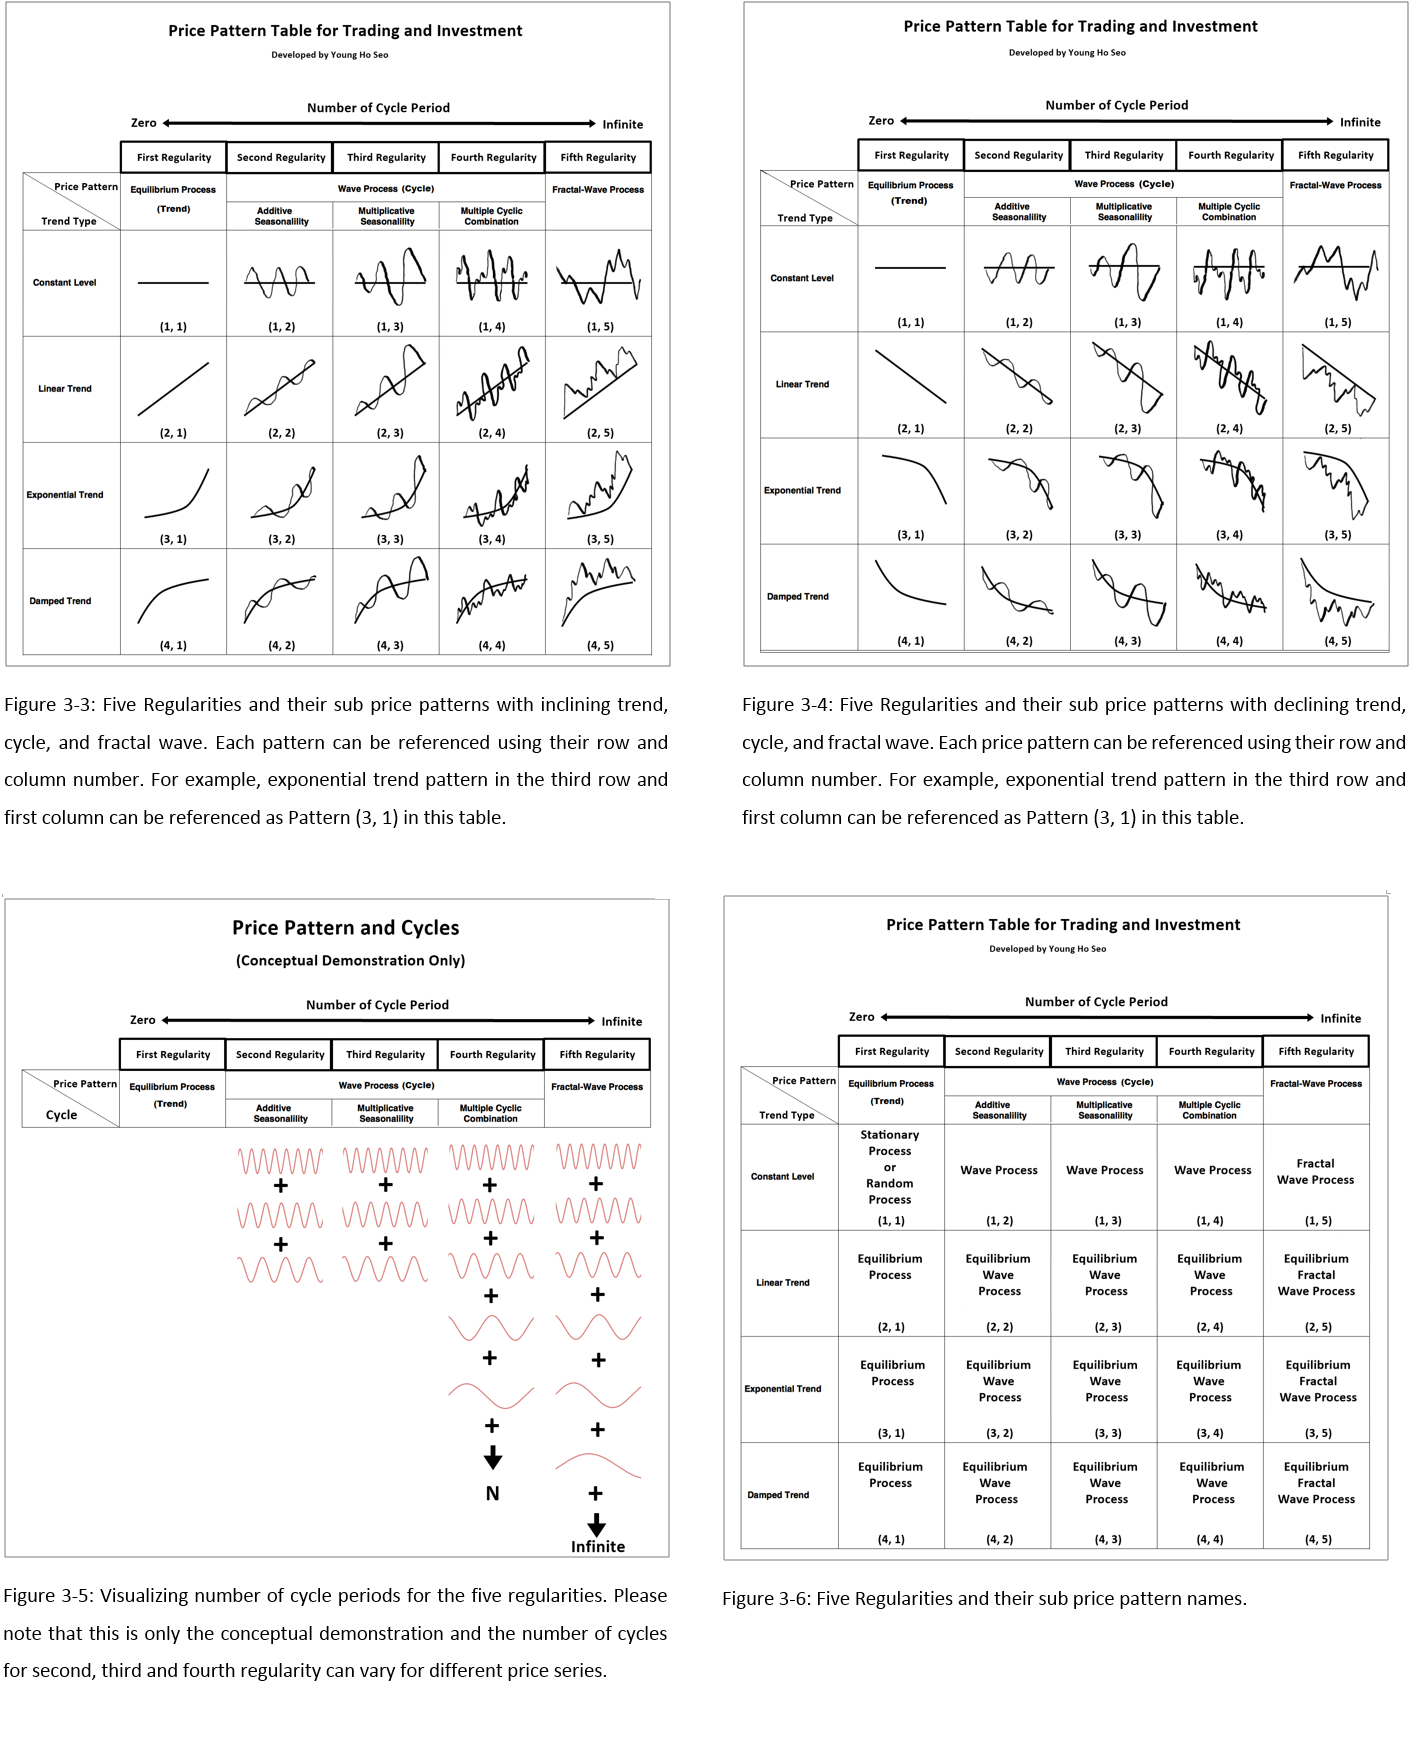
Trading is a profit seeking operation with buying and selling the financial asset like a currency, stock or cryptocurrency. Profit seeking in long run is often based on materializing the regularities in the financial market. If anyone made money from the market in long run, this means that the market was not random, at least to them. In another words, you have found some sort of regularities in the market. Some people call these regularities as correlation, pattern, trend, wave, volatility, holes in the financial market, or many other names. But they are all regularities regardless of how you call them. Even you are doing some sort of arbitrage trading, you are still making use of some regularities that are known to few people. For example, in this case, you have found a pattern that some place selling the finanical asset cheaper than the other place or the other way around. Typically, this sort of arbritage information in financial market can be found using positive or negative correlation between two brokers or two exchange.
What are the regularities you should know for live trading ?
There are regularities from simple to complex in the financial market. To make your life simple, I have gathered five most occurring and most important regularities for trader in the price pattern table. They are Trend, Seasonality, Cycles, Fractal Wave and Correlation. Typically each trading strategy around Forex and Stock trading is designed to capture one of these five regularities. The best way to understand these regularities is to visualize the market using the chart. Typically, the candlstick chart is used mostly in Forex and Stock trading. When we use the candlestick chart, we can see these regularities in the chart. We can make a buy or sell decision based on our understanding of the market.
How to capture these regularities for profit ?
To visualize the market and to understand the regularities in the market, it is important to understand your tools. Depending on the tools, you may or may not able to identify the specific regularties existing in the market. If the market consists of a simple regularty, then you may not need any tool. However, this is very unlikely in the modern financial market. In addition, you need to understand why a particular tool is designed. Any tools used in the financial market has some assumption around the tool. When the assumption of the tool does not fit for the market, the tool can fail. Before blindly applying any technical indicator like MACD, CCI, RSI, etc, you need to ask how these tools are constructed and what the purpose of these tools are. This is the most important question for the successful trading. For example, the price action, price pattern and chart pattern are the direct price analysis. The main assumption of the direct price analysis is based on the endless zig zag movement of the price, also known as the fractal wave.
Read entire article about Trading Tips for Newbie from the link below.
https://algotrading-investment.com/2019/05/06/trading-tips-for-newbie-in-forex-and-stock-market/
Any further tips on improving profit ?
Trade with deep decision making instead of superficial decision making. It is the quality matter and not quantity. It is useless that you trade fast reckless. Many number of trade will not guarantee your success. Even for one trade, put the quality piece of information technically (from chart) and fundamentally (from surrounding market environment) together.
If you are looking for the tools for the direct price analysis like the price action, price pattern and chart pattern, then visit our website. Our website provides the best tools geared up for the price action, price pattern and chart pattern. Our products include the technical indicator, expert adviser, inter-market analysis tools and pattern scanner making the best use of Support, Resistance, Fibonacci Analysis, Harmonic Pattern, Elliott Wave, Supply Demand Analysis, Volume Spread Analysis and Market Volatility. MetaTrader product range includes the Harmonic Pattern Indicator, Elliott Wave Indicator, Momentum Indicator, Volume Spread Analysis, Support Resistance Indicator, Supply Demand Indicator, Pairs Trading Indicator, Renko Chart Indicator, Volitility Indicator and Expert Advisors.
https://www.mql5.com/en/users/financeengineer/seller#products
https://algotrading-investment.com/

Young Ho Seo
Mean Reversion Supply Demand Analysis
Mean reversion is a science to explain the turning point in Forex and Stock market. Mean reversion also provides a great explanation behind the Supply Demand Analysis. This article provides some guide for mean reversion supply demand indicator. Mean Reversion Supply Demand is an excellent tool to trade the supply and demand zone in Forex and Stock market. You can use the tool with multiple timeframe analysis. In addition, it can detect the trading zone where you can set stop loss and take profit target at most efficient price. Simply speaking, any support and resistance trader can use this Mean Reversion Supply Demand Indicator. Even any chart pattern or price pattern trader can use this Mean Reversion Supply Demand Indicator.
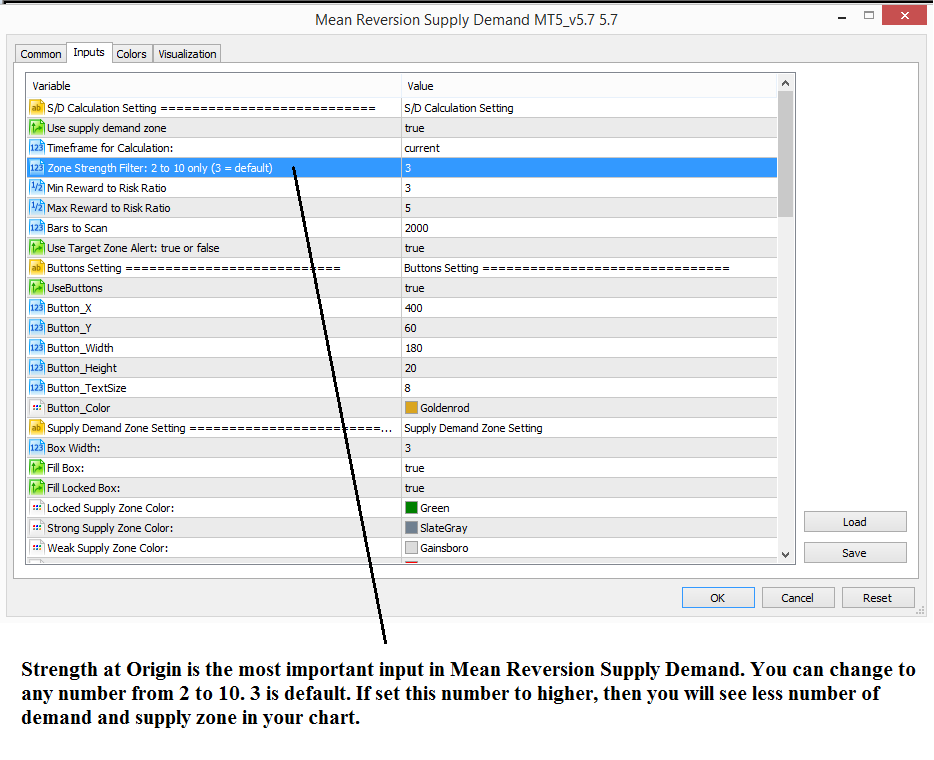
Mean Reversion Supply Demand indicator has “Strength at Origin” input. This input is the same and corresponding input described by Sam Seiden. You can consider the Strenth at Origin as the speed of the price movement. Therefore, “Strength at Origin” input can be range from 2 to 10. Higher the number you choose, you will filter out the less obvious supply and demand pattern. However, with higher number of Strength at origin, you will see less number of supply demand zone to trade as you are applying more strict filter. This means that you will see less number of supply and demand trading zone when you use Strength at Origin = 8 comparing to Strength at Origin = 3.
If you are new to the supply demand analysis, then it might good to choose the Strengh at Origin to 5 or more. However, if you are using any secondary confiramtion, then you can use the Strengh at Origin 2 or 3. Of course, if you know what you are doing, then you can always choose any Strength at Origin as you wish.
Below is some other guidelines for Mean Reversion Supply Demand. Please read this guides for your own goods:
https://algotradinginvestment.wordpress.com/2017/03/13/simple-instruction-of-mean-reversion-supply-demand/
https://algotradinginvestment.wordpress.com/2017/12/23/mean-reversion-supply-demand-shown-hidden-timeframe-button/
https://algotradinginvestment.wordpress.com/2018/01/25/mean-reversion-supply-demand-multiple-timeframe-analysis/
Here are link to Mean Reversion Supply Demand:
https://www.mql5.com/en/market/product/16851
https://www.mql5.com/en/market/product/16823
https://algotrading-investment.com/portfolio-item/mean-reversion-supply-demand/

Young Ho Seo
Smart Renko Chart
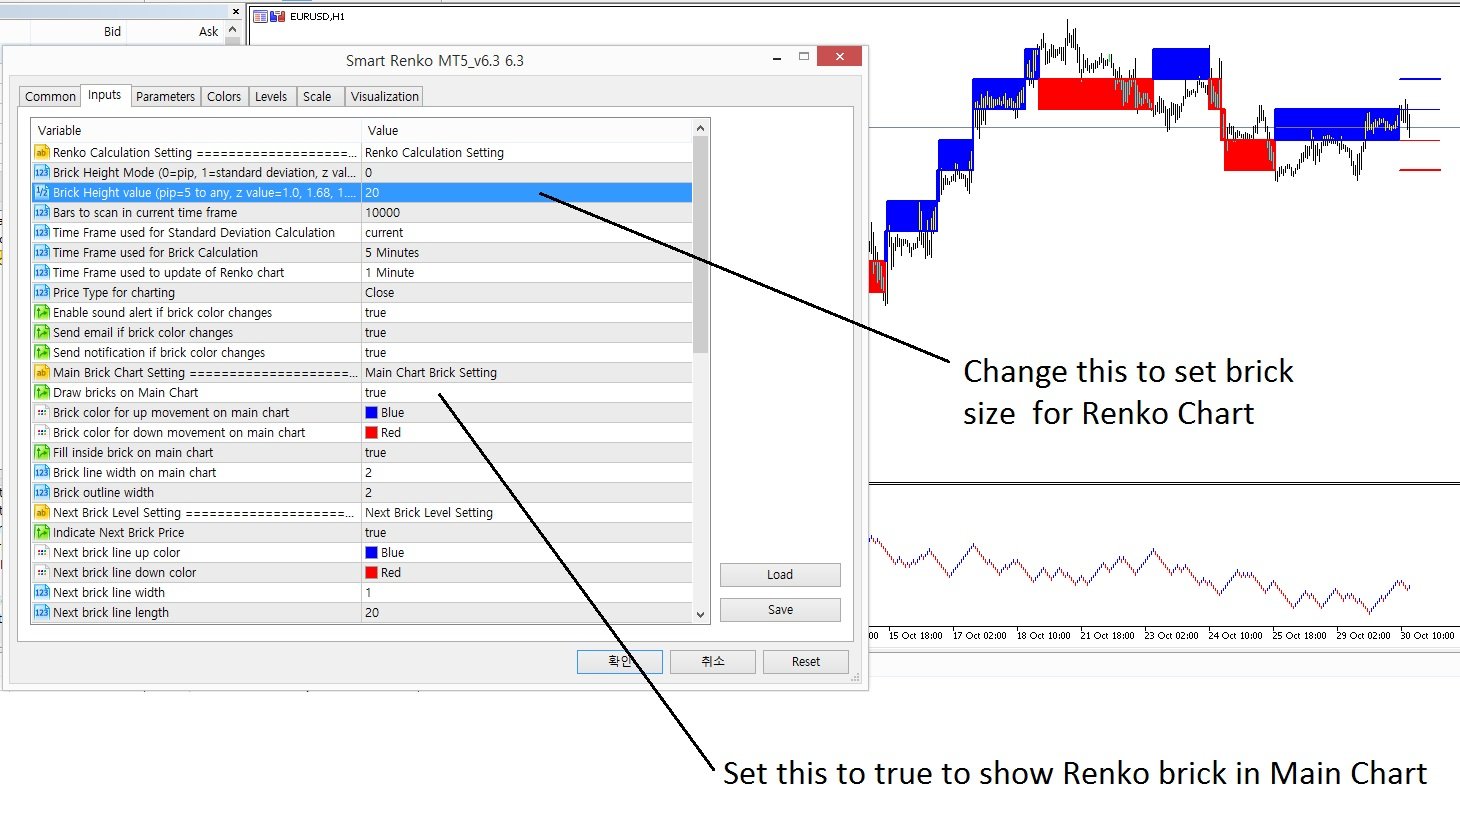
Renko chart is a popular tool to trade with the price action in Forex and Stock market. Renko Chart is the visualization technique, which does not use the fixed time interval but it uses the fixed price height. It is useful tool to recognize price action, price pattern and chart pattern from Forex and Stock chart. We created a powerful tool called Smart Renko for Price Action Trader. Here we will explain how to use Smart Renko Chart in brief. Smart Renko is a hybrid tool between renko chart and candlestick chart. Smart Renko provides the spread view of the renko bricks on the candle stick chart and then it also keeps the normal renko chart on the bottom. The advantage of Smart Renko is that you can use the analysis of renko chart together with the analysis of candlestick chart at the same time. You can get the best out of the both world.
The important point before using any Renko chart is about the brick height. This also appies to the Smart Renko Chart too. Just like normal renko chart, Smart Renko chart need to decide the good number for brick height. From my experience, you can the brick height near the 1 standard deviation. However, you must use the brick height in the round number because standard deviation might come in decimal numbers. So be sure to round up those decimal numbers into good integer numbers.
Another consideration is that your brick height should be in the factor of 10, 100 or 1000 pips for your trading. That means that using 5, 10, 20, 25, 50, 100, or 1000 brick height is the most effective price height for your trading. From my experience, these factored number can serve better for your brick height. If you do not choose sensible brick height, then you might not able to see anything on your charts. So be sure to choose the sensible brick height.
Finally do not forget that in Smart Renko, your analysis in Renko chart can be transferred to Main chart by double clicking over the Trend lines.
If you want to dig deeper, please google on renko chart. You will see a lot of articles about Renko charts and how to trade with them.
https://www.mql5.com/en/market/product/9911
https://www.mql5.com/en/market/product/9944
https://algotrading-investment.com/portfolio-item/smart-renko/
In addition, some feature of Smart Renko is built inside the Price Breakout Pattern Scanner. Hence, you can use the automated Pattern Scanner together with Smart Renko Chart inside the Price Breakout Pattern Scanner. Price Breakout Pattener cotains two tools in one techncial indicator. In addition, Price Breakout Pattern Scanner provides the 52 Japanese candlestick patterns to assit your trading decision. Here are the links for the Price Breakout Pattern Scanner.
https://www.mql5.com/en/market/product/4859
https://www.mql5.com/en/market/product/4858
https://algotrading-investment.com/portfolio-item/price-breakout-pattern-scanner/
YouTube Video about Smart Renko Chart
YouTube Link: https://youtu.be/EMAxFHbNziM

: