• Overview
  • Reviews
  • Comments (3)
  • What's new

Swing daily


A pivot point is an intraday technical indicator used to identify trends and reversals mainly in equities, commodities, and forex markets. Pivot points are calculated to determine levels in which the sentiment of the market could change from bullish to bearish, and vice-versa.


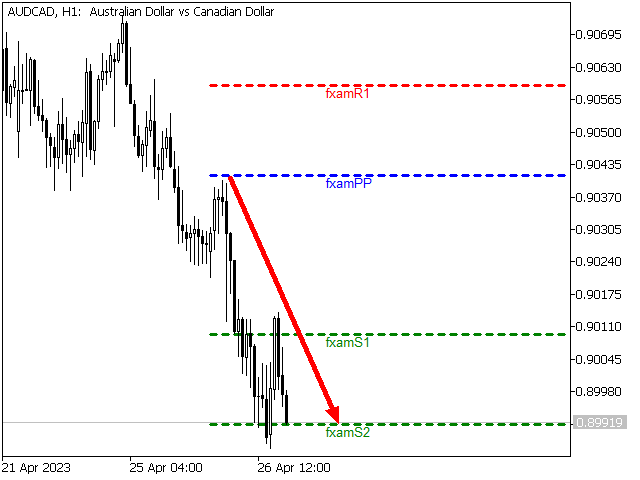
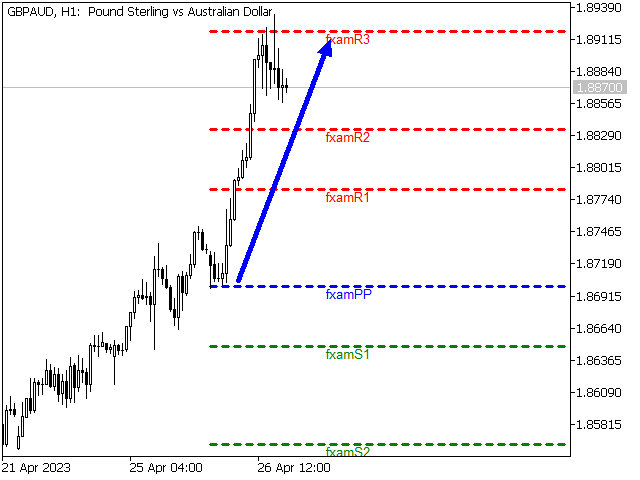
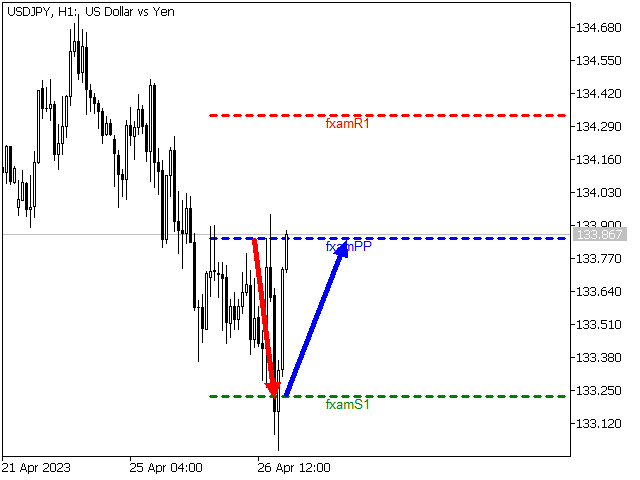
the swing daily is an advanced pivot points indicator that grants the user control over many aspects of the trading levels that you'll get familiar with in the controls section 

it's used mainly to locate intraday trading levels to make sense of intraday time frames price action

it would be perfet yo use with our (swing trend) indicator for better results

the controls are :

pivot selection (standard , Fibonacci , camarilla , Woodie) to choose a a pivot selection method

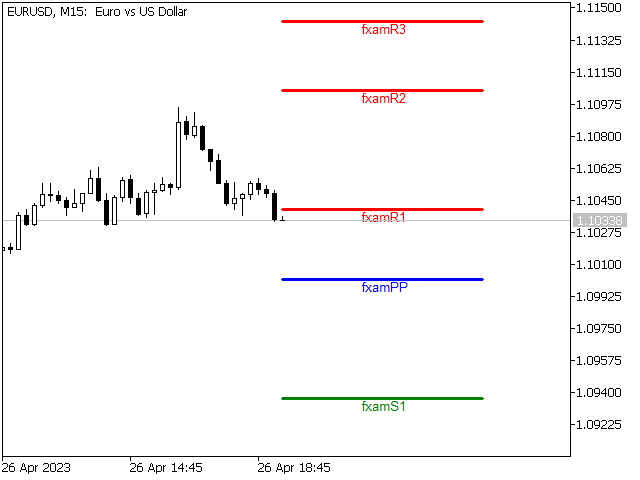
draw floor mid pp (yes or no) to choose multiple pivots with S&R

show price label (yes or no ) to show prices on levels or not

choose time frame ( 1 min - 1 month ) my personal recommendation is 1D 

the  header contains the link to our telegram channel just copy and paste in telegram

costume message to write something on the pivot lines

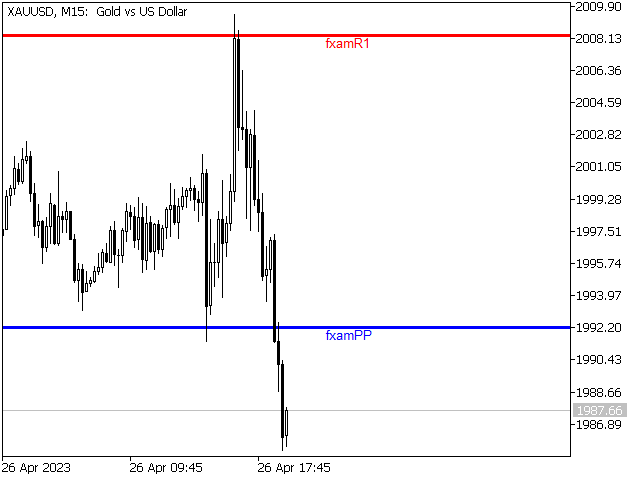
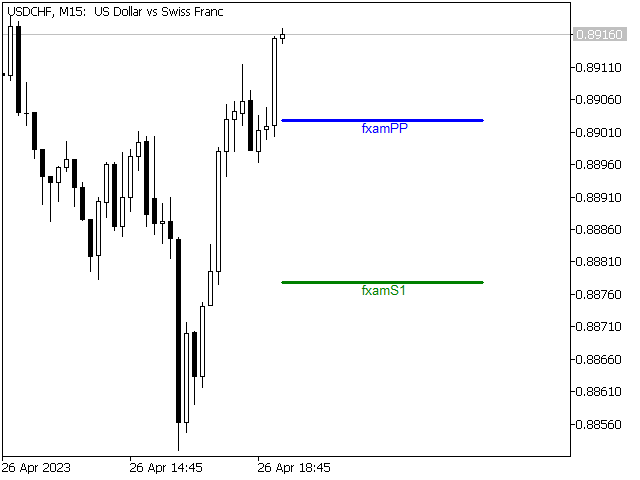
use short line (yes or no) to make the pivots take the whole chart or not

line style (dot ; dash ; solid)

line width

font 

label font size

shift label

color scheme of (pp ; S1 ; S2 ; S3 ; S4 ; R1 ; R2 ; R3 ; R4)

I WISH YOU ALL THE BEST

Recommended products
Pivot Points MT5 is a universal color multicurrency/multisymbol indicator of the Pivot Points levels systems. You can select one of its three versions: Standard Old, Standard New and Fibo . It plots pivot levels for financial instruments in a separate window . The system will automatically calculate the Pivot Point on the basis of market data for the previous day ( PERIOD_D1 ) and the system of support and resistance levels, three in each. A user can choose colors for the indicator lines. The on
KT Auto Trendline MT5
KEENBASE SOFTWARE SOLUTIONS
KT Auto Trendline draws the upper and lower trendlines automatically using the last two significant swing highs/lows. Trendline anchor points are found by plotting the ZigZag over X number of bars. Features No guesswork requires. It instantly draws the notable trendlines without any uncertainty. Each trendline is extended with its corresponding rays, which helps determine the area of breakout/reversal. It can draw two separate upper and lower trendlines simultaneously. It works on all timefr
Key level wedge MT5
Presley Annais Tatenda Meck
The   Key level wedge MT5   indicator automatically draws rising wedge pattern and falling wedge pattern for you on the chart. This pattern is really good when used as a confirmation entry at key support & resistance, supply & demand and reversal zones. Advantages  The   Key level wedge MT5   block DOES NOT RE-PAINT, giving you confidence when a signal appears and also helps when looking back.  The   Key level wedge MT5   includes an on/off button on the chart to easily keep the charts cle
The indicator automatically calculates and plots Fibonacci support and resistance levels - one of the most effective tools for market analysis. The calculation uses the averaged price data for the selected period and timeframe. The minimum and maximum for this period are taken as the beginning and end of the movement. Fibonacci levels allow you to see potential reference points, around which the price movement can slow down or reverse, that is, they are used to predict further movement, as well
The PUA MultiType Pivot indicator is built on the daily chart of the previous day. The PUA MultiType Pivot indicator is one of the most popular tools in technical analysis, used by traders to identify potential reversal points in financial markets. This indicator constructs three types of Pivot points: Classic, Fibonacci, and Camarilla, each offering its unique approach to market analysis. The advantages of this indicator include: Simplicity and Clarity PUA MultiType Pivot provides clearly defi
Mine Farm
Maryna Kauzova
5 (1)
Mine Farm is one of the most classic and time-tested scalping strategies based on the breakdown of strong price levels. Mine Farm is the author's modification of the system for determining entry and exit points into the market... Mine Farm - is the combination of great potential with reliability and safety. Why Mine Farm?! - each order has a short dynamic Stop Loss - the advisor does not use any risky methods (averaging, martingale, grid, locking, etc.) - the advisor tries to get
Welcome to the Ultimate Harmonic Patterns recognition indicator that is focused to detect advanced patterns. The Gartley pattern, Bat pattern, and Cypher pattern  are popular technical analysis tools used by traders to identify potential reversal points in the market. Our Ultimate Harmonic Patterns recognition Indicator is a powerful tool that uses advanced algorithms to scan the markets and identify these patterns in real-time. With our Ultimate Harmonic Patterns recognition Indicator, you
FFx Pivot SR Suite Pro MT5
Eric Venturi-Bloxs
4.67 (3)
MetaTrader 4 version available here: https://www.mql5.com/en/market/product/25793 FFx Pivot SR Suite PRO is a complete suite for support and resistance levels. Support and Resistance are the most used levels in all kinds of trading. Can be used to find reversal trend, to set targets and stop, etc. The indicator is fully flexible directly from the chart 4 periods to choose for the calculation: 4Hours, Daily, Weekly and Monthly 4 formulas to choose for the calculation: Classic, Camarilla, Fibona
Custom Pivots MT5
Tsvetan Tsvetanov
5 (1)
Pivots Points are significant levels traders can use to determine directional movement, support and resistance. Pivot Points use the prior period's high, low and close to formulate future support and resistance. In this regard, Pivot Points are predictive and leading indicators. Pivot Points were originally used by floor traders to set key levels. Floor traders are the original day traders. They deal in a very fast moving environment with a short-term focus. At the beginning of the trading day,
The best time to trade Using this Indicator is when the time reach exactly hour,half,45 minutes,15 minutes and sometimes 5 minutes.. This indicators is helpful to those who trade boom and crash indecies.How to read this indicator first you'll see Blue allow and Red allow all these allows used to indicate or to detect the spike which will happen so the allow happens soon before the spike happen.This indicator works properly only in boom and crash trading thing which you have to consider when
BTFX Pivot Points
Bradley Thomas Farrington
The BTFX Pivot Points is an indicator which calculates the Support and Resistance levels for each day. By using this indicator the pivot levels point out clear targets to aim for. The resistance levels are shown in purple above the silver pivot line. The support levels are shown in Orange and can be found below the silver pivot line. This indicators works very well when used with The BTFX Daybreak Indicator. For a more in depth explanation of these indicators please watch the Youtube video attac
This is a multi-timeframe indicator that detects and displays support and resistance (S&R) lines using the ZigZag indicator. Features The support and resistance lines are not redrawing. The indicator is capable of adding new support and resistance levels as they appear. Each S&R line has a tooltip that displays the price level and start time. Shows the start time, price level and number of touches of all S&R lines when pressing the shortcut Shift+I Save time for multi-timeframe analysis on
Premium level is a unique indicator with more than 80% accuracy of correct predictions! This indicator has been tested for more than two months by the best Trading Specialists! The author's indicator you will not find anywhere else! From the screenshots you can see for yourself the accuracy of this tool! 1 is great for trading binary options with an expiration time of 1 candle. 2 works on all currency pairs, stocks, commodities, cryptocurrencies Instructions: As soon as the red ar
Automatic fibonacci with alerts is an indicator that automatically plots a fibonacci retracement based on the number of bars you select on the BarsToScan setting in the indicator. The fibonacci is automatically updated in real time as new highest and lowest values appear amongst the selected bars. You can select which level values to be displayed in the indicator settings. You can also select the color of the levels thus enabling the trader to be able to attach the indicator several times with d
KT Horizontal Lines MT5
KEENBASE SOFTWARE SOLUTIONS
In MetaTrader, plotting multiple   horizontal lines   and then tracking their respective price levels can be a hassle. This indicator automatically plots multiple horizontal lines at equal intervals for setting price alerts, plotting support and resistance levels, and other manual purposes. This indicator is suitable for Forex traders who are new and looking for chances to make quick profits from buying and selling. Horizontal lines can help traders find possible areas to start trading when the
Noize Absorption Index - is the manual trading system that measures the difference of pressure between bears forces and bulls forces. Green line - is a noize free index that showing curent situation. Zero value of index shows totally choppy/flat market.Values above zero level shows how powerfull bullish wave is and values below zero measures bearish forces.Up arrow appears on bearish market when it's ready to reverse, dn arrow appears on weak bullish market, as a result of reverse expectation.
VWAP Bands
Rafael Caetano Pinto
This indicator uses VWAP and projects this VWAP into up to 3 levels, shifted by a percentage of the chart's symbol. How to configure: Choose the symbol and desired graphic time Set the start time of the symbol (in bovespa, WIN and WDO start at 9 o'clock). This time is used as the cutoff reference for VWAP. Check which VWAP period fits the chart better: Ideally, a period when VWAP is not too distant from the chart Set percentage levels: Ideally, you should set levels based on history, so that l
Auto Fib Retracements
Ross Adam Langlands Nelson
4.33 (6)
Automatic Fibonacci Retracement Line Indicator. This indicator takes the current trend and if possible draws Fibonacci retracement lines from the swing until the current price. The Fibonacci levels used are: 0%, 23.6%, 38.2%, 50%, 61.8%, 76.4%, 100%. This indicator works for all charts over all timeframes. The Fibonacci levels are also recorded in buffers for use by other trading bots. Any comments, concerns or additional feature requirements are welcome and will be addressed promptly. 
FREE
Your Trend Friend
Luigi Nunes Labigalini
The trend is your friend! Look at the color of the indicator and trade on that direction. It does not  repaint. After each candle is closed, that's the color of the trend. You can focus on shorter faster trends or major trends, just test what's most suitable for the symbol and timeframe you trade. Simply change the "Length" parameter and the indicator will automatically adapt. You can also change the color, thickness and style of the lines. Download and give it a try! There are big movements
Awesome Oscillator by Bill Williams with the ability to fine-tune and replace the averaging algorithms of the indicator, which significantly expands the possibilities of using this oscillator in algorithmic trading and brings it closer in its properties to such an indicator as the MACD. To reduce price noise, the final indicator is processed with an additional Smooth averaging. The indicator has the ability to give alerts, send mail messages and push signals when the direction of movement of th
MQL5 "Daily resistance and support" indicator - draws daily support and resistance lines. Drawing is carried out only with the help of graphical objects (trend lines) - indicator buffers are not used in this indicator. The indicator has no settings - the search for levels is carried out on the last 500 bars from the "D1" timeframe and this parameter is hardwired inside the code. Manual trading: When trading manually, this indicator is recommended to be used on timeframes from "M10" to "H1". It
This is an MTF indicator of support and resistance levels based on Advanced ZigZag Dynamic and/or Extended Fractals indicator extremums with price labels (can be disabled). More higher TFs can be selected for MTF mode. By default, the levels are generated based on ZigZag indicator dots. Fractals indicator dots can also be used together with ZigZag or instead of it. In order to simplify the use and save CPU time, calculation is performed once per each bar at its opening. Parameters: ForcedTF - ch
Daily Pivots Multi Indicator Daily Pivots Multi is an exclusive indicator to draw your pivots levels and much more. Most indicators draw daily pivots for the day. Daily Pivots Multi is able to draw levels for different days. The indicator can do the calculation for unlimited number of days backward. It means that you can draw the levels for today but also for the past days. This is very useful if you want to study a strategy with Pivots levels over a period of time. Another problem is th
An indicator of pattern #31 ("Long Island") from Encyclopedia of Chart Patterns by Thomas N. Bulkowski. The second gap is in the opposite direction. Parameters: Alerts - show alert when an arrow appears   Push - send a push notification when an arrow appears (requires configuration in the terminal) GapSize - minimum gap size in points ArrowType - a symbol from 1 to 17 ArrowVShift - vertical shift of arrows in points   ShowLevels - show levels ColUp - color of an upward line ColDn - color of a
Created by imjesstwoone and mickey1984, this trade model attempts to capture the expansion from the 10:00-14:00 EST 4h candle using just 3 simple steps. All of the information presented in this description has been outlined by its creators, all I did was translate it to MQL5. All core settings of the trade model may be edited so that users can test several variations, however this description will cover its default, intended behavior using NQ 5m as an example. Step 1 is to identify our Price Ra
Free automatic Fibonacci is an indicator that automatically plots a Fibonacci retracement based on the number of bars you select on the BarsToScan setting in the indicator. The Fibonacci is automatically updated in real time as new highest and lowest values appears amongst the selected bars. You can select which level values to be displayed in the indicator settings. You can also select the color of the levels thus enabling the trader to be able to attach the indicator several times with differe
FREE
This is a multi-timeframe indicator that detects and displays support and resistance (S&R) lines using the ZigZag indicator. Features The support and resistance lines are not redrawing. The indicator is capable of adding new support and resistance levels as they appear. Each S&R line has a tooltip that displays the price level and start time. Save time for multi-timeframe analysis on trades. All types of alerts (sound, pop-up, email, mobile push notification) are available. Working with al
Automatic Fibonacci Tool Fibonacci retracements is a popular instrument used by technical analysts to determine potential Support and Resistance areas. In technical analysis, this tool is created by taking two extreme points (usually a peak and a minimum) on the chart and dividing the vertical distance by the key Fibonacci coefficients equal to 23.6%, 38.2%, 50%, 61.8%, and 100%. Our Automatic Fibonacci Tool is programmed to make thigs easier. Using this tool, there is no need to explicitly set
ICT Kill zone and Macros Indicator mark and display the following zone times on the chart: Kill zones   Kill zone Forex Asian London Open New York Open London Close Central Bank Dealing range Kill zone Indices Asian London Open New York AM New York Lunch New York PM Power Hour Macros London 1 London 2 New York Am 1 New York AM 2 New York Lunch New York PM 1 New York PM 2 Silver bullet London Open New York AM New York PM Sessions Asian London New York Chart The display of  Kill zone ,
UR Gamma MT5
Krzysztof Jan Debski
UR Gamma MT5 (powered by similar calculations found in Machine Learning systems) UR Gamma MT5   is a cutting-edge financial analysis tool that offers a new and improved take on the classic WaveTrend indicator. By incorporating advanced Digital Signal Processing techniques, UR Gamma addresses some of the limitations of traditional WaveTrend algorithms and provides a more accurate, robust and dynamic approach to identifying and measuring trends in price action. Advantages of using UR Gamma MT5
Buyers of this product also purchase
Atomic Analyst MT5
Issam Kassas
3.64 (11)
First of all Its worth emphasizing here that this Trading Indicator is   Non-Repainting ,   Non-Redrawing   and   Non-Lagging   Indicator, Which makes it ideal from both manual and robot trading.  The Atomic Analyst  is a PA Price Action Indicator that uses Strength and Momentum of the price to find a better edge in the market. Equipped with an AI filter which help remove noises and false signals, and Increase Trading Potential. Using Multiple layers of complex Indicators, the Atomic Analyst
First of all Its worth emphasizing here that this Trading System is Non-Repainting , Non-Redrawing and Non-Lagging Indicator , Which makes it ideal from both manual and robot trading .  The Smart Trend Trading System MT5 is a comprehensive trading solution tailored for new and experienced traders . It combines over 10 premium indicators and features more than 7 robust trading strategies , making it a versatile choice for diverse market conditions . Trend Following Strategy : Provides precise ent
Quantum Trend Sniper
Bogdan Ion Puscasu
5 (37)
Introducing   Quantum Trend Sniper Indicator , the groundbreaking MQL5 Indicator that's transforming the way you identify and trade trend reversals! Developed by a team of experienced traders with trading experience of over 13 years,   Quantum Trend Sniper Indicator   is designed to propel your trading journey to new heights with its innovative way of identifying trend reversals with extremely high accuracy. ***Buy Quantum Trend Sniper Indicator and you could get Quantum Breakout Indicator fo
Trend Screener Pro MT5
STE S.S.COMPANY
4.89 (61)
Unlock the Power of  Trends trading with Trend Screener Indicator: Your Ultimate Trend Trading Solution powered by fuzzy logic and Multi-currencies System ! Elevate your trend trading with Trend Screener, the revolutionary trend indicator powered by   fuzzy logic.  It is a powerful trend-following indicator that combines over  13 premium tools and features and 3 trading strategies  , making it a versatile choice to   make your Metatrader a Trend Analyzer. LIMITED TIME OFFER : Trend Screener Indi
FX Volume MT5
Daniel Stein
4.94 (17)
Visit our all-new   Stein Investments Welcome Page   to get the latest information, updates and trading strategies. FX Volume is the FIRST and ONLY volume indicator that provides a REAL insight into the market sentiment from a broker's point of view. It provides awesome insights into how institutional market participants, like brokers, are positioned in the Forex market, much faster than COT reports. Seeing this information directly on your chart is the real game-changer and breakthrough solut
FX Power MT5 NG
Daniel Stein
5 (4)
Trading GOLD, and currencies, with the dog walk strategy  - super smart Trading GOLD, and currencies, with the breakout strategy  - super easy Visit our all-new   Stein Investments Welcome Page   to get the latest information, updates and trading strategies. FX Power MT5 NG  is the next generation of our long-time very popular currency strength meter, FX Power.  And what does this next-generation strength meter offer? Everything you have loved about the original FX Power  PLUS GOLD/XAU st
First of all Its worth emphasizing here that this Trading Tool is Non Repainting , Non Redrawing and Non Lagging Indicator , Which makes it ideal for professional trading . The Smart Price Action Concepts Indicator is a very powerful tool for both new and experienced traders . It packs more than 20 useful indicators into one , combining advanced trading ideas like Inner Circle Trader Analysis and Smart Money Concepts Trading Strategies . This indicator focuses on Smart Money Concepts , prov
Advanced Supply Demand MT5
Bernhard Schweigert
4.53 (15)
Best Solution for any Newbie or Expert Trader! This indicator is a unique, high quality and affordable trading tool because we have incorporated a number of proprietary features and a new formula. With this update, you will be able to show double timeframe zones. You will not only be able to show a higher TF but to show both, the chart TF, PLUS the higher TF: SHOWING NESTED ZONES. All Supply Demand traders will love it. :) Important Information Revealed Maximize the potential of Advanced Suppl
RelicusRoad Pro MT5
Relicus LLC
4.81 (21)
How many times have you bought a trading indicator with great back-tests, live account performance proof with fantastic numbers and stats all over the place but after using it, you end up blowing your account? You shouldn't trust a signal by itself, you need to know why it appeared in the first place, and that's what RelicusRoad Pro does best! NOW $147 (increasing to $499 after a few updates) - UNLIMITED ACCOUNTS (PCs or MACs) **  User Manual + Strategies + Training Videos + Private Group with
XQ Indicator MetaTrader 5
Marzena Maria Szmit
5 (1)
Step into the realm of Forex trading with confidence and precision using XQ, a cutting-edge Forex indicator designed to elevate your trading game to unprecedented heights. Whether you're a seasoned trader or just stepping into the world of currency exchange, XQ Forex Indicator empowers you with the insights and signals needed to make informed trading decisions. The signal conditions are a combination of three indicators, and XQ Forex Indicator only display  medium and long-term trends . The ind
Volume by Price MT5
Brian Collard
5 (3)
The Volume by Price Indicator for MetaTrader 5 features Volume Profile and Market Profile TPO (Time Price Opportunity). Get valuable insights out of currencies, equities and commodities data. Gain an edge trading financial markets. Volume and TPO histogram bar and line charts. Volume Footprint charts. TPO letter and block marker charts including split structures. Versatile segmentation and compositing methods. Static, dynamic and flexible ranges with relative and/or absolute visualizations. Lay
Introducing   Quantum Breakout PRO , the groundbreaking MQL5 Indicator that's transforming the way you trade Breakout Zones! Developed by a team of experienced traders with trading experience of over 13 years,   Quantum Breakout PRO   is designed to propel your trading journey to new heights with its innovative and dynamic breakout zone strategy. Quantum Breakout Indicator will give you signal arrows on breakout zones with 5 profit target zones and stop loss suggestion based on the breako
Top indicator for MT5   providing accurate signals to enter a trade without repainting! It can be applied to any financial assets:   forex, cryptocurrencies, metals, stocks, indices .  Watch  the video  (6:22) with an example of processing only one signal that paid off the indicator! MT4 version is here It will provide pretty accurate trading signals and tell you when it's best to open a trade and close it. Most traders improve their trading results during the first trading week with the help of
ICT, SMC, SMART MONEY CONCEPTS, SMART MONEY, Smart Money Concept, Support and Resistance, Trend Analysis, Price Action, Market Structure, Order Blocks, BOS/CHoCH,   Breaker Blocks ,  Momentum Shift,   Supply&Demand Zone/Order Blocks , Strong Imbalance,   HH/LL/HL/LH,    Fair Value Gap, FVG, Inversion FVG, IFVG,  Premium  &   Discount   Zones, Fibonacci Retracement, OTE, Buy Side Liquidity, Sell Side Liquidity, BSL/SSL Taken, Equal Highs & Lows, MTF Dashboard, Multiple Time Frame, BigBar, HTF OB
AW Trend Predictor MT5
AW Trading Software Limited
4.76 (54)
The combination of trend and breakdown levels in one system. An advanced indicator algorithm filters market noise, determines the trend, entry points, as well as possible exit levels. Indicator signals are recorded in a statistical module, which allows you to select the most suitable tools, showing the effectiveness of the signal history. The indicator calculates Take Profit and Stop Loss marks. Manual and instruction ->  HERE  / MT4 version ->  HERE How to trade with the indicator:  Trading wit
Auto Order Block with break of structure based on ICT and Smart Money Concepts Futures Break of Structure ( BoS )             Order block ( OB )            Higher time frame Order block / Point of Interest ( POI )    shown on current chart           Fair value Gap ( FVG ) / Imbalance   ,  MTF      ( Multi Time Frame )    Volume Imbalance     ,  MTF          vIMB Gap’s Equal High / Low’s     ,  MTF             EQH / EQL Liquidity               Current Day High / Low           HOD /
Blahtech Supply Demand MT5
Blahtech Limited
4.57 (14)
Was: $299  Now: $99   Supply Demand uses previous price action to identify potential imbalances between buyers and sellers. The key is to identify the better odds zones, not just the untouched ones. Blahtech Supply Demand indicator delivers functionality previously unavailable on any trading platform. This 4-in-1 indicator not only highlights the higher probability zones using a multi-criteria strength engine, but also combines it with multi-timeframe trend analysis, previously confirmed swings
Gann Squares Indicator: Analyzing Markets with Geometric Patterns The Gann Squares indicator is a powerful tool for market analysis that draws upon the mathematical concepts introduced by W.D. Gann in his article on "Mathematical Formula for Market Predictions." This indicator incorporates Gann's techniques involving square numbers such as 144, 90, and 52, as well as the Square of 9. Additionally, it incorporates  method for utilizing the Square of 9 in conjunction with channels and the star pa
TrendMaestro5
Stefano Frisetti
note: this indicator is for METATRADER4, if you want the version for METATRADER5 this is the link:  https://www.mql5.com/it/market/product/108106 TRENDMAESTRO recognizes a new TREND in the bud, he never makes mistakes. The certainty of identifying a new TREND is priceless. DESCRIPTION TRENDMAESTRO identifies a new TREND in the bud, this indicator examines the volatility, volumes and momentum to identify the moment in which there is an explosion of one or more of these data and therefore the mome
Profit from market structure changes as price reverses and pulls back. The market structure reversal alert indicator identifies when a trend or price move is approaching exhaustion and ready to reverse. It alerts you to changes in market structure which typically occur when a reversal or major pullback are about to happen. The indicator identifies breakouts and price momentum initially, every time a new high or low is formed near a possible exhaustion point. The indicator draws in a rectangle on
Trend Line Map Pro MT5
STE S.S.COMPANY
4.67 (9)
Trend Line Map indicator is an addons for   Trend Screener Indicator . It's working as a scanner for all signals generated by Trend screener ( Trend Line Signals ) . It's a Trend Line Scanner based on Trend Screener Indicator.  If you don't have Trend Screener Pro Indicator,   the Trend Line Map Pro will not work.     LIMITED TIME OFFER : Trend Line Map Indicator is available for only 50 $ and lifetime. ( Original price 125$ ) By accessing to our MQL5 Blog,  you can find all our premium indica
TrendLine PRO MT5
Evgenii Aksenov
4.78 (49)
The Trend Line PRO indicator is an independent trading strategy. It shows the trend change, the entry point to the transaction, as well as automatically calculates three levels of Take Profit and Stop Loss protection Trend Line PRO is perfect for all Meta Trader symbols: currencies, metals, cryptocurrencies, stocks and indices Advantages of Trend Line PRO Never redraws its signals The possibility of using it as an independent strategy It has three automatic levels Take Profit and Stop Loss lev
Owl Smart Levels MT5
Sergey Ermolov
4.47 (36)
MT4 version  |   FAQ The Owl Smart Levels Indicator is a complete trading system within the one indicator that includes such popular market analysis tools as Bill Williams' advanced fractals , Valable ZigZag which builds the correct wave structure of the market, and Fibonacci levels which mark the exact levels of entry into the market and places to take profits. Detailed description of the strategy Instructions for working with the indicator Advisor-assistant in trading Owl Helper Private User
TPSproTREND PrO MT5
Roman Podpora
5 (5)
TPSpro TRENDPRO  - is a trend indicator that automatically analyzes the market and provides information about the trend and each of its changes, as well as giving signals for entering trades without redrawing! The indicator uses each candle, analyzing them separately. referring to different impulses - up or down impulse. Exact entry points into transactions for currencies, crypto, metals, stocks, indices!  -  Version MT4                  DETAILED DESCRIPTION        /       TRADING SETUPS       
Gartley Hunter Multi
Siarhei Vashchylka
5 (5)
Gartley Hunter Multi - An indicator for searching for harmonic patterns simultaneously on dozens of trading instruments and on all classic timeframes: (m1, m5, m15, m30, H1, H4, D1, Wk, Mn). Manual (Be sure to read before purchasing) | Version for MT4 Advantages 1. Patterns: Gartley, Butterfly, Shark, Crab. Bat, Alternate Bat, Deep Crab, Cypher 2. Simultaneous search for patterns on dozens of trading instruments and on all classic timeframes 3. Search for patterns of all possible sizes. Fr
Was: $249  Now: $99   Market Profile defines a number of day types that can help the trader to determine market behaviour. A key feature is the Value Area, representing the range of price action where 70% of trading took place. Understanding the Value Area can give traders valuable insight into market direction and establish the higher odds trade. It is an excellent addition to any system you may be using. Inspired by Jim Dalton’s book “Mind Over Markets”, this indicator is designed to suit the
Black Dragon indicator mt5
Ramil Minniakhmetov
4.82 (56)
The trend detection indicator will compliment any strategy and can also be used as an independent tool. IMPORTANT! Contact me immediately after the purchase to get instructions and a bonus!  Benefits  Easy to use; does not overload the graphic wih unnecessary information. The ability to use as filter for any strategy. Contains bult -in dynamic levels of cupport and resistange,  which can be used both, for profit taking, and for settings up stop-losses. The indicator does not change color after t
Golden Spikes Detector
Batsirayi L Marango
5 (1)
Golden Spikes Detector This indicator is based on an advanced strategy primarily for trading spikes on Boom and Crash Indices. Complex algorithms were implemented to detect high probability entries only. It alerts on potential Buy and Sell entries. To trade spikes on the Deriv or Binary broker, only take Buy Boom and Sell Cash alerts. It was optimised to be loaded on 5-minute timeframe although multiple timeframe analysis is done in the background. Features ·             Desktop pop up and sound
Matrix Arrow Indicator MT5
Juvenille Emperor Limited
5 (14)
Matrix Arrow Indicator MT5  is a unique 10 in 1 trend following   100% non-repainting  multi-timeframe indicator that can be used on all symbols/instruments:   forex,   commodities,   cryptocurrencies,   indices,   stocks .  Matrix Arrow Indicator MT5  will determine the current trend at its early stages, gathering information and data from up to 10 standard indicators, which are: Average Directional Movement Index (ADX) Commodity Channel Index (CCI) Classic Heiken Ashi candles Moving Aver
Smart Peak Bottom
Xiaoyu Huang
5 (2)
This is a clear indicator for judging tops and bottoms, and it works well for Oscillating market. Promotional price 49$ → 59$ features good at judging tops and bottoms No redrawing, no drifting Fast calculation, no lag Rich reminder mode Multiple parameters and colors can be adjusted parameter "======== Main ========" HighLowPeriod1 = 9 HighLowPeriod2 = 60 HighLowPeriod3 = 34 HighLowEMAPeriod = 4 MASignalPeriod = 5 "======== Notify ========" UseAlertNotify = true; UseMetaQuotesIDNotify =
More from author
Welcome to RSI Colored Candles, an innovative indicator designed to enhance your trading experience by integrating the Relative Strength Index (RSI) directly onto your price chart. Unlike traditional RSI indicators, RSI Colored Candles utilizes a four-color scheme to represent RSI levels directly on your candlesticks, providing you with valuable insights at a glance. Features and Benefits: Space-saving Design: Say goodbye to cluttered indicator windows! RSI Colored Candles saves valuable chart
FREE
introducing the Golden Sniper Indicator, a powerful MQL5 tool meticulously crafted for traders seeking to enhance their trading experience. Developed by a team of seasoned traders with over 6 years of expertise, this indicator offers a reliable method for identifying trading opportunities with remarkable accuracy. Key Features : Alerts and Signal Arrows : The Golden Sniper Indicator provides timely alerts and visual signal arrows, helping you identify trend reversals. Risk Management : It sug
Experience the power of Demark Trends Indicator for comprehensive trend analysis and trading insights. Demark indicators are renowned for their effectiveness in assessing market trends and exhaustion points. Our Demark Trends Indicator takes this expertise to the next level, automatically drawing precise trendlines on your charts. With customizable parameters, including the number of candles in calculations, alarm settings, and line colors, you have full control over your analysis. Whether you'
FREE
Harmonic Patterns are utilized for predicting market turning points with precision. These patterns offer a high win rate and numerous trade opportunities within a single trading day. Our indicator identifies the most prominent Harmonic Patterns based on principles outlined in Harmonic Trading literature. **IMPORTANT NOTES:** - The indicator does not repaint, lag, or redraw. It accurately identifies patterns at the D point, ensuring reliability in pattern detection.    **HOW TO USE:** 1. D
FREE
Harmonic Patterns are utilized for predicting market turning points with precision. These patterns offer a high win rate and numerous trade opportunities within a single trading day. Our indicator identifies the most prominent Harmonic Patterns based on principles outlined in Harmonic Trading literature. **IMPORTANT NOTES:** - The indicator does not repaint, lag, or redraw. It accurately identifies patterns at the D point, ensuring reliability in pattern detection.    **HOW TO USE:** 1. Dr
Swing Sniper
Ely Alsedy
5 (3)
it depends on channels and moving average in sketching the chart in two colors the default colors are gold and light blue to highlight the area of downtrend and the area of uptrend TO ADJUST THE INDICATOR YOU CAN CHNGE THE FOLLOWING: 1- the look back period which affects the length of the moving average  2- the multiplier which affects the point of swing in the trend 3- the channel shift which affects how close the line is moving to the price the default settings are the best for the indicator B
Swing Tracer
Ely Alsedy
5 (2)
it depends on ATR period to get swing points to help make better trading decisions  blue dot and red dot is the default color scheme of course you can change it later if you'd like  you can change the following : ATR PERIOD  sending notifications number of times to send notifications  sending notifications to your smart phone that's it very simple to use just drag and drop and follow the trend 
Filter:
No reviews
Reply to review
Version 2.0 2024.01.29
FIXED BUGS
ADD NEW METHODS
ADD FUTURE PIVOTS CALCULATIONS
MORE CONTROL OVER LINES ; FONTS AND LABELS