MetaForecast M5
- Indicators
- Vahidreza Heidar Gholami
- Version: 2.1
- Updated: 18 April 2024
- Activations: 10
MetaForecast predicts and visualizes the future of any market using different powerful methods. While financial markets are not always predictable, if there are patterns in the past data, MetaForecast can learn and predict the future as accurately as possible. It features a complete implementation of neural networks embedded directly into the indicator, enabling traders to create and train AI models using data from multiple symbols to learn complex patterns. MetaForecast leverages your computer's GPU for lightning-fast training and inference, ensuring you stay ahead of the curve.
Input Parameters
Forecast Method
Choose a forecasting method from this list to be used to create a model responsible for predicting the future. Currently, there are two methods available: Trigonometric and Neural Network. This list may grow in later versions, with more methods being added.
| Method | Description |
|---|---|
| Trigonometric | Creates a sinusoidal model and learns harmonic patterns in past data to predict the future. |
| Neural Network (AI) | Creates a neural network model that can be trained on multiple symbols to learn complex patterns and dependencies between past and future. |
The settings are organized into multiple sections. The first section, Common Settings, encompasses configurations shared across different methods. Subsequent sections are dedicated to method-specific settings.
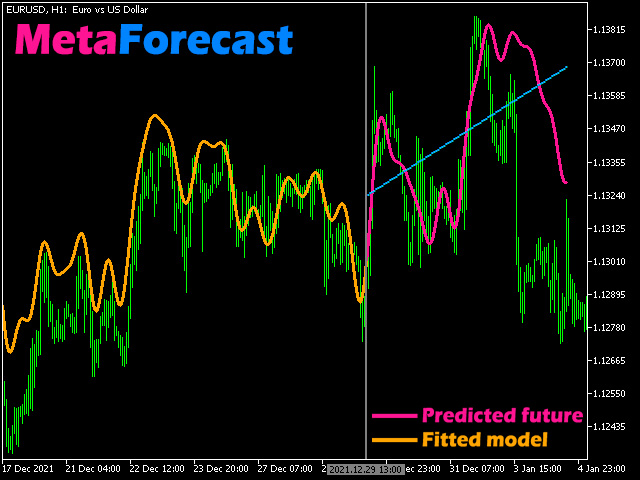
Past Size
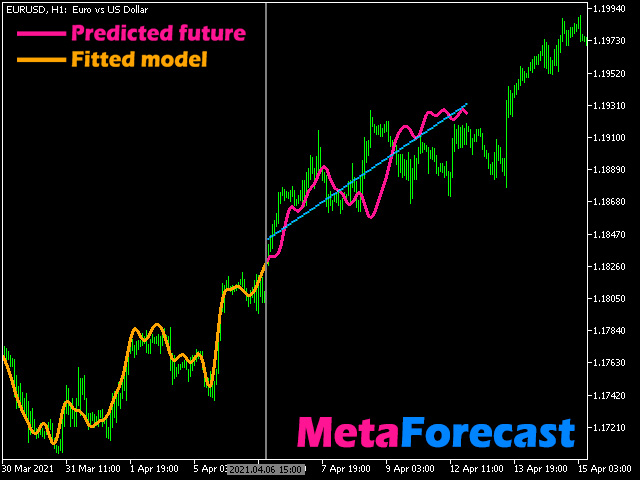
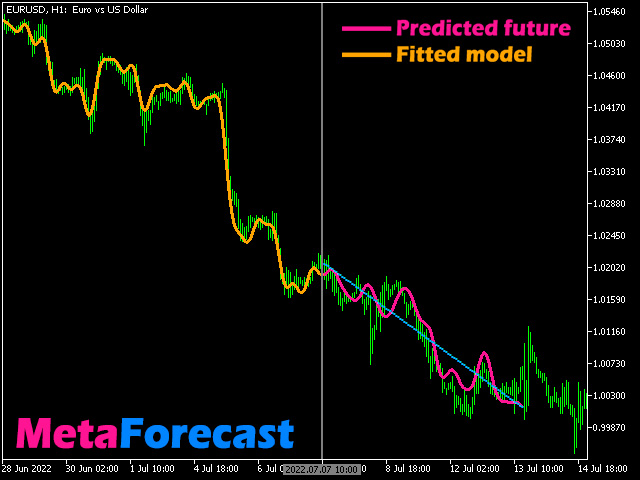
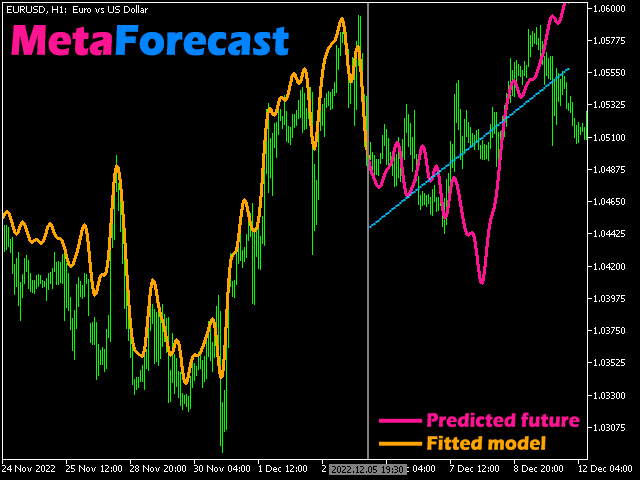
Specifies the number of bars that MetaForecast uses to create a model for generating future predictions. The model is represented by a yellow line drawn over the selected bars.
Future Size
Specifies the number of future bars that should be predicted. The predicted future is shown by a pink line with blue regression lines drawn over it.
Degree
This input determines the level of analysis that MetaForecast will conduct on the market.
| Degree | Description |
|---|---|
| 0 | For degree 0, it is recommended to use a large value for the "Past size" input to cover all peaks and troughs and details in the price. |
| 1 | For degree 1, MetaForecast can understand trends and generate better results with a smaller "Past size". |
| 2 | For degree 2, in addition to trends, MetaForecast can also identify reversal points. For degrees greater than 1, higher values for the 'Details' and 'Noise Reduction' inputs must be used. |
| >2 | It is not recommended to use degrees greater than 2, but it can be tried. |
Details
Specifies the percentage of details in the price data that should be extracted for generating predictions. Higher values need higher processing time.
Noise Reduction
When using degrees greater than 1, MetaForecast needs noise reduction for the input data in order to create a proper model. For example, for degree=2, set the noise reduction to be 90%. To obtain a better result, increase the details to 20%.
Remove jumps
Sometimes, there are big jumps in the prediction results, especially for degrees higher than 1. Enabling this input can correct the shape of the prediction.
Regression lines
MetaForecast draws regression lines on the predicted bars to make the trend clearer. Use this input to specify the number of lines.
Forecasting Period
Set the interval between two predictions using this input. For example, if you set it to 100, it means that it predicts the future and then pause for 100 bars before making the next prediction.
Symbols
You can use multiple symbols to train an AI model. The symbols should be written seperated by commas. Leave this field empty to use the current chart's symbol. When using multiple symbols, you don't need to include the current chart's symbol – it will be automatically added to the list.
Layers
This input configures a brain for your AI model. For example, if we enter [1000, 2000, 100], this indicates that the model accepts 1000 past bars as input, utilizes 2000 neurons to forecast 100 bars into the future. If we enter [1000, 2000, 500, 200, 100], this signifies that the model accepts 1000 past bars as input and employs a deep neural network with 3 layers containing 2000, 500, and 200 neurons, respectively, to forecast 100 bars into the future. As you can see, you can create a network with any desired depth. For the examples above, a minimum past size of 1000 is recommended. However, a past size of 3000 is generally better. As a rule of thumb, the larger the size of the layers in your model, the larger the past size should be.
Epochs
Imagine you're teaching a student a new skill. You wouldn't just explain it once and expect them to be a master. They need to practice repeatedly to improve. In AI, epochs are like those practice sessions. It refers to the number of times the entire training dataset is shown to the AI model. Each time the model sees the data, it adjusts itself slightly to get better at the task.
Loss
The purpose of training a model is to decrease the loss. Loss refers to the average amount of error the model makes on its predictions. The training process will be stopped when the model's loss falls below the specified value in this input. If you want a model to perfectly replicate the past, you would need to set both Noise Reduction and Loss inputs to zero. However, this is usually not desirable, as a model that simply memorizes the data might not perform well on unseen examples.
Learning rate
When training a model, the learning rate controls how much the model adjusts its parameters after each epoch. A high learning rate leads to large adjustments, which can be fast but inaccurate. Conversely, a low learning rate results in small adjustments, making the learning process slower but potentially more precise.
Autoregressive
Enable Autoregressive if the future size (number of future values to predict) is greater than the output of your model. This way, MetaForecast uses the model multiple times to forecast the future.
Learn Complex Pattern
Enabling this input allows the model to learn any kind of pattern in the data. Conversely, if you don't want the model to learn or memorize random patterns, disable this input. This will force the model to focus on learning only repeatable patterns.
Multimodel
This option allows you to create multiple models with different internal parameters. For example, with Multimodel set to 10, MetaForecast creates 10 models that work together to predict the future. The combined result will be displayed as a band. The average of the predictions will be calculated and drawn as a pink line.
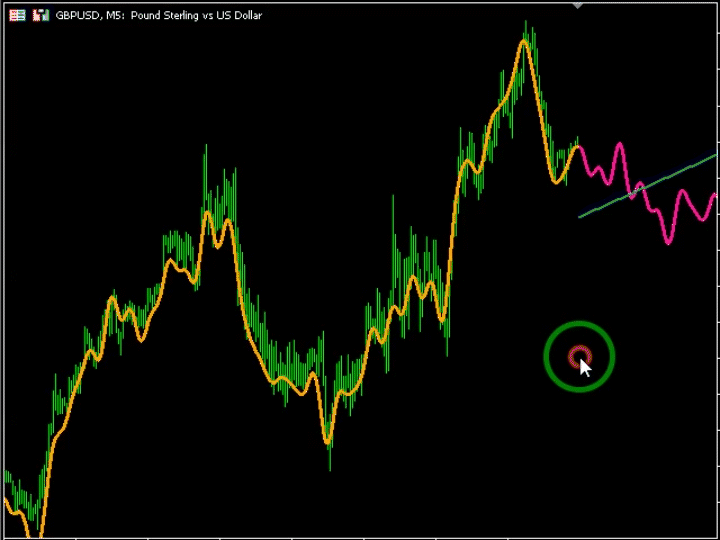
History Mode
MetaForecast enables traders to predict future price movements in the price history, allowing them to compare the results with actual future prices. To use this feature, press "H" on your keyboard to see the vertical line, which can be moved to bring the prediction into historical prices, rather than the current candle. To navigate through history, hold down the "Ctrl" key and move your mouse to move the vertical line. To get back to the current candle press "H" again. If you have multiple MetaForecasts on your chart and need to reset them simultaneously, press the "R" key on your keyboard.
Neural Network Method
To train an AI model, simply press T and wait for the training process to finish. The future values will be estimated and displayed afterward. In history mode, you can use the same model to predict from different points in time into the future simply by moving the history mode's vertical line.
How to Test
The recommended settings for testing this product using the Strategy Tester are as follows. Leave other settings not mentioned here at their default values.
Past Size = 3000
Forecasting Period = 100
Train on each new forecast = true
Please note that in the current version, the method Neural Network only works on GPUs. You can check your available GPU devices in the terminal by navigating to Tools > Options > OpenCL. Under the "Device" column, you will see your available GPUs with the option to disable or enable each one. MetaForecast automatically selects the best available GPU device.
I'm always exploring new ideas to forecast the market's future. Whenever I discover a new working method or algorithm, I incorporate it into the product. I'd appreciate your support in allowing me to continue developing this unique offering.


I absolutely love it. You don't need to waste your time searching out all the support and resistance levels. For me it is very very lucrative trading the 1 hr timeframe with this indicator. Especially on pairs that are more trendy. Even BTC trading is easily possible with this indicator. Absolutely great!